Attached files
| file | filename |
|---|---|
| 8-K - 8-K - FEDERAL HOME LOAN MORTGAGE CORP | d476285d8k.htm |
| EX-99.1 - EXHIBIT 99.1 - FEDERAL HOME LOAN MORTGAGE CORP | d476285dex991.htm |
| EX-99.2 - EXHIBIT 99.2 - FEDERAL HOME LOAN MORTGAGE CORP | d476285dex992.htm |
 Fourth Quarter 2012
Financial Results
Supplement
February 28, 2013
Exhibit 99.3 |
 2
Table of contents
Business Results
Credit Supplement
3 -
Quarterly Net Income and Comprehensive Income
20 -
National Home Prices
4 -
Full-Year Net Income and Comprehensive Income (Loss)
21 -
State-by-State Home Prices: June 2006 to December 2012
5 -
Comprehensive Income (Loss)
22 -
State-by-State Home Prices: December 2011 to December 2012
6 -
Treasury Draw Requests and Dividend Payments
23 -
Mortgage Market and Freddie Mac Serious Delinquency Rates
7 -
Total Equity (Deficit) and Senior Preferred Stock Activity
24 -
8 -
Total Other Comprehensive Income (Loss)
25 -
9 -
Loan Loss Reserves
26 -
10 -
Real Estate Owned
27 -
11 -
28 -
12 -
29 -
13 -
30 -
Multifamily Portfolio Composition
14 -
31 -
Multifamily New Business Volume by State
15 -
32 -
Multifamily Mortgage Portfolio UPB Concentration by State
16 -
33 -
Multifamily Mortgage Portfolio by Attribute
17 -
34 -
Multifamily Mortgage Portfolio by Attribute, Continued
18 -
Purchase Agreement Portfolio Limits
35 -
Multifamily Market and Freddie Mac Delinquency Rates
Loan Purpose of Single-Family Credit Guarantee Portfolio
Purchases
Credit Quality of Single-Family Credit Guarantee Portfolio Purchases
Single-Family Credit Guarantee Portfolio Characteristics
Single-Family 4Q 2012 Credit Losses and REO by Region and State
Single-Family Credit Profile by Book Year and Product Feature
Market Liquidity Provided
Single-Family Cumulative Foreclosure Transfer and Short Sale
Rates by Book Year
Single-Family Refinance Activity
Single-Family Loan Workouts
Repurchase Requests
Performance of Single-Family Modified Loans
Single-Family Loan Modifications
Administrative Expenses and Efficiency |
 3
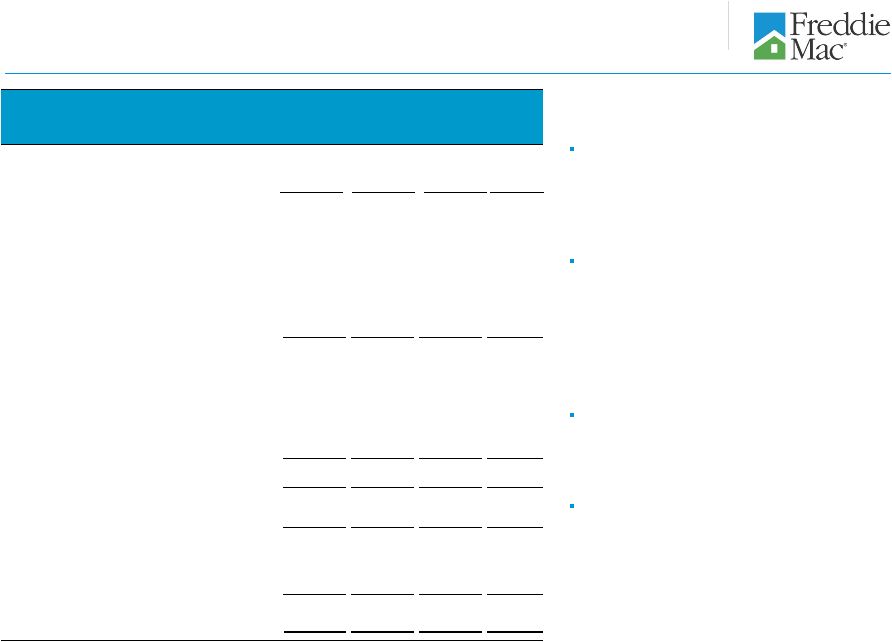
Quarterly net income and comprehensive income
Line
2:
(Provision)
benefit
for
credit
losses
shifted
from
provision expense for 3Q12 to a benefit for 4Q12. The
improvement is driven by a decrease in the volume of
newly delinquent single-family loans and the positive
impact of increased national home prices.
Line 5:
Net impairment of available-for-sale (AFS)
securities increased in 4Q12 mainly due to the
implementation of a third-party model to project cash flow
estimates on Freddie Mac’s single-family non-agency
mortgage-related securities, partially offset by
improvements in forecasted home prices over the
expected life of the company’s AFS securities.
Line 13:
Income tax benefit increased in 4Q12 primarily
due to the release of tax reserves as a result of the
favorable resolution of tax matters with the Internal
Revenue Service (IRS).
Line 15:
Total other comprehensive income decreased in
4Q12. The decrease mostly reflects that 3Q12 results
benefited from significant spread tightening on non-agency
AFS securities whereas non-agency spreads were
relatively flat in 4Q12.
($ Millions)
4Q 2012
vs
4Q 2011
3Q 2012
4Q 2012
3Q 2012
1
Net interest income
$4,683
$4,269
$4,456
$187
2
(Provision) benefit for credit losses
(2,578)
(610)
700
1,310
3
Net interest income after provision for credit
losses
2,105
3,659
5,156
1,497
Non-interest income (loss)
4
Derivative gains (losses)
(766)
(488)
(22)
466
5
Net impairment of available-for-sale securities
recognized in earnings
(595)
(267)
(1,239)
(972)
6
Other non-interest income
390
195
5
(190)
7
Non-interest income (loss)
(971)
(560)
(1,256)
(696)
Non-interest expense
8
Total administrative expenses
(380)
(401)
(422)
(21)
9
Real estate owned operations income (expense)
(80)
49
33
(16)
10
Other expenses
(93)
(121)
(199)
(78)
11
Non-interest expense
(553)
(473)
(588)
(115)
12
Income before income tax benefit
581
2,626
3,312
686
13
Income tax benefit
38
302
1,145
843
14
Net income
619
2,928
4,457
1,529
15
Total other comprehensive income,
net of taxes
887
2,702
1,271
(1,431)
16
Comprehensive income
$1,506
$5,630
$5,728
$98 |
  4
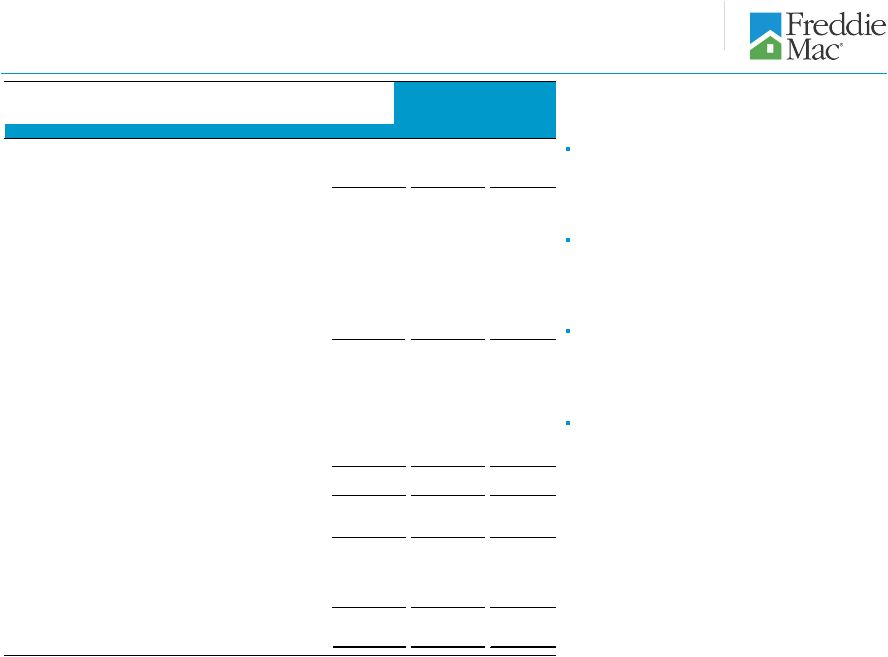
Full-year net income and comprehensive income (loss)
Line 2:
Provision for credit losses improved in 2012
driven by a decrease in the volume of newly delinquent
single-family loans and the positive impact of increased
national home prices.
Line 4:
Derivative losses decreased in 2012 primarily due
to improvement in the fair value of the company’s net pay-
fixed swap portfolio as interest rates declined less in 2012
as compared to 2011.
Line 13:
Income tax benefit increased in 2012 primarily
due to the release of tax reserves as a result of the
favorable resolution of tax matters with the Internal
Revenue Service (IRS).
Line 15:
Total other comprehensive income increased in
2012 primarily driven by the favorable impact of spread
changes on certain of the company’s non-agency AFS
securities in 2012, partially offset by lower benefit from
interest rates as rates declined less in 2012 as compared
to 2011.
($ Millions)
2012
vs
2011
2012
2011
1
Net interest income
$18,397
$17,611
($786)
2
Provision for credit losses
(10,702)
(1,890)
8,812
3
Net interest income after provision for credit
losses
7,695
15,721
8,026
Non-interest income (loss)
4
Derivative gains (losses)
(9,752)
(2,448)
7,304
5
Net impairment of available-for-sale securities
recognized in earnings
(2,301)
(2,168)
133
6
Other non-interest income
1,175
533
(642)
7
Non-interest income (loss)
(10,878)
(4,083)
6,795
Non-interest expense
8
Total administrative expenses
(1,506)
(1,561)
(55)
9
Real estate owned operations expense
(585)
(59)
526
10
Other expenses
(392)
(573)
(181)
11
Non-interest expense
(2,483)
(2,193)
290
12
Income (loss) before income tax benefit
(5,666)
9,445
15,111
13
Income tax benefit
400
1,537
1,137
14
Net income (loss)
(5,266)
10,982
16,248
15
Total other comprehensive income,
net of taxes
4,036
5,057
1,021
16
Comprehensive income (loss)
($1,230)
$16,039
$17,269 |
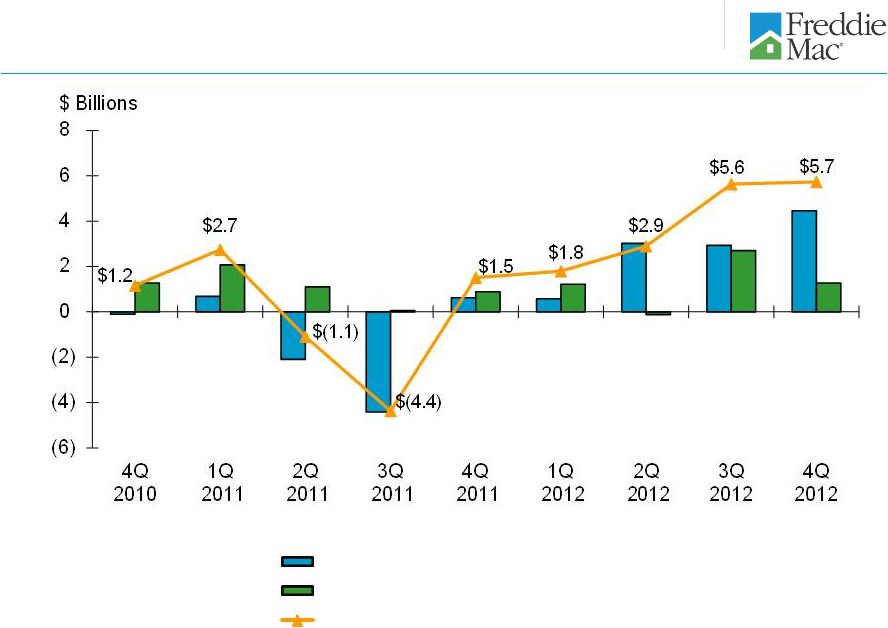 5
Comprehensive income (loss)
1
Consists of the after-tax changes in: (a) the unrealized gains and losses on
available-for-sale securities; (b) the effective portion of derivatives previously
accounted for as cash flow hedges; and (c) defined benefit plans.
A
B
C = A + B
Net income (loss)
Comprehensive income (loss)
Total
other
comprehensive
income
(loss),
net
of
taxes
1 |
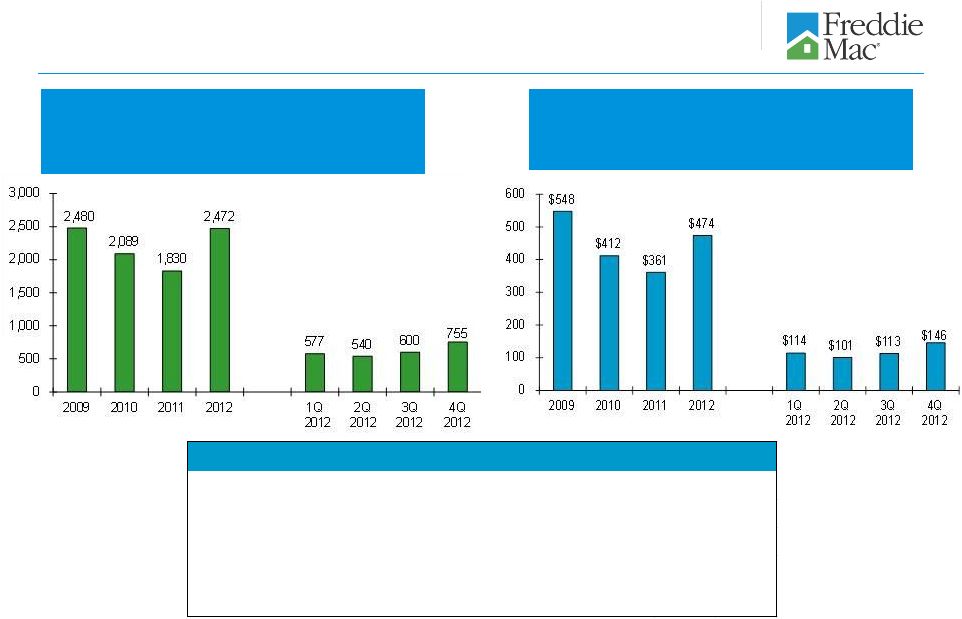
 Dividend Payment to Treasury
Draw Request from Treasury
6
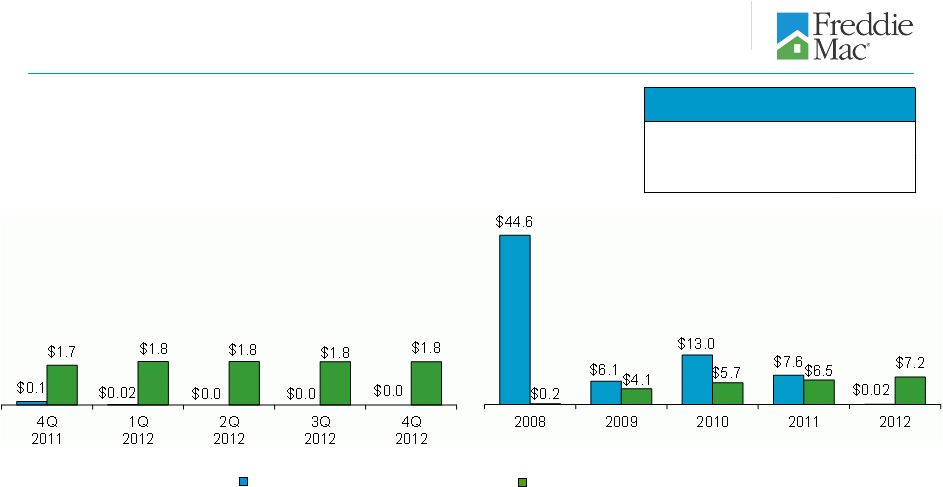
Treasury draw requests and dividend payments
1
Excludes the initial liquidation preference of Freddie Mac’s senior preferred
stock of $1.0 billion. 2
Quarterly
amounts
represent
the
draw
requested
based
on
Freddie
Mac’s
net
worth
deficit
for
the
quarters
presented.
Annual
amounts
represent
the
total
draws
requested
based
on Freddie Mac’s quarterly net deficits for the periods presented. Draw
requests are funded in the subsequent quarter (e.g., $19 million draw request for 1Q 2012 was funded in 2Q
2012).
3
Represents quarterly cash dividends paid by Freddie Mac to Treasury during the
periods presented. Through December 31, 2012, Treasury was entitled to receive cumulative
quarterly
cash
dividends
at
the
annual
rate
of
10%
per
year
on
the
liquidation
preference
of
the
senior
preferred
stock.
However,
the
fixed
dividend
rate
was
replaced
with
a
net
worth sweep dividend payment beginning in the first quarter of 2013. See the
company’s Annual Report on Form 10-K for the year ended December 31, 2012 for more information.
$ Billions
3
2
($ Billions)
Cumulative
Total
Treasury Draw Requests
$71.3
Dividend Payments
$23.8
1 |
 7
Total equity (deficit) and Senior Preferred Stock activity
Senior Preferred Stock Funding Available to Freddie Mac as of January 1, 2013:
»
The amount of available funding remaining under the Purchase Agreement after 2012
is $140.5 billion. This amount will
be
reduced
by
any
future
draws.
This
reflects
the
remaining
funding
available
as
of
December
31,
2009
of
$149.3
billion less the company’s net worth at December 31, 2012 of $8.8
billion. The provisions of the Purchase Agreement whereby
Treasury’s funding commitment would increase as necessary to accommodate any cumulative reduction
in our net worth during 2010, 2011, and 2012 no longer apply.
1
Includes the initial liquidation preference of Freddie Mac’s senior preferred
stock of $1.0 billion. ($ Millions)
4Q 2011
1Q 2012
2Q 2012
3Q 2012
4Q 2012
1
Beginning balance -
Total equity (deficit) / GAAP net worth
($5,991)
($146)
($18)
$1,086
$4,907
2
Capital draw funded by Treasury
5,992
146
19
0
0
3
Net income
619
577
3,020
2,928
4,457
4
Total other comprehensive income (loss), net of taxes
887
1,212
(128)
2,702
1,271
5
Comprehensive income
1,506
1,789
2,892
5,630
5,728
6
Dividends paid to Treasury
(1,655)
(1,807)
(1,809)
(1,809)
(1,808)
7
Other
2
0
2
0
0
8
Ending balance -
Total equity (deficit) / GAAP net worth
($146)
($18)
$1,086
$4,907
$8,827
9
Requested capital draw
$146
$19
$0
$0
$0
10
Aggregate liquidation preference of the senior preferred stock
(including the current quarter's requested capital draw)
1
$72,317
$72,336
$72,336
$72,336
$72,336 |
  8
Total
other
comprehensive
income
(loss)
1
1
Total other comprehensive income (loss) represents the
change in Total AOCI, net of taxes, on the company’s consolidated balance sheets. ($
Millions) 12/31/2012
12/31/2012
vs
vs
12/31/2011
9/30/2012
12/31/2012
9/30/2012
12/31/2011
Accumulated other comprehensive income (loss)
(AOCI), net of taxes, related to:
1
Total agency available-for-sale securities
$5,011
$4,212
$3,688
($524)
($1,323)
2
Total non-agency available-for-sale securities
(11,224)
(6,917)
(5,132)
1,785
6,092
3
Available-for-sale securities
(6,213)
(2,705)
(1,444)
1,261
4,769
4
Cash flow hedge relationships
(1,730)
(1,410)
(1,316)
94
414
5
Defined benefit plans
(52)
(94)
(178)
(84)
(126)
6
Total AOCI, net of taxes
($7,995)
($4,209)
($2,938)
$1,271
$5,057 |
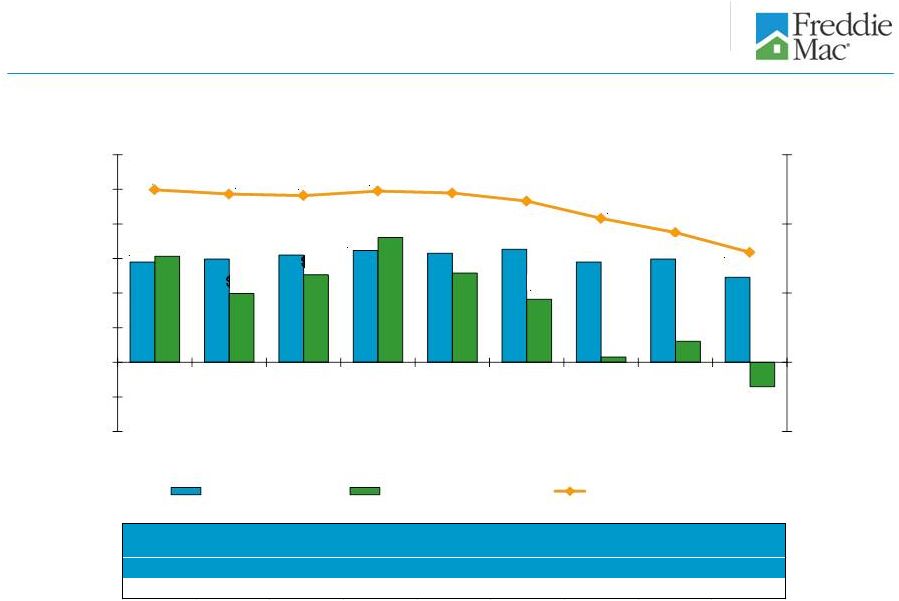 9
Loan loss reserves
1
1
1
Includes amounts related to certain loans purchased under financial guarantees and
reflected within other expenses on the company’s consolidated statements of comprehensive
income.
2
Consists of the allowance for loan losses and the reserve for guarantee losses.
3
Total mortgage portfolio, excluding non-Freddie Mac securities.
2
$2.9
$3.0
$3.1
$3.2
$3.2
$3.3
$2.9
$3.0
$2.5
$3.1
$2.0
$2.5
$3.6
$2.6
$1.8
$0.2
$0.6
($0.7)
$39.9
$39.3
$39.1
$39.7
$39.5
$38.3
$35.8
$33.8
$30.9
$5.0
$15.0
$25.0
$35.0
$45.0
($2.0)
($1.0)
$0.0
$1.0
$2.0
$3.0
$4.0
$5.0
$6.0
4Q 2010
1Q 2011
2Q 2011
3Q 2011
4Q 2011
1Q 2012
2Q 2012
3Q 2012
4Q 2012
Period End Balances
$ Billions
$ Billions
Net Charge-offs
Provision (Benefit)
Loan Loss Reserves
4Q
2010
1Q
2011
2Q
2011
3Q
2011
4Q
2011
1Q
2012
2Q
2012
3Q
2012
4Q
2012
2.03%
2.02%
2.01%
2.06%
2.08%
2.03%
1.94%
1.86%
1.71%
Reserve as % of Total Mortgage Portfolio
3 |
 10
Real
estate
owned
1
Property Inventory
2012 Activity
Geographic
Distribution
2
Based on Property Inventory
Historical Trend
Ending Property Inventory
1
Includes single-family and multifamily REO.
Multifamily ending property inventory was 20 properties as of December 31, 2011 and 6 properties as of December 31, 2012.
2
Region designation: West (AK, AZ, CA, GU, HI, ID, MT, NV, OR, UT, WA); Northeast
(CT, DE, DC, MA, ME, MD, NH, NJ, NY, PA, RI, VT, VA, WV); Southeast (AL, FL, GA, KY, MS,
NC, PR,
SC,
TN,
VI);
North
Central
(IL,
IN,
IA,
MI,
MN,
ND,
OH,
SD,
WI);
and
Southwest
(AR,
CO,
KS,
LA,
MO,
NE,
NM,
OK,
TX,
WY).
((Number of Properties)
In 2012, REO dispositions continued to exceed the volume of REO
acquisitions. We believe our single-family REO acquisition volume
in 2012 and 2011 was less than it otherwise would have been due in part to
the length of the single-family foreclosure timeline, particularly in
states where judicial foreclosures (those conducted under the supervision
of the court) are required. During 2012, our REO property inventory
declined most in the West region primarily due to increased disposition
activity and strengthening home prices in California. The North Central
region comprised 42 percent of our REO property inventory at December 31,
2012. We continue to have a significant number of properties in our
REO inventory that we are unable to list because they are occupied or in states
with a redemption period, particularly in Michigan, Minnesota and
Illinois. States with redemption periods require a period of time
after foreclosure during which the borrower may reclaim the property.
60,555
49,077
82,818
(94,296)
12/31/11
Inventory
Acquisitions
Dispositions
12/31/12
Inventory
5k
13k
21k
7k
13k
5k
11k
21k
5k
6k
-
5,000
10,000
15,000
20,000
25,000
Northeast
Southeast
North Central
Southwest
West
Number of
Properties
12/31/2011
12/31/2012
72k
65k
61k
60k
61k
59k
53k
51k
49k
0
10,000
20,000
30,000
40,000
50,000
60,000
70,000
80,000
4Q
2010
1Q
2011
2Q
2011
3Q
2011
4Q
2011
1Q
2012
2Q
2012
3Q
2012
4Q
2012
Number of
Properties |
 11
Market liquidity provided
Number of Families Freddie Mac
Helped
to
Own
or
Rent
a
Home
1
In Thousands
Purchase
and
Issuance
Volume
2
(Single-Family and Multifamily)
$ Billions
1
For the periods presented, a borrower may be counted more than once if the company
purchased more than one loan (purchase or refinance mortgage) relating to the same
borrower.
2
Includes, on a settlement date basis, purchases of mortgages, issuance of other
guarantee commitments, and purchases of non-Freddie Mac mortgage-related securities.
Number
of
Families
Freddie
Mac
Helped
to
Own
or
Rent
a
Home
1
(In Thousands)
Refinance borrowers (includes HARP)
Purchase borrowers
Multifamily rental units
Freddie
Mac
Purchase
and
Issuance
Volume
2
Cumulative Totals
Since 2009
8,871
$1.8 Trillion
6,120
1,517
1,234 |
 Relief
Refinance
–
LTV
>
100%
to
125%
(HARP)
12
Single-family
refinance
activity
1
Number of Borrowers
2, 3
In Thousands
$ Volume
3
In Billions
Non-Relief
Refinance
Relief
Refinance
–
LTV
80%
Relief
Refinance
–
LTV
>
80%
to
100%
(HARP)
$380
$306
$250
1,764
1,480
1,193
426
$91
4
4
356
$72
$351
$81
1,683
392
(In Thousands)
Number of Borrowers Freddie Mac Helped to Refinance²
Relief Refinance (Includes HARP)
Non-Relief Refinance
Freddie Mac Single-Family Refinance Volume
Cumulative Totals Since
2009
6,120
1,842
$1.3 Trillion
4,278
Relief
Refinance
–
LTV
>
125%
(HARP)
4
510
$106
1
Consists of all single-family refinance mortgage loans that we either purchased
or guaranteed during the period, including those associated with other guarantee commitments
and
Other
Guarantee
Transactions.
Prior
period
amounts
have
been
revised
to
conform
to
current
period
presentation.
2
Some
loans
have
multiple
borrowers,
but
the
company
has
counted
them
as
one
borrower
for
this
purpose.
For
the
periods
presented,
a
borrower
may
be
counted
more
than
once if the company purchased more than one refinance loan relating to the same
borrower. 3
The sum of the quarters may not equal the 2012 totals due to rounding.
4
The relief refinance mortgage initiative is Freddie Mac’s implementation of
the Home Affordable Refinance Program (HARP). Under the program, the company allows eligible
borrowers who have mortgages with high current LTV ratios to refinance their
mortgages without obtaining new mortgage insurance in excess of what was already in place.
HARP
is
targeted
at
borrowers
with
current
LTV
ratios
above
80%;
however,
Freddie
Mac’s
program
also
allows
borrowers
with
LTV
ratios
at
or
below
80%
to
participate.
4 |
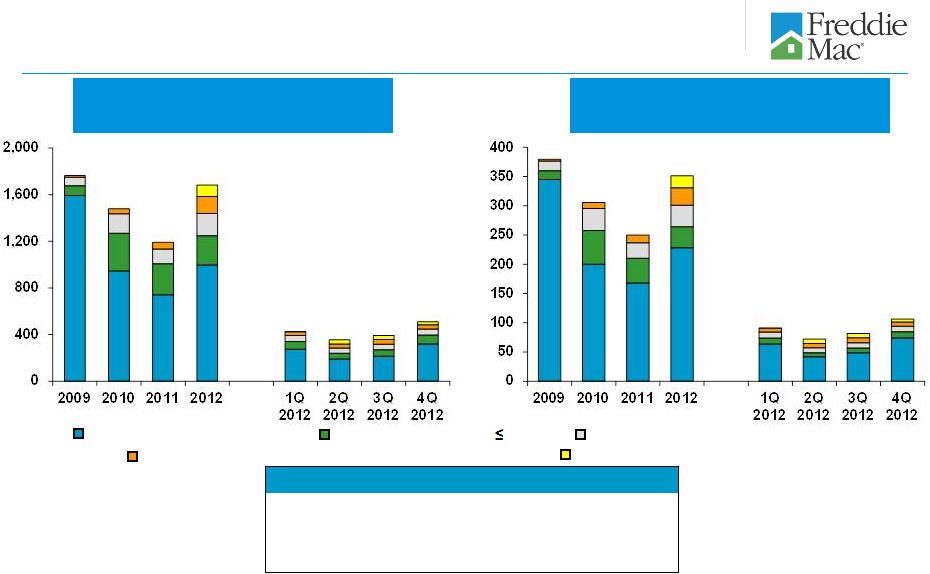
 Repayment plans
13
Loan modifications
Forbearance agreements
Short sales and deed-in-lieu of foreclosure transactions
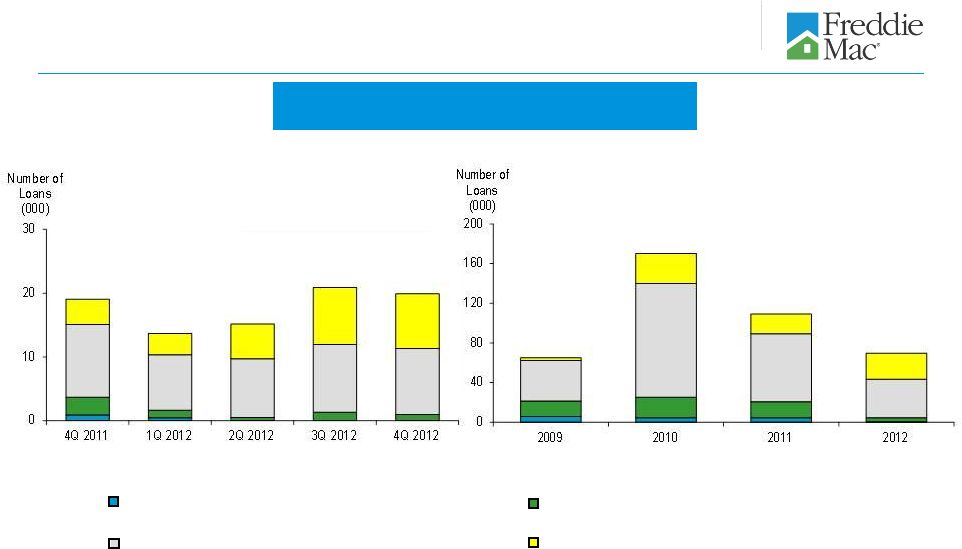
Single-family loan workouts
Home Retention Actions
1
Foreclosure Alternatives
1
44
40
41
1
These categories are not mutually exclusive and a borrower in one category may also
be included within another category in the same period. For the periods presented, borrowers
helped through home retention actions in each period may subsequently lose their
home through foreclosure or a short sale or deed-in-lieu transaction.
45
43
4Q 2011
1Q 2012
2Q 2012
3Q 2012
4Q 2012
Number of Loans
(000)
0
30
60
0
50
100
150
200
250
300
2009
2010
2011
2012
Number of Loans
(000)
133
275
208
169
Number of Families Avoiding Foreclosure
1
(In Thousands)
Families Retaining Homes
Cumulative Totals Since
2009
785
8 out of every 10 |
 No change in terms
Term extension
Reduction of contractual interest rate, and in certain cases,
term extension
Rate reduction, term extension and principal forbearance
14
Single-family loan modifications
1
Includes
completed
loan
modifications
under
HAMP
and
under
the
company’s
other
modification
programs.
Excludes
those
loan
modification
activities
for
which
the
borrower
has
started the required process, but the modification has not been made permanent or
effective, such as loans in a modification trial period. 2
Principal forbearance is a change to a loan’s terms to designate a portion of
the principal as non-interest bearing and non-amortizing.
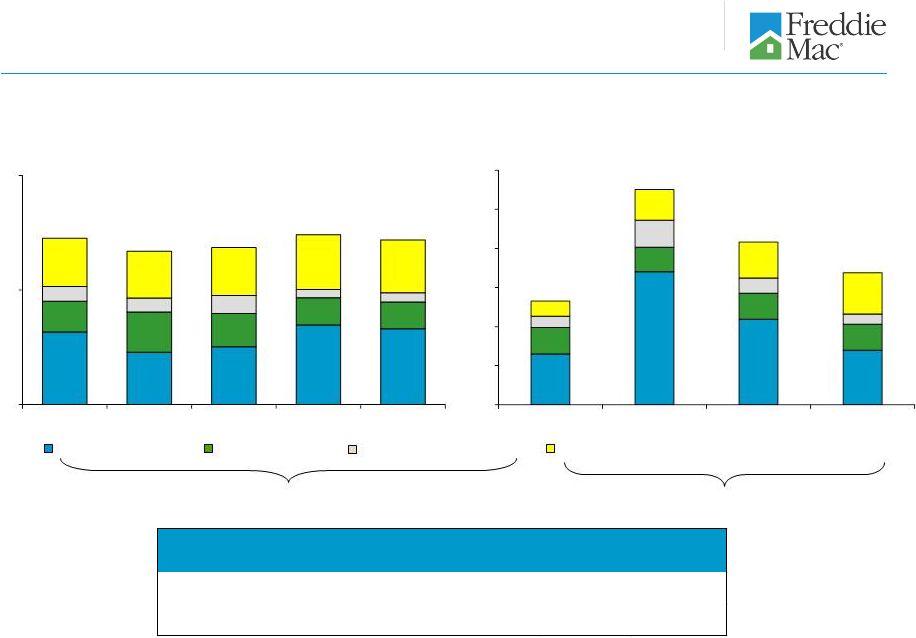
Single-family Loan Modifications
(HAMP and non-HAMP)
1
19
2
65
170
109
14
15
21
70
20 |
 15
Quarterly Percentages of Modified Single-Family Loans
(HAMP and non-HAMP)
Performance of single-family modified loans
Of the loans modified in 4Q 2010, 63% were current and performing 24 to 26 months
post modification. Of the loans modified in 3Q 2012, 84% were current and
performing 3 to 5 months post modification. 1
Represents the percentage of loans that are current and performing (no payment is 30 days or more past due) or have been paid in full. Excludes loans in modification trial periods.
2
Loan
modifications
are
recognized
as
completed
in
the
quarterly
period
in
which
the
servicer
has
reported
the
modification
as
effective
and
the
agreement
has
been
accepted
by
the
company. For loans that have been remodified (e.g., where
a borrower has received a new modification after defaulting on the prior modification) the rates reflect the status of each
modification separately. For example, in the case of a remodified loan where the
borrower is performing, the previous modification would be presented as being in default in the
applicable period.
1
Time Since Modification
4Q 2010
1Q 2011
2Q 2011
3Q 2011
4Q 2011
1Q 2012
2Q 2012
3Q 2012
3 to 5 months
82%
83%
83%
81%
86%
85%
87%
84%
6 to 8 months
76%
77%
77%
79%
80%
80%
83%
N/A
9 to 11 months
72%
73%
76%
75%
75%
77%
N/A
N/A
12 to 14 months
68%
73%
73%
71%
73%
N/A
N/A
N/A
15 to 17 months
69%
70%
69%
69%
N/A
N/A
N/A
N/A
18 to 20 months
67%
67%
68%
N/A
N/A
N/A
N/A
N/A
21 to 23 months
64%
66%
N/A
N/A
N/A
N/A
N/A
N/A
24 to 26 months
63%
N/A
N/A
N/A
N/A
N/A
N/A
N/A
% Current and Performing
Quarter of Loan Modification Completion
2 |
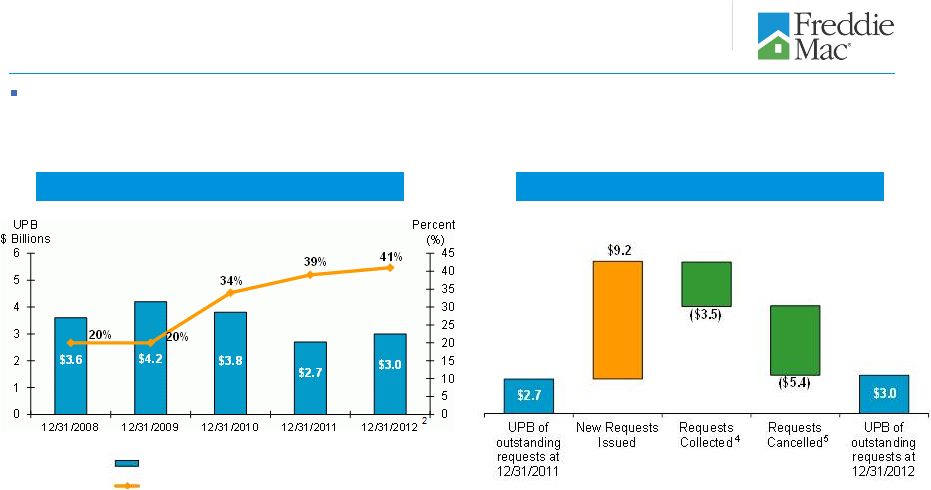 16
The UPB of outstanding repurchase requests issued to our single-family
seller/servicers based on breaches of representations and warranties
increased from $2.7 billion as of December 31, 2011 to $3.0 billion as of
December 31, 2012. 1
The amount the company expects to collect on outstanding requests is significantly
less than the unpaid principal balance (UPB) of the loans subject to repurchase requests primarily
because many of these requests are likely to be satisfied by reimbursement of the
company’s realized credit losses by seller/servicers, or rescinded in the course of the contractual appeals
process. Based on historical loss experience and the fact that many of these
loans are covered by credit enhancements (e.g., mortgage insurance), Freddie Mac expects the actual credit
losses experienced by the company should it fail to collect on these repurchase
requests to also be less than the UPB of the loans. 2
Approximately $1.2 billion of the total amount of repurchase requests outstanding
at December 31, 2012 were issued due to mortgage insurance rescission or mortgage insurance claim
denial.
3
Repurchase requests outstanding more than four months include repurchase requests
for which appeals were pending. 4
Requests collected are based on the UPB of the loans associated with the repurchase
request, which in many cases is more than the amount of payments received for reimbursement of
losses for requests associated with foreclosed mortgage loans, negotiated
settlements and other alternative remedies. 5
During
2012,
repurchase
requests
related
to
$5.4
billion
of
UPB
of
loans
were
cancelled,
primarily
as
a
result
of
the
servicer
providing
missing
documentation
or
a
successful
appeal
of
the
request. In addition, requests cancelled includes $30 million of other items
that affect the UPB of the loan while the repurchase request is outstanding, such as a change in UPB due to
payments made on the loan, as well as requests deemed uncollectible due to the
insolvency or other failure of the counterparty. Repurchase requests
Trend in Repurchase Requests Outstanding
2012 Repurchase Request Activity
$ Billions
1
Outstanding repurchase requests
Requests outstanding more than 4 months
3 |
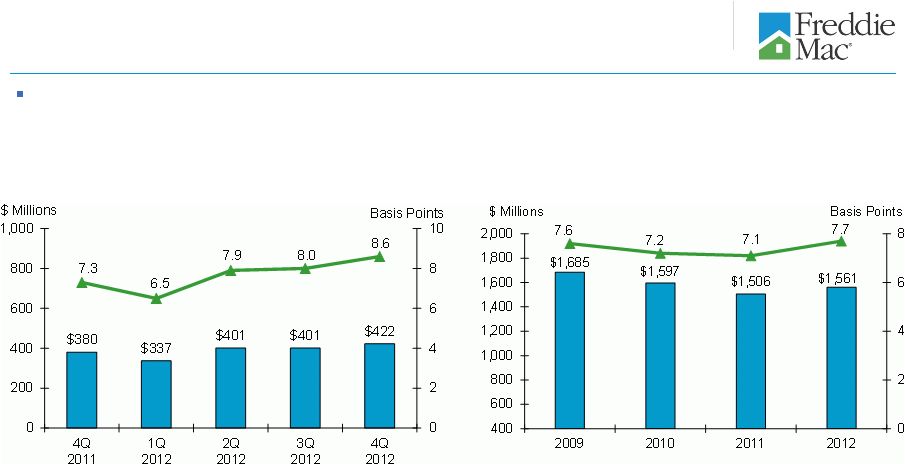 17
Administrative
expenses
and
efficiency
1
1
Administrative expenses, expressed as a percentage of the average total mortgage
portfolio. Basis points for the quarters are calculated on an annualized basis.
Administrative expenses increased during 2012 as a result of initiatives we are
pursuing under the Conservatorship Scorecard and other-FHFA mandated
strategic initiatives. |
 $653
$618
$581
$568
$558
$729
$729
$729
$729
$650
$553
12/31/2011
3/31/2012
6/30/2012
9/30/2012
12/31/2012
12/31/2013
Mortgage-related investments portfolio ending balance
Mortgage-related investments portfolio limit
18
Purchase Agreement portfolio limits
Indebtedness
1, 3
($ Billions)
Mortgage Assets
1, 2
($ Billions)
Indebtedness limit
Total debt outstanding
4
4
4
$674
$629
$590
$570
$552
$972
$874.8
$874.8
$874.8
$874.8
$780
12/31/2011
3/31/2012
6/30/2012
9/30/2012
12/31/2012
1/1/2013
The company’s Purchase Agreement with Treasury limits the amount of mortgage assets the company
can own and indebtedness it can incur. Under the Purchase Agreement, mortgage assets and
indebtedness are calculated without giving effect to the January 1, 2010 change in the accounting guidance related to the transfer of financial assets and consolidation of
variable interest entities (VIEs). See the company’s Annual Report on
Form 10-K for the year ended December 31, 2012 for more information.
Represents the unpaid principal balance (UPB) of the company’s mortgage-related investments
portfolio. The company discloses its mortgage assets on this basis monthly in its Monthly
Volume Summary reports, which are available on its Web site and in Current Reports on Form 8-K
filed with the Securities and Exchange Commission (SEC). Represents the par value of the company’s unsecured short-term and long-term debt
securities issued to third parties to fund its business activities. The company discloses its
indebtedness on this basis monthly in its Monthly Volume Summary reports, which are available on its
Web site and in Current Reports on Form 8-K filed with the SEC.
Limit under the Purchase Agreement, as amended on August 17, 2012.
1
2
3
4 |
 19
Credit
Supplement |
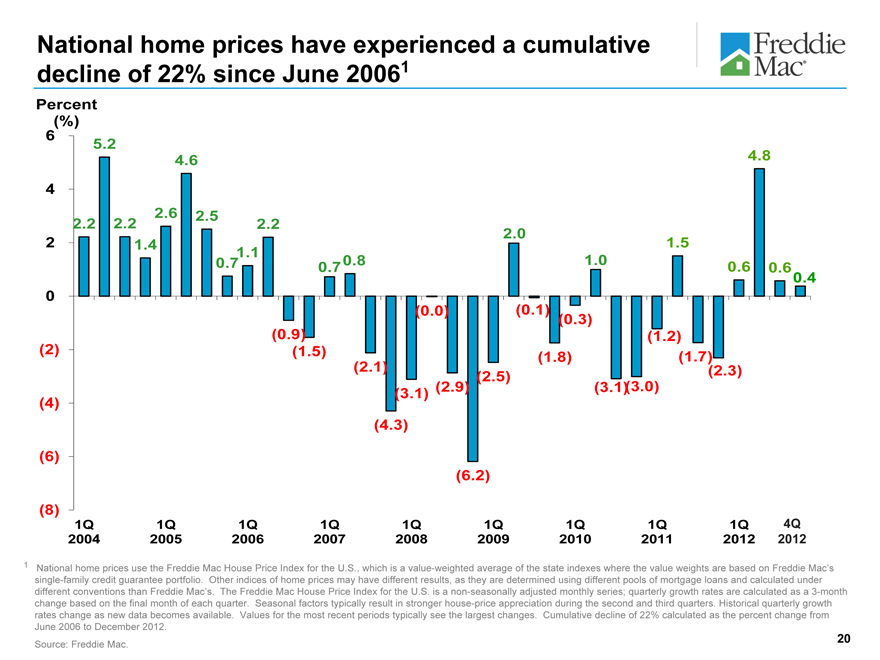
National home prices have experienced a cumulative decline of 22% since June 20061
Percent (%)
6 4 2 0 (2) (4) (6) (8)
5.2
4.6 4.8
2.6 2.5 .2 2.2 2.2
2.0
1.4 1.5
1.1
0.7 0.8 1.0
0.7 0.6 0.6
0.4
(0.0) (0.1)
(0.3)
(0.9) (1.2)
(1.5) (1.8) (1.7)
(2.1) (2.3)
(2.5)
(2.9) (3.1)(3.0)
(3.1)
(4.3)
(6.2)
1Q 1Q 1Q 1Q 1Q 1Q 1Q 1Q 1Q 4Q
2004 2005 2006 2007 2008 2009 2010 2011 2012 2012
1 National home prices use the Freddie Mac House Price Index for the U.S., which is a value-weighted average of the state indexes where the value weights are based on Freddie Mac’s single-family credit guarantee portfolio. Other indices of home prices may have different results, as they are determined using different pools of mortgage loans and calculated under different conventions than Freddie Mac’s. The Freddie Mac House Price Index for the U.S. is a non-seasonally adjusted monthly series; quarterly growth rates are calculated as a 3-month change based on the final month of each quarter. Seasonal factors typically result in stronger house-price appreciation during the second and third quarters. Historical quarterly growth rates change as new data becomes available. Values for the most recent periods typically see the largest changes. Cumulative decline of 22% calculated as the percent change from June 2006 to December 2012.
20
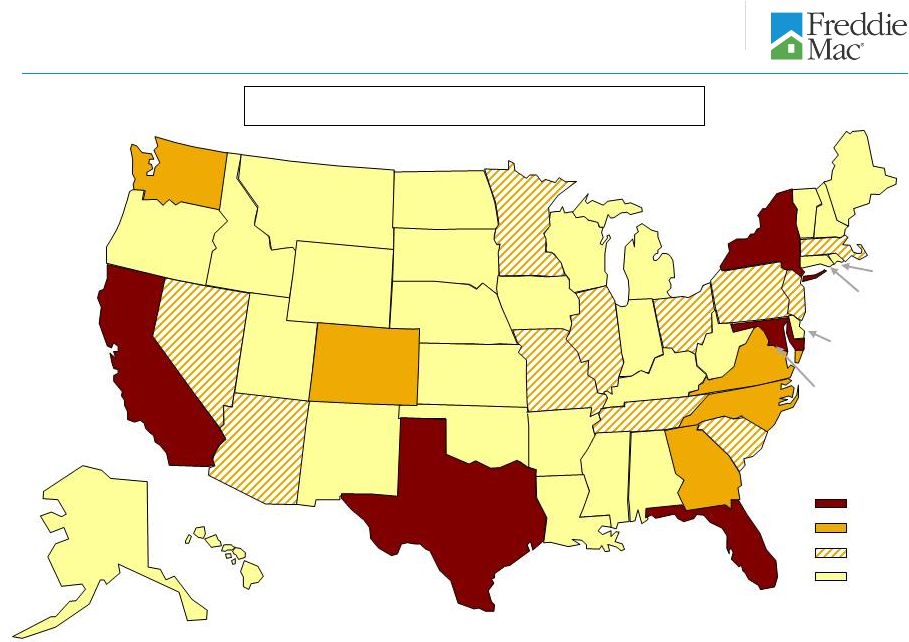
Source: Freddie Mac.
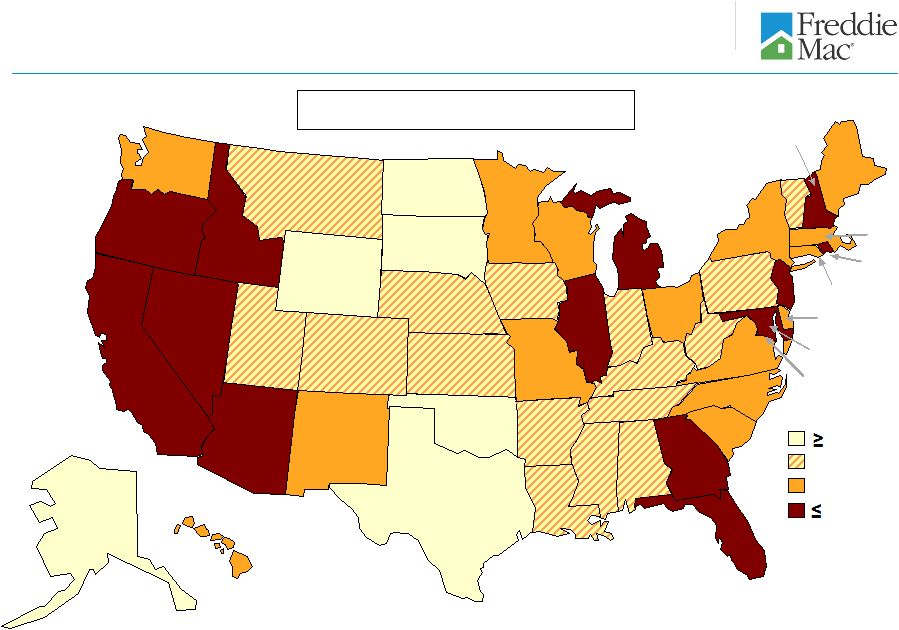 Home
Price Performance By State June
2006
to
December
2012
1
-11%
3%
0%
-12 to -1%
-23%
-22 to -13%
-7%
-37%
-38%
-3%
CT -22%
DC 10%
-18%
-41%
-29%
-17%
-2%
-23%
-29%
-11%
-4%
-4%
-1%
-18%
-27%
-15%
-29%
-22%
-15%
-12%
-4%
-13%
29%
-2%
-26%
-14%
-53%
-14%
-19%
3%
-24%
-11%
RI -30%
-14%
7%
-6%
7%
-10%
-18%
-7%
-22%
-20%
-4%
2%
-23%
WA
OR
CA
NV
ID
MT
WY
UT
AZ
NM
TX
LA
OK
KS
NE
SD
ND
MN
IA
MO
AR
MS
AL
GA
FL
TN
KY
IL
WI
MI
OH
PA
AK
HI
SC
NC
VA
NY
VT
NJ
ME
NH
MA
MD
DE
CO
WV
IN
United States -22%
1
The Freddie Mac House Price Index for the U.S. is a value-weighted average of
the state indexes where the value weights are based on Freddie Mac’s single-family credit
guarantee portfolio. Other indices of home prices may have different results,
as they are determined using different pools of mortgage loans and calculated under different
conventions.
The
Freddie
Mac
House
Price
Index
for
the
U.S.
is
a
non-seasonally
adjusted
monthly
series.
Source: Freddie Mac
21 |
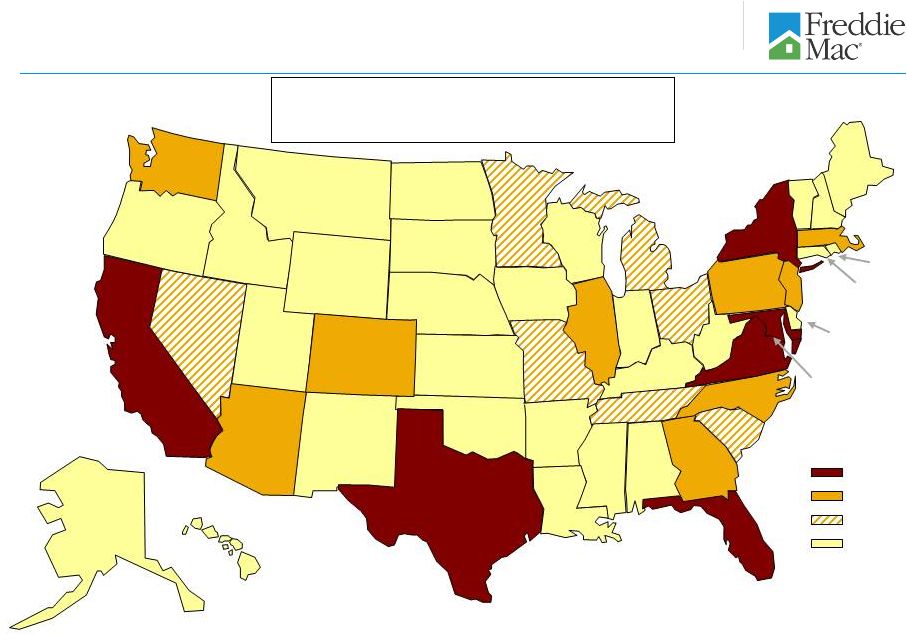
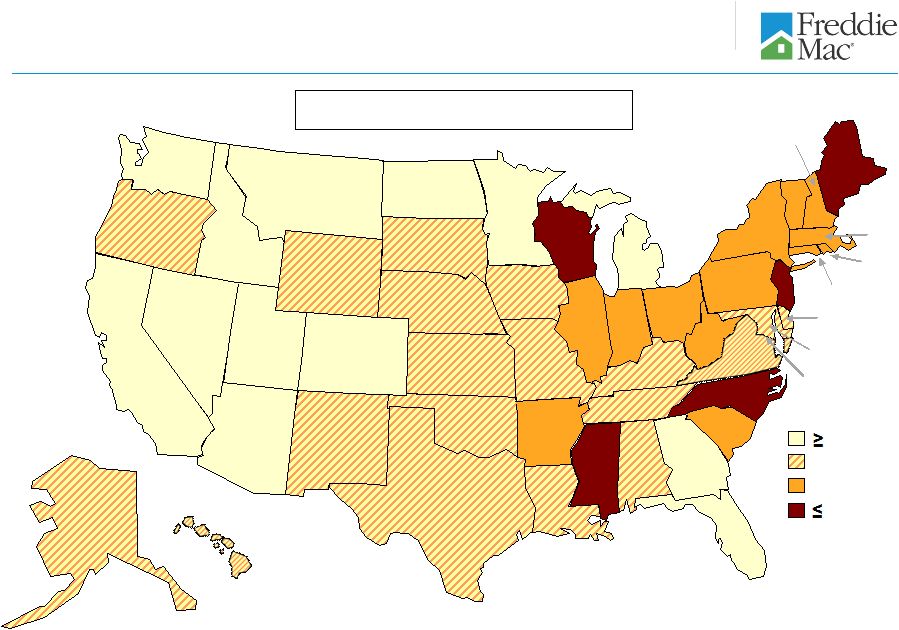 Home
Price Performance By State December
2011
to
December
2012
1
1
The Freddie Mac House Price Index for the U.S. is a value-weighted average of
the state indexes where the value weights are based on Freddie Mac’s single-family credit
guarantee portfolio. Other indices of home prices may have different results, as
they are determined using different pools of mortgage loans and calculated under different
conventions. The Freddie Mac House Price Index for the U.S. is a
non-seasonally adjusted monthly series.
Source: Freddie Mac
22
5%
6%
9%
3 to 8%
-1%
0 to 2%
1%
26%
13%
12%
CT 0%
DC 8%
4%
14%
9%
6%
3%
14%
1%
0%
4%
3%
5%
4%
-1%
16%
11%
6%
-1%
9%
-1%
11%
6%
-2%
3%
21%
0%
2%
3%
8%
1%
RI 1%
1%
6%
7%
6%
11%
6%
9%
-1%
2%
3%
2%
WA
OR
CA
NV
ID
AZ
MT
AK
HI
UT
NM
TX
OK
CO
WY
ND
SD
NE
KS
LA
AR
MO
IA
MN
WI
IL
MS
TN
KY
IN
OH
MI
AL
GA
FL
SC
NC
VA
WV
PA
ME
VT
MA
NH
MD
DE
NJ
United States 6%
0%
NY
2% |
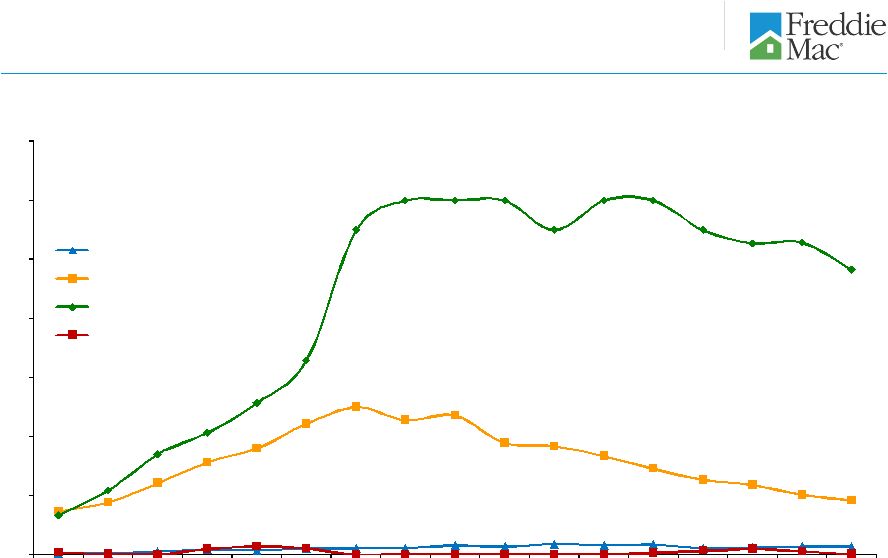
 23
1
Source: National Delinquency Survey from the Mortgage Bankers Association.
Categories represent first lien single-family loans. 2
See
“MD&A
–
RISK
MANAGEMENT
–
Credit
Risk
–
Mortgage
Credit
Risk
–
Single-Family
Mortgage
Credit
Risk
–
Credit
Performance
–
Delinquencies”
in
Freddie
Mac’s
Form
10-K
for the year ended December 31, 2012, for information about the company’s
reported delinquency rates. 1
1
1
Single-family Serious Delinquency Rates
Mortgage market and Freddie Mac serious delinquency
rates
2
0
4
8
12
16
20
24
28
32
Dec-08
Mar-09
Jun-09
Sep-09
Dec-09
Mar-10
Jun-10
Sep-10
Dec-10
Mar-11
Jun-11
Sep-11
Dec-11
Mar-12
Jun-12
Sep-12
Dec-12
Total Mortgage Market
Prime
Subprime
Freddie Mac
21.70%
6.78%
4.34%
3.25% |
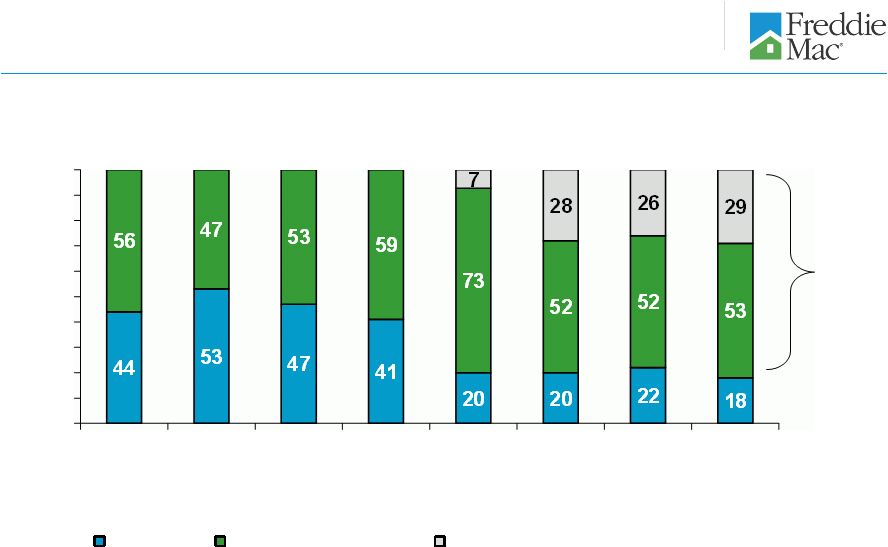 24
Loan purpose of single-family credit guarantee
portfolio purchases
1
The relief refinance mortgage initiative is Freddie Mac’s implementation of
the Home Affordable Refinance Program (HARP). Under the program, the company allows eligible
borrowers who have mortgages with high current LTV ratios to refinance their
mortgages without obtaining new mortgage insurance in excess of what was already in place. HARP is
targeted at borrowers with current LTV ratios above 80%; however, Freddie
Mac’s relief refinance initiative also allows borrowers with LTV ratios at or below 80% to participate.
2
Relief refinance mortgages with LTV ratios above 80% represented
approximately 20% of our total single-family credit guarantee portfolio
purchases in 2012, based on unpaid principal
balance. 1, 2
0
10
20
30
40
50
60
70
80
90
100
2005
2006
2007
2008
2009
2010
2011
2012
Percent
(%)
Purchase
Non-Relief Refinance
Relief Refinance (includes HARP)
82% |
 25
Credit quality of single-family credit guarantee portfolio
purchases
2009
2010
2011
2012
Weighted Average Original LTV Ratio
1
Relief refinance (includes HARP)
80%
77%
77%
97%
All other
66%
67%
67%
68%
Total purchases
67%
70%
70%
76%
Weighted Average Credit Score
2
Relief refinance (includes HARP)
738
747
744
740
All other
757
758
759
762
Total purchases
756
755
755
756
2009
2010
2011
2012
Purchase of Relief Refinance Mortgages > 80% LTV (HARP loans)
3
$ Billions
$19.6
$47.9
$39.7
$86.9
% of single-family credit guarantee portfolio purchases
4%
12%
12%
20%
1
Original LTV ratios are calculated as the amount of the mortgage Freddie Mac
guarantees including the credit-enhanced portion, divided by the lesser of the appraised value of
the property at the time of mortgage origination or the mortgage borrower’s
purchase price. Second liens not owned or guaranteed by Freddie Mac are excluded from the LTV
ratio
calculation
because
we
generally
do
not
receive
data
about
them.
The
existence
of
a
second
lien
mortgage
reduces
the
borrower’s
equity
in
the
home
and, therefore, can
increase the risk of default.
2
Credit score data are based on FICO scores at the time of origination and may not
be indicative of the borrowers’ creditworthiness at December 31,
2012. FICO scores can range between approximately 300 to 850
points. 3
HARP
is
the
portion
of
the
company’s
relief
refinance
initiative
targeted
at
borrowers
with
current
LTV
ratios
above
80%.
HARP
was
expanded
in
October
2011
to
allow
eligible
borrowers
who
have
mortgages
with
current
LTV
ratios
above
125%
to
refinance
under
the
program. |
 26
Single-family 4Q 2012 credit losses and REO
by region and state
1
Based on the unpaid principal balance (UPB) of the single-family credit
guarantee portfolio at December 31, 2012. 2
UPB amounts exclude Other Guarantee Transactions with ending balances of $553 million since these securities are backed by non-Freddie Mac issued securities for which loan
characteristic data was not available.
3
Based on the number of loans that are three monthly payments or more past due or in
the process of foreclosure. 4
Based
on
the
UPB
of
loans
at
the
time
of
REO
acquisition.
5
Consist of the aggregate amount of charge-offs, net of recoveries, and REO
operations expense for 4Q 2012. 6
Region designation: West (AK, AZ, CA, GU, HI, ID, MT, NV, OR, UT, WA); Northeast
(CT, DE, DC, MA, ME, MD, NH, NJ, NY, PA, RI, VT, VA, WV); Southeast (AL, FL, GA, KY, MS,
NC, PR, SC, TN, VI); North Central (IL, IN, IA, MI, MN, ND, OH, SD, WI); and
Southwest (AR, CO, KS, LA, MO, NE, NM, OK, TX, WY). ($ Billions)
% of Total
UPB
2
($ Millions)
% of Total
Serious
Delinquency
Rate
3
(%)
4Q 2012
Acquisitions
($ Millions)
REO
Inventory
($ Millions)
% of Total
Inventory
($ Millions)
% of Total
Region
6
1
West
$456
28%
$14,961
24%
2.79%
$667
$1,402
19%
$958
40%
2
Northeast
420
25
18,926
30
3.77%
283
944
12
219
9
3
North Central
293
18
8,402
14
2.52%
766
2,839
37
521
22
4
Southeast
277
17
16,703
27
4.97%
786
1,693
22
610
25
5
Southwest
192
12
3,270
5
1.69%
293
755
10
88
4
6
Total
$1,638
100%
$62,262
100%
3.25%
$2,795
$7,633
100%
$2,396
100%
State
7
California
$264
16%
$7,325
12%
2.34%
$340
$725
10%
$572
24%
8
Florida
95
6
11,968
19
9.87%
385
785
10
433
18
9
Illinois
83
5
4,095
7
4.08%
254
1,005
13
237
10
10
Ohio
46
3
1,244
2
2.73%
118
335
4
76
3
11
Michigan
47
3
916
1
1.88%
150
683
9
97
4
12
Arizona
40
2
1,170
2
2.45%
129
216
3
154
7
13
Nevada
17
1
1,782
3
8.14%
29
57
1
126
5
14
All other
1,046
64
33,762
54
2.77%
1,390
3,827
50
701
29
15
Total
$1,638
100%
$62,262
100%
3.25%
$2,795
$7,633
100%
$2,396
100%
Total Portfolio UPB
1
Credit Losses
5
REO Acquisitions & Balance
4
Seriously Delinquent Loans |
 27
Single-family
credit
guarantee
portfolio
characteristics
1
1
Portfolio characteristics are based on the unpaid principal balance (UPB) of the
single-family credit guarantee portfolio. Approximately $1 billion in UPB for Other Guarantee Transactions is
included
in
total
UPB
and
percentage
seriously
delinquent
but
not
included
in
the
calculation
of
other
statistics
since
these
securities
are
backed
by
non-Freddie
Mac
issued
securities
for which
loan characteristic data was not available.
2
For
a
description
of
Alt-A,
see
the
“Glossary”
in
the
company’s
Annual
Report
on
Form
10-K
for
the
year
ended
December
31,
2012.
3
Beginning September 1, 2010, the company fully discontinued purchases of
interest-only loans. 4
Represents
the
FICO
score
of
the
borrower
at
loan
origination.
The
company
estimates
that
less
than
1%
of
loans
within
the
portfolio
are
missing
origination
FICO
scores
and
as
such
are
excluded.
5
Indicates year of loan origination. Calculated based on the loans remaining in the
portfolio as of December 31, 2012, rather than all loans originally guaranteed by the company and originated
in the respective year. Each Book Year category represents the percentage of
loans referenced in line 1 of the same vertical column. 6
Based on the number of loans that are three monthly payments or more past due or in
the process of foreclosure. Note: Individual categories are not mutually
exclusive, and therefore are not additive across columns. Option
FICO
FICO
Original
LTV
FICO < 620 &
Original
Attribute
Alt-A²
Interest-only
3
ARM
< 620
4
620 - 659
4
> 90%
LTV > 90%
4
1
UPB $ Billions
$1,638
$74
$50
$7
$51
$104
$219
$12
2
Percent of Total Portfolio
100%
5%
3%
0%
3%
6%
13%
1%
3
Average UPB per loan
$150,749
$154,561
$233,540
$205,933
$125,942
$132,676
$164,443
$131,181
4
Fixed Rate (% of total portfolio)
93%
64%
23%
0%
94%
93%
98%
97%
5
Owner Occupied
90%
82%
82%
76%
95%
94%
93%
97%
6
Original Loan-to-Value (OLTV)
74%
73%
74%
71%
80%
79%
105%
103%
7
OLTV > 90%
13%
4%
3%
2%
24%
21%
100%
100%
8
Current Loan-to-Value (CLTV)
75%
100%
110%
105%
89%
87%
104%
107%
9
CLTV > 90%
24%
59%
73%
64%
46%
42%
78%
76%
10
CLTV > 100%
15%
47%
60%
52%
33%
30%
47%
56%
11
CLTV > 110%
10%
37%
46%
40%
23%
21%
30%
38%
12
Average FICO Score
4
737
714
718
711
586
642
722
584
13
FICO < 620
4
3%
5%
3%
4%
100%
0%
6%
100%
Book Year
5
14
2012
22%
0%
0%
0%
9%
9%
36%
22%
15
2011
14%
0%
0%
0%
5%
6%
14%
8%
16
2010
15%
0%
1%
0%
5%
6%
14%
7%
17
2009
12%
0%
1%
0%
4%
5%
7%
4%
18
2008
6%
7%
10%
0%
7%
7%
4%
4%
19
2007
7%
30%
37%
2%
22%
18%
9%
22%
20
2006
5%
27%
28%
11%
12%
12%
3%
7%
21
2005
6%
20%
19%
58%
11%
12%
3%
5%
22
2004 and prior
13%
16%
4%
29%
25%
25%
10%
21%
23
% of Loans with Credit Enhancement
13%
13%
10%
16%
25%
22%
52%
65%
24
% Seriously Delinquent
6
3.25%
11.37%
16.27%
16.31%
12.21%
8.99%
4.83%
12.71%
Total Portfolio
as of
December 31, 2012 |
 28
Single-family credit profile by book year and product
feature
1
1
Portfolio characteristics are based on the unpaid principal balance (UPB) of the
single-family credit guarantee portfolio. Approximately $1 billion in UPB for Other Guarantee Transactions
is
included
in
total
UPB
and
percentage
seriously
delinquent
but
not
included
in
the
calculation
of
other
statistics
since
these
securities
are
backed
by
non-Freddie
Mac
issued
securities
for which loan characteristic data was not available.
2
Indicates year of loan origination. Calculated based on the loans remaining in the
portfolio as of December 31, 2012, rather than all loans originally guaranteed by the company and
originated in the respective year.
3
Represents
the
average
of
the
borrowers’
FICO
scores
at
origination.
The
company
estimates
that
less
than
1%
of
loans
within
the
portfolio
are
missing
FICO
scores
and
as
such
are
excluded.
4
Beginning September 1, 2010, the company fully discontinued purchases of
interest-only loans. 5
States presented are those with the highest percentage of credit losses during the
three months ended December 31, 2012. 6
Attribute
2012
2011
2010
2009
2008
2007
2006
2005
2004 and
prior
1
UPB $ Billions
$1,638
$364
$226
$237
$205
$79
$119
$89
$101
$218
2
Original Loan-to-Value (OLTV)
74%
78%
72%
72%
70%
74%
77%
75%
73%
72%
3
OLTV > 90%
13%
22%
14%
12%
8%
10%
16%
9%
7%
10%
4
Current Loan-to-Value (CLTV)
75%
76%
67%
68%
69%
88%
107%
104%
89%
56%
5
CLTV > 100%
15%
13%
4%
4%
4%
28%
55%
50%
32%
6%
6
CLTV > 110%
10%
9%
2%
1%
1%
16%
42%
38%
22%
3%
7
Average FICO Score
3
737
755
753
751
750
719
700
705
712
715
8
FICO < 620
3
3%
1%
1%
1%
1%
5%
9%
7%
6%
6%
9
Adjustable-rate
7%
4%
7%
4%
1%
7%
11%
17%
19%
10%
10
Interest-only
4
3%
0%
0%
0%
0%
7%
16%
16%
10%
1%
11
Investor
5%
5%
5%
4%
3%
8%
7%
6%
5%
5%
12
Condo
8%
6%
6%
6%
7%
11%
12%
12%
11%
8%
Geography
5
13
California
16%
21%
17%
16%
13%
16%
16%
15%
15%
12%
14
Florida
6%
4%
3%
3%
4%
7%
11%
12%
11%
8%
15
Illinois
5%
5%
5%
5%
5%
5%
5%
5%
5%
5%
16
Michigan
3%
3%
2%
2%
2%
2%
2%
3%
3%
5%
17
Ohio
3%
3%
3%
3%
2%
2%
2%
2%
3%
4%
18
Arizona
2%
3%
2%
2%
2%
3%
3%
4%
4%
2%
19
Nevada
1%
1%
1%
1%
1%
2%
2%
2%
2%
1%
20
All other
64%
60%
67%
68%
71%
63%
59%
57%
57%
63%
21
% of Loans with Credit Enhancement
13%
13%
10%
8%
8%
26%
26%
15%
13%
12%
22
% Seriously Delinquent
6
3.25%
0.05%
0.26%
0.53%
0.88%
6.80%
12.37%
11.37%
7.20%
3.20%
Total Portfolio
as of
December 31, 2012
Book Year
2
Based on the number of loans that are three monthly payments or more past due or in the process of
foreclosure. |
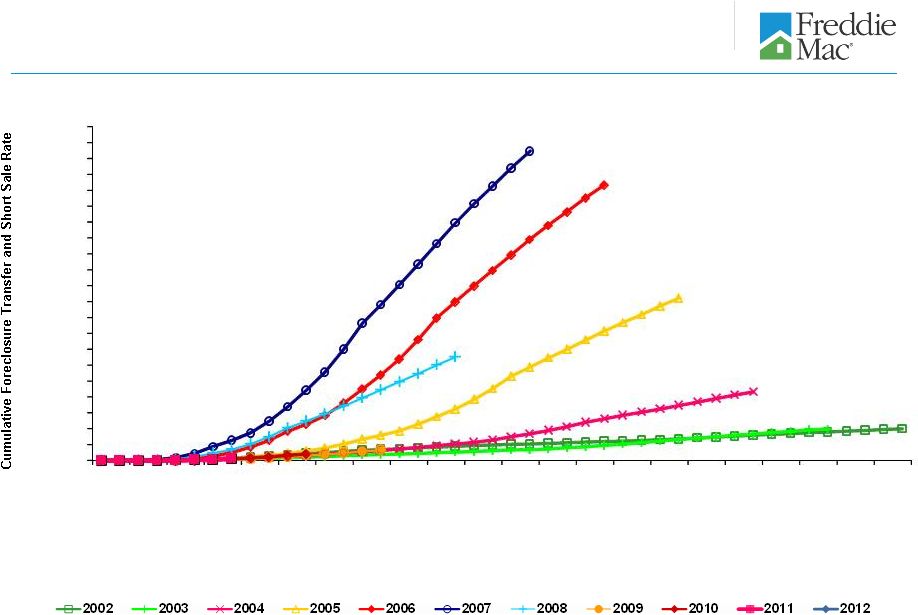 Single-family cumulative foreclosure transfer and
short sale rates
1
by book year
1
Rates are calculated for each year of origination as the number of loans that have
proceeded to foreclosure transfer or short sale and resulted in a credit loss, excluding any
subsequent
recoveries,
divided
by
the
number
of
loans
originated
in
that
year
that
were
acquired
in
the
company’s
single-family
credit
guarantee
portfolio.
Includes
Other
Guarantee
Transactions where loan characteristic data is available.
0.00%
0.50%
1.00%
1.50%
2.00%
2.50%
3.00%
3.50%
4.00%
4.50%
5.50%
6.50%
7.00%
7.50%
8.00%
8.50%
9.00%
9.50%
10.00%
10.50%
5.00%
6.00%
Yr1
Yr1
Yr2
Yr2
Yr3
Yr3
Yr4
Yr4
Yr5
Yr5
Yr6
Yr6
Yr7
Yr7
Yr8
Yr8
Yr9
Yr9
Yr10
Yr10
Yr11
Yr11
Q1
Q3
Q1
Q3
Q1
Q3
Q1
Q3
Q1
Q3
Q1
Q3
Q1
Q3
Q1
Q3
Q1
Q3
Q1
Q3
Q1
Q3
2007
2006
2005
2004
2002
2003
2008
2009
2010
2011
Quarter Post Origination
2012
29 |
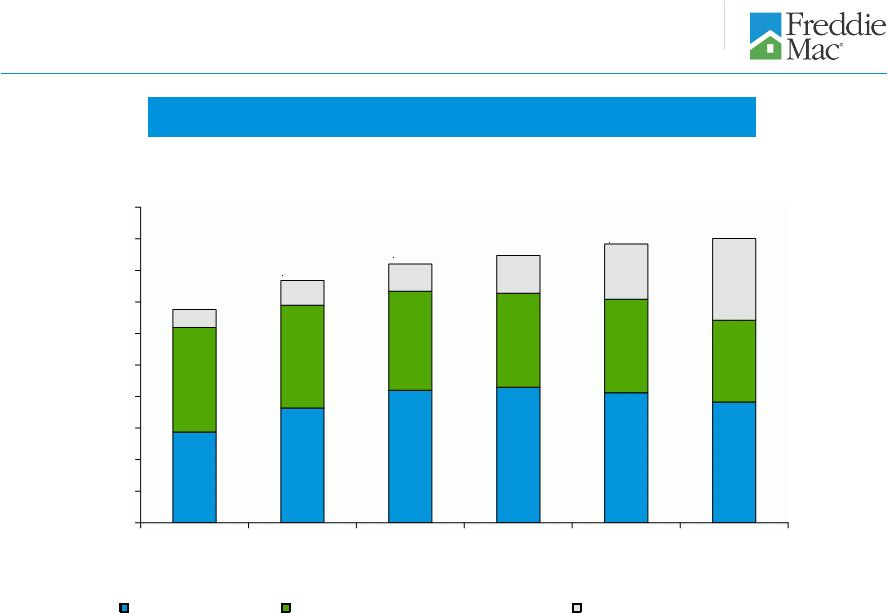 30
Total Multifamily (MF) Portfolio
Multifamily portfolio composition
0
20
40
60
80
100
120
140
160
180
200
12/31/2007
12/31/2008
12/31/2009
12/31/2010
12/31/2011
12/31/2012
MF loan portfolio
MF investment securities portfolio
MF guarantee portfolio
UPB
$ Billions
$135
$154
$164
$169
$177
$180 |
 Multifamily
2012
New
Business
Volume
by
State
1
(%)
31
1
Based on the unpaid principal balance (UPB) of the multifamily loan purchases and
issuance of other guarantee commitments. MF New Business Volume $28.8B
> 5%
> 3% -
5%
< 1%
> 1% -
3%
AK
0.0%
AR
0.2%
AZ
2.1%
CO
4.0%
HI
0.2%
IA
0.2%
ID
0.1%
IL
1.8%
IN
0.4%
KS
0.9%
LA
0.5%
MI
0.8%
MN
1.5%
MO
1.4%
MT
0.0%
ND
0.1%
NE
0.4%
NM
0.4%
NV
1.5%
OK
0.5%
OR
0.7%
SD
0.0%
UT
0.5%
VT
0.0%
WA
3.9%
WI
0.7%
WY
0.0%
AL
0.7%
CT
0.4%
DC
0.3%
DE
0.3%
FL
8.9%
GA
3.8%
KY
0.4%
MD
9.1%
ME
0.0%
MS
0.3%
NC
3.1%
NJ
1.5%
NY
7.4%
OH
1.9%
PA
1.8%
RI
0.1%
SC
1.1%
TN
1.8%
TX
13.9%
VA
4.4%
WV
0.2%
NH
0.0%
MA 2.6%
CA
13.2% |
 Multifamily Mortgage Portfolio UPB Concentration by
State
1
CA
16.5%
32
1 Percentage based on the unpaid principal balance (UPB) of
unsecuritized mortgage loans, other guarantee commitments, and collateral underlying both Freddie Mac guaranteed
mortgage-related securities and related unguaranteed K Certificates.
2 Consists of the UPB of unsecuritized multifamily loans, other
guarantee commitments, and guaranteed Freddie Mac mortgage-related securities. Excludes the UPB associated with
unguaranteed K Certificates.
MF Mortgage Portfolio $127.4B
2
As of December 31, 2012
> 5%
> 2% -
5%
< 1%
> 1% -
2%
AL
0.9%
AK
0.0%
AR
0.3%
AZ
2.2%
CA
16.5%
CO
3.0%
CT
0.9%
DC
0.9%
DE
0.2%
FL
6.6%
GA
4.7%
HI
0.2%
IA
0.3%
ID
0.1%
IL
2.5%
IN
0.6%
KS
0.9%
KY
0.5%
LA
0.8%
MA 2.1%
MD
5.4%
ME
<0.1%
MI
1.0%
MN
1.3%
MO
1.2%
MS
0.4%
MT
<0.1%
NC
2.8%
ND
0.1%
NE
0.5%
NJ
2.5%
NM
0.3%
NV
1.3%
NY
8.4%
OH
1.9%
OK
0.5%
OR
0.7%
PA
2.4%
RI
0.2%
SC
1.0%
SD
0.1%
TN
1.5%
TX
12.5%
UT
0.5%
VA
5.2%
VT
0.0%
WA
3.3%
WI
0.6%
WV
0.1%
WY
<0.1%
NH
0.1% |
 33
Multifamily
mortgage
portfolio
by
attribute
1
1
Based
on
the
unpaid
principal
balance
(UPB)
of
the
multifamily
mortgage
portfolio.
2
Based
on
the
UPB
of
mortgages
two
monthly
payments
or
more
past
due
or
in
the
process
of
foreclosure.
3
Based on either: (a) the year of acquisition, for loans recorded on the
company’s consolidated balance sheets; or (b) the year that the company issued its guarantee, for the
4
Presents
the
six
states
with
the
highest
UPB
at
December
31,
2012.
Year of Acquisition or Guarantee
3
1
2004 and prior
$12.4
0.40%
$10.4
0.26%
$9.2
0.35%
2
2005
7.2
0.20
6.7
0.56
6.5
0.17
3
2006
10.8
0.25
10.1
0.27
9.5
-
4
2007
19.8
0.74
19.3
0.96
17.8
0.86
5
2008
20.6
0.09
18.0
0.34
16.6
0.30
6
2009
13.8
-
12.8
-
12.2
-
7
2010
12.7
-
12.2
-
12.0
-
8
2011
18.8
-
17.4
-
17.0
-
9
2012
N/A
N/A
18.3
-
26.6
-
Total
$116.1
0.22%
$125.2
0.27%
$127.4
0.19%
Maturity Dates
10
2012
$3.0
1.35%
$1.6
1.57%
N/A
N/A
11
2013
5.6
-
3.5
-
$3.3
0.90%
12
2014
7.6
0.03
6.9
0.69
5.8
-
13
2015
11.0
0.17
10.3
0.19
9.8
0.53
14
2016
13.5
0.06
13.6
0.01
13.0
0.05
15
Beyond 2016
75.4
0.25
89.3
0.28
95.5
0.17
Total
$116.1
0.22%
$125.2
0.27%
$127.4
0.19%
Geography
4
16
California
$20.2
0.02%
$21.3
0.24%
$21.1
0.12%
17
Texas
14.0
0.46
15.5
0.46
15.9
0.13
18
New York
9.6
-
10.2
0.09
10.7
0.09
19
Florida
7.1
0.05
8.2
0.04
8.4
0.12
20
Maryland
5.7
-
6.5
-
6.9
-
21
Virginia
6.3
-
6.5
-
6.6
-
22
All other states
53.2
0.35
57.0
0.36
57.8
0.32
Total
$116.1
0.22%
$125.2
0.27%
$127.4
0.19%
UPB
($ Billions)
December 31, 2012
UPB
($ Billions)
Delinquency
Rate
2
(%)
September 30, 2012
Delinquency
Rate
2
(%)
December 31, 2011
Delinquency
Rate
2
(%)
UPB
($ Billions)
remaining loans in its multifamily mortgage portfolio.
|
 34
Multifamily
mortgage
portfolio
by
attribute,
continued
1
1
Based on the
unpaid principal balance (UPB) of the multifamily mortgage portfolio.
2
Based on the UPB of mortgages two monthly payments or more past due or in the
process of foreclosure. 3
Current Loan Size
1
> $25M
$42.8
0.06%
$46.3
0.12%
$48.5
0.06%
2
> $5M & <= $25M
64.0
0.31
69.6
0.36
70.0
0.26
3
> $3M & <= $5M
5.7
0.35
5.9
0.35
5.7
0.22
4
> $750K & <= $3M
3.3
0.26
3.2
0.40
3.0
0.65
5
<= $750K
0.3
0.13
0.2
0.62
0.2
0.37
6
Total
$116.1
0.22%
$125.2
0.27%
$127.4
0.19%
Legal Structure
7
Unsecuritized Loans
$82.3
0.10%
$80.3
0.16%
$76.6
0.08%
8
Freddie Mac mortgage-related securities
24.2
0.64
35.4
0.49
41.4
0.41
9
Other guarantee commitments
9.6
0.18
9.5
0.40
9.4
0.13
10
Total
$116.1
0.22%
$125.2
0.27%
$127.4
0.19%
Credit Enhancement
11
Credit Enhanced
$31.6
0.52%
$42.7
0.45%
$47.8
0.36%
12
Non-Credit Enhanced
84.5
0.11
82.5
0.18
79.6
0.10
13
Total
$116.1
0.22%
$125.2
0.27%
$127.4
0.19%
Other
14
Original LTV > 80%
$6.4
2.34%
$6.2
2.75%
$5.8
2.31%
15
Original DSCR below 1.10
$2.8
2.58%
$2.7
3.18%
$2.3
2.97%
December 31, 2012
UPB
($ Billions)
Delinquency
Rate
2
(%)
September 30, 2012
Delinquency
Rate
2
(%)
December 31, 2011
Delinquency
Rate
2
(%)
UPB
($ Billions)
UPB
($ Billions)
DSCR –
Debt Service Coverage Ratio –
is an indicator of future credit performance for multifamily loans. DSCR estimates
a multifamily borrower’s ability to service its mortgage obligation
using the secured property’s cash flow, after deducting non-mortgage expenses from income. The higher the DSCR, the more likely a multifamily borrower will be able to
continue servicing its mortgage obligation.
3 |
 0.00
2.00
4.00
6.00
8.00
10.00
12.00
14.00
3Q 2008
1Q 2009
3Q 2009
1Q 2010
3Q 2010
1Q 2011
3Q 2011
1Q 2012
3Q 2012
Freddie Mac (60+ day)
FDIC Insured Institutions (90+ day)
MF CMBS Market (60+ day)
ACLI Investment Bulletin (60+ day)
0.02%
Multifamily market and Freddie Mac delinquency rates
Percent
35
9.65%
1.84%
0.27%
1
See “MD&A – RISK MANAGEMENT – Credit Risk – Mortgage Credit Risk
– Multifamily Mortgage Credit Risk ” in Freddie Mac’s Form 10-K for the year ended December 31,
2012, for information about the company’s reported multifamily delinquency rate. The
multifamily delinquency rate at December 31, 2012 was 0.19%.
Source: Freddie Mac, FDIC Quarterly Banking Profile, TREPP (CMBS multifamily 60+
delinquency rate, excluding REOs), American Council of Life Insurers (ACLI).
Non-Freddie Mac data is not yet available for the fourth quarter of 2012.
1 |
 36
Safe Harbor Statements
Freddie Mac obligations
Freddie Mac’s securities are obligations of Freddie Mac only. The securities,
including any interest or return of discount on the securities, are not
guaranteed by and are not debts or obligations of the United States or any federal agency or instrumentality other than Freddie
Mac.
No offer or solicitation of securities
This
presentation
includes
information
related
to,
or
referenced
in
the
offering
documentation
for,
certain
Freddie
Mac
securities,
including offering circulars and related supplements and agreements. Freddie Mac
securities may not be eligible for offer or sale in certain
jurisdictions
or
to
certain
persons.
This
information
is
provided
for
your
general
information
only,
is
current
only
as
of
its
specified
date and does not constitute an offer to sell or a solicitation of an offer to buy
securities. The information does not constitute a sufficient basis
for
making
a
decision
with
respect
to
the
purchase
or
sale
of
any
security.
All
information
regarding
or
relating
to
Freddie
Mac
securities
is
qualified
in
its
entirety
by
the
relevant
offering
circular
and
any
related
supplements.
Investors
should
review
the
relevant
offering circular and any related supplements before making a decision with respect
to the purchase or sale of any security. In addition, before purchasing any
security, please consult your legal and financial advisors for information about and analysis of the security, its
risks and its suitability as an investment in your particular circumstances.
Forward-looking statements
Freddie Mac's presentations may contain forward-looking statements, which may
include statements pertaining to the conservatorship, the company’s
current expectations and objectives for its efforts under the MHA Program, the servicing alignment initiative and other
programs to assist the U.S. residential mortgage market, future business plans,
liquidity, capital management, economic and market conditions and trends,
market share, the effect of legislative and regulatory developments, implementation of new accounting guidance,
credit
losses,
internal
control
remediation
efforts,
and
results
of
operations
and
financial
condition
on
a
GAAP,
Segment
Earnings
and
fair value basis. Forward-looking statements involve known and unknown
risks and uncertainties, some of which are beyond the company’s
control. Management’s expectations for the company’s future necessarily involve a number of assumptions, judgments and
estimates, and various factors, including changes in market conditions, liquidity,
mortgage-to-debt option-adjusted spread, credit outlook, actions
by FHFA, Treasury, the Federal Reserve, the SEC, HUD, other federal agencies, the Administration and Congress, and the
impacts of legislation or regulations and new or amended accounting guidance, could
cause actual results to differ materially from these expectations.
These assumptions, judgments, estimates and factors are discussed in the company’s Annual Report on Form 10-K for
the year ended December 31, 2012, which is available on the Investor Relations page
of the company’s Web site at www.FreddieMac.com/investors
and
the
SEC’s
Web
site
at
www.sec.gov.
The
company
undertakes
no
obligation
to
update
forward-
looking statements it makes to reflect events or circumstances after the date of
this presentation. |