Attached files
| file | filename |
|---|---|
| 8-K - 8-K - FEDERAL HOME LOAN MORTGAGE CORP | d476285d8k.htm |
| EX-99.2 - EXHIBIT 99.2 - FEDERAL HOME LOAN MORTGAGE CORP | d476285dex992.htm |
| EX-99.3 - EXHIBIT 99.3 - FEDERAL HOME LOAN MORTGAGE CORP | d476285dex993.htm |
Exhibit 99.1

|
News Release |
FOR IMMEDIATE RELEASE
February 28, 2013
MEDIA CONTACT: Lisa Gagnon
703-903-3385
INVESTOR CONTACT: Robin Phillips
571-382-4732
FREDDIE MAC REPORTS NET INCOME OF $11.0 BILLION, COMPREHENSIVE
INCOME OF $16.0 BILLION FOR FULL-YEAR 2012
Company Pays Dividends of More Than $7 Billion to Taxpayers in 2012
Supports the Housing Market – Helping 9.7 Million Families Buy, Rent or Keep Their Homes Since 2009
Full-Year and Fourth Quarter 2012 Financial Results
| • | Full-year 2012 net income and comprehensive income totaled $11.0 billion and $16.0 billion, respectively |
| • | Fourth quarter 2012 net income and comprehensive income totaled $4.5 billion and $5.7 billion, respectively |
| • | No additional Treasury draw required for the fourth quarter of 2012; based on net worth of $8.8 billion at December 31, 2012, the company’s dividend obligation to Treasury will be $5.8 billion in March 2013 |
| • | Paid $7.2 billion to taxpayers through dividends in 2012, bringing the cumulative total paid since conservatorship to $23.8 billion – or 33 percent of the company’s cumulative draws |
Housing Market Support Since January 1, 2009
| • | Provided $1.8 trillion to the mortgage market by funding: |
| • | 6.1 million refinancings (includes 1.8 million under Freddie Mac’s relief refinancing initiative) |
| • | 1.5 million home purchases |
| • | 1.2 million units of multifamily rental housing |
| • | Helped stabilize communities nationwide by enabling more than 785,000 borrowers to avoid foreclosure |
Credit Quality at December 31, 2012
| • | Post-2008 book of business grew to 63 percent of single-family credit guarantee portfolio in 2012 – of which 11 percent of that portfolio were HARP loans |
| • | Delinquency rates remained below industry benchmarks |
| • | Single-family serious delinquency rate was 3.25 percent |
| • | Multifamily delinquency rate was 0.19 percent |
Freddie Mac Fourth Quarter 2012 Financial Results
February 28, 2013
Page 2
McLean, VA — Freddie Mac (OTCQB: FMCC) today reported net income of $4.5 billion for the fourth quarter of 2012, compared to net income of $2.9 billion for the third quarter of 2012. The company also reported comprehensive income of $5.7 billion for the fourth quarter of 2012, compared to comprehensive income of $5.6 billion for the third quarter of 2012. For the full-year 2012, Freddie Mac’s net income was $11.0 billion and comprehensive income was $16.0 billion, compared to a net loss of $5.3 billion and a comprehensive loss of $1.2 billion for the full-year 2011.
“In 2012, Freddie Mac significantly improved its financial performance and returned more than $7 billion to America’s taxpayers through dividends,” said Freddie Mac CEO Donald H. Layton. “It’s clear from our earnings that the housing market has turned a corner and that our work to minimize legacy losses and build a strong new book of business is paying off. “We played a leading role in helping America’s homeowners last year, working with our lender customers to streamline programs to assist more distressed borrowers while expanding access to affordable mortgage funding through programs like HARP,” Layton added. “In 2012, we helped 2.5 million families to buy, refinance or rent a home and another 170,000 to avoid foreclosure – bringing the total to nearly 10 million since the start of the housing crisis. We continue to work with our regulator, our customers and the industry to support the housing market and build a stronger mortgage finance system for the nation.”
Summary Financial Results (1)
| Three Months Ended | Full-Year | |||||||||||||||||
| September 30, | December 31, | |||||||||||||||||
| ($ Billions) | 2012 | 2012 | 2011 | 2012 | ||||||||||||||
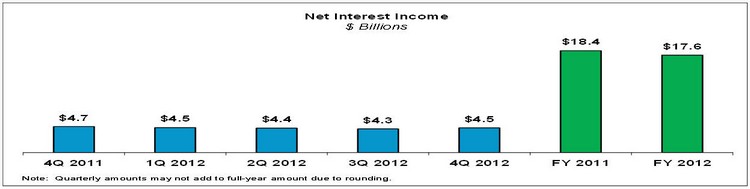
| 1 | Net interest income | $ | 4.3 | $ | 4.5 | $ | 18.4 | $ | 17.6 | |||||||||
| 2 | (Provision) benefit for credit losses | (0.6 | ) | 0.7 | (10.7 | ) | (1.9 | ) | ||||||||||
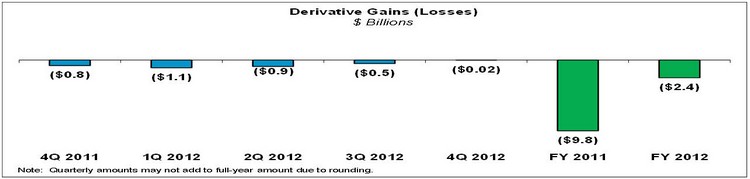
| 3 | Derivative losses | (0.5 | ) | (0.0 | ) | (9.8 | ) | (2.4 | ) | |||||||||
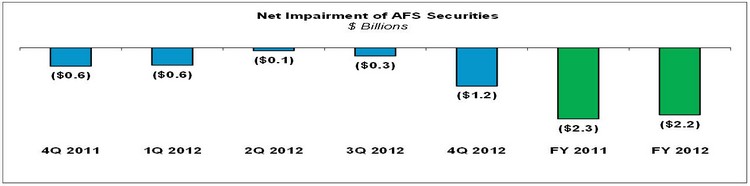
| 4 | Net impairment | (0.3 | ) | (1.2 | ) | (2.3 | ) | (2.2 | ) | |||||||||
| 5 | Other non-interest income (loss) | 0.2 | 0.0 | 1.2 | 0.5 | |||||||||||||
| 6 | Non-interest expense | (0.5 | ) | (0.6 | ) | (2.5 | ) | (2.2 | ) | |||||||||
| 7 | Income tax benefit | 0.3 | 1.1 | 0.4 | 1.5 | |||||||||||||
|
|
|
|
|
|
|
|
|
|||||||||||
| 8 | Net income (loss) | $ | 2.9 | $ | 4.5 | $ | (5.3 | ) | $ | 11.0 | ||||||||
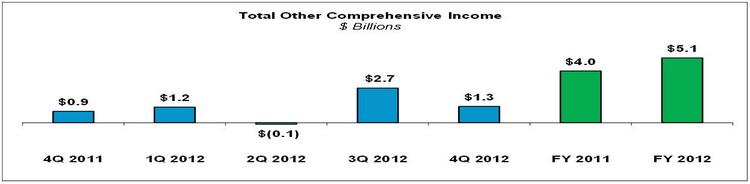
| 9 | Total other comprehensive income (loss) | 2.7 | 1.3 | 4.0 | 5.1 | |||||||||||||
|
|
|
|
|
|
|
|
|
|||||||||||
| 10 | Comprehensive income (loss) | $ | 5.6 | $ | 5.7 | $ | (1.2 | ) | $ | 16.0 | ||||||||
|
|
|
|
|
|
|
|
|
|||||||||||
| (1) | Columns may not add due to rounding. See “Appendix—Financial Results Discussion” section for additional information about the company’s fourth quarter and full-year 2012 financial results. |
Net income for the fourth quarter of 2012 was $4.5 billion, compared to $2.9 billion for the third quarter of 2012. The increase primarily reflects a shift from a provision for credit losses in the third quarter to a benefit for credit losses in the fourth quarter due to a decrease in the volume of newly delinquent single-family loans and continued improvement in national home prices, as well as a higher income tax benefit primarily driven by the favorable resolution of tax matters with the Internal Revenue Service (IRS). These favorable impacts were partially offset by higher net security impairments.
Comprehensive income for the fourth quarter of 2012 was $5.7 billion, compared to $5.6 billion for the third quarter of 2012. The slight increase is driven by higher quarterly net income, partially offset by lower fair
Freddie Mac Fourth Quarter 2012 Financial Results
February 28, 2013
Page 3
value gains on the company’s non-agency available-for-sale (AFS) securities. The fair value of Freddie Mac’s AFS securities may fluctuate considerably from quarter to quarter due to market conditions, which can lead to variability in the company’s comprehensive income results.
Net income for the full-year 2012 was $11.0 billion, compared to a net loss of $5.3 billion for the full-year 2011. The improvement primarily reflects lower provision for credit losses, lower derivative losses and higher income tax benefit. Comprehensive income for the full-year 2012 was $16.0 billion, compared to a comprehensive loss of $1.2 billion for the full-year 2011. The improvement is mostly driven by higher net income.
Treasury Draws and Dividend Payments
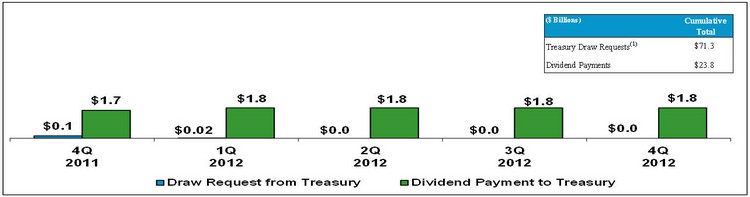
| (1) | Excludes the initial liquidation preference of Freddie Mac’s senior preferred stock of $1.0 billion. |
Freddie Mac does not require a draw from Treasury for the fourth quarter of 2012 because the company had positive net worth at December 31, 2012. The company’s $8.8 billion net worth at December 31, 2012 reflects $4.9 billion in net worth at September 30, 2012 and fourth quarter comprehensive income of $5.7 billion, partially offset by the $1.8 billion quarterly dividend payment to Treasury on the company’s senior preferred stock.
Through December 31, 2012, Freddie Mac has paid $23.8 billion in cash dividends to Treasury on the company’s senior preferred stock. This represents 33 percent of the company’s cumulative draws received under the Purchase Agreement with Treasury. In addition, in September 2012, Freddie Mac began remitting proceeds to Treasury from the 10 basis point guarantee fee increase required by the Temporary Payroll Tax Cut Continuation Act of 2011. The guarantee fees related to this increase totaled $108 million for 2012.
Beginning in 2013, the August 2012 amendment to the Purchase Agreement replaced the fixed 10 percent dividend rate with a net worth sweep dividend and suspended the periodic commitment fees. Under this amendment, Freddie Mac is required to pay dividends to the extent that its Net Worth Amount, as defined in the Purchase Agreement, exceeds the permitted capital reserve. The amount of the permitted capital reserve is $3 billion in 2013 and will be reduced by $600 million each year thereafter until it reaches zero in 2018. The amendment effectively ends the circular practice of taking draws from Treasury to pay dividends to Treasury. Based on Freddie Mac’s Net Worth Amount at December 31, 2012, the company’s net worth sweep dividend obligation to Treasury in March 2013 will be $5.8 billion.
Beginning January 1, 2013, the amount of remaining funding available to Freddie Mac under the Purchase Agreement with Treasury is $140.5 billion. This reflects the remaining funding available as of December 31, 2009 of $149.3 billion less the company’s net worth of $8.8 billion at December 31, 2012.
Freddie Mac Fourth Quarter 2012 Financial Results
February 28, 2013
Page 4
Housing Market Support
Freddie Mac continues to support the U.S. housing market by ensuring credit availability for new and refinanced mortgages as well as rental housing. The company also continues helping struggling homeowners avoid foreclosure and stabilizing communities nationwide. Since the beginning of 2009, Freddie Mac has helped more than 8.9 million American families own or rent a home, and another 785,000 avoid foreclosure.
Number of Families Helped
| (Thousands) | 2009 | 2010 | 2011 | 2012 | Cumulative Total |
|||||||||||||||||
| 1 | Number of families helped to own or rent a home | 2,480 | 2,089 | 1,830 | 2,472 | 8,871 | ||||||||||||||||
| 2 | Relief refinance borrowers (includes HARP)(1) | 169 | 533 | 453 | 687 | 1,842 | ||||||||||||||||
| 3 | Non-relief refinance borrowers(1) | 1,595 | 947 | 740 | 996 | 4,278 | ||||||||||||||||
| 4 | Purchase borrowers(1) | 460 | 378 | 326 | 353 | 1,517 | ||||||||||||||||
| 5 | Multifamily rental units | 256 | 231 | 311 | 436 | 1,234 | ||||||||||||||||
| 6 | Number of single families helped to avoid foreclosure(2) | 133 | 275 | 208 | 169 | 785 | ||||||||||||||||
| 7 | Loan modifications | 65 | 170 | 109 | 70 | 414 | ||||||||||||||||
| 8 | Repayment plans | 34 | 31 | 33 | 33 | 131 | ||||||||||||||||
| 9 | Forbearance agreements | 15 | 35 | 20 | 13 | 83 | ||||||||||||||||
| 10 | Short sales & deed-in-lieu of foreclosure transactions | 19 | 39 | 46 | 53 | 157 | ||||||||||||||||
| 11 | Total (line 1 + line 6) | 2,613 | 2,364 | 2,038 | 2,641 | 9,656 | ||||||||||||||||
| (1) | For the periods presented, a borrower may be counted more than once if the company purchased more than one loan (purchase or refinance mortgage) relating to the same borrower. |
| (2) | These categories are not mutually exclusive and a borrower in one category may also be included within another category in the same period. For the periods presented, a borrower may subsequently go into foreclosure. |
Providing Liquidity – Freddie Mac continues to provide access to affordable financing for new and refinanced mortgages and rental housing. Since 2009, the company has provided nearly $1.8 trillion in liquidity to the market through its purchases of loans and issuances of mortgage-related securities, which includes $474 billion during 2012.
Freddie Mac Fourth Quarter 2012 Financial Results
February 28, 2013
Page 5
Market Liquidity Provided (1)
| ($ Billions) | 2009 | 2010 | 2011 | 2012 | Cumulative Total |
|||||||||||||||||
| 1 | Single-family purchases and issuances(1) | $ | 483 | $ | 390 | $ | 321 | $ | 427 | $ | 1,621 | |||||||||||
| 2 | Relief refinance mortgages (includes HARP) | 35 | 106 | 82 | 123 | 345 | ||||||||||||||||
| 3 | Non-relief refinance mortgages | 345 | 200 | 168 | 228 | 941 | ||||||||||||||||
| 4 | Purchase mortgages | 94 | 78 | 71 | 76 | 320 | ||||||||||||||||
| 5 | Other(2) | 9 | 6 | — | — | 14 | ||||||||||||||||
| 6 | Multifamily purchases and issuances(1)(3) | $ | 19 | $ | 22 | $ | 32 | $ | 47 | $ | 119 | |||||||||||
| 7 | Loan purchases and guarantees | 17 | 15 | 20 | 29 | 81 | ||||||||||||||||
| 8 | K-deals (guaranteed portion) | 2 | 6 | 12 | 18 | 38 | ||||||||||||||||
| 9 | Other(4) | $ | 46 | $ | — | $ | 8 | $ | — | $ | 55 | |||||||||||
| 10 | Total (lines 1+6+9) | $ | 548 | $ | 412 | $ | 361 | $ | 474 | $ | 1,795 | |||||||||||
| (1) | Based on unpaid principal balance (UPB). Columns and rows may not add due to rounding. |
| (2) | Includes Ginnie Mae Certificates, HFA guarantees, and Other Guarantee Transactions for which loan level data is not available. |
| (3) | Multifamily loans purchased for securitization through issuance of K-deals are included in line 7. Upon subsequent securitization of these loans, the guaranteed portion of the K-deals is included in line 8. |
| (4) | Consists of non-Freddie Mac mortgage-related securities purchased for the company’s retained mortgage investment portfolio. |
Enabling Refinance Activity – Freddie Mac continues to help borrowers lower their payments and/or reduce their mortgage terms by purchasing refinance mortgages. Refinance purchases of $351 billion accounted for 82 percent of the company’s single-family mortgage purchase volume during 2012. The company estimates that the homeowners who refinanced during 2012 will save an average of $3,200 in interest payments during the first 12 months. Since 2009, the company has purchased nearly $1.3 trillion of refinance mortgages, helping 6.1 million homeowners.
Freddie Mac continues to help borrowers refinance through its streamlined relief refinance initiative, which includes the Home Affordable Refinance Program (HARP) for loans with loan-to-value (LTV) ratios above 80 percent. Relief refinance mortgages comprised approximately 35 percent of the company’s total refinance volume during 2012, based on UPB, with HARP representing a larger part of such activity than in 2011. During 2012, Freddie Mac purchased approximately 434,000 HARP loans totaling $86.9 billion, more than double the amount purchased in 2011. This increase reflects enhancements to HARP implemented in 2012 to help more underwater homeowners refinance into more favorable terms. Since 2009, Freddie Mac has funded over 1.8 million relief refinance mortgages, including nearly 915,000 HARP loans.
Preventing Foreclosures – Freddie Mac continues to help struggling borrowers retain their homes or otherwise avoid foreclosure. During 2012, the company completed approximately 169,000 single-family loan workouts, including nearly 70,000 loan modifications. This brings the total number of homeowners the company has helped avoid foreclosure to more than 785,000 since the beginning of 2009. In addition, when foreclosure is unavoidable, Freddie Mac has helped to stabilize communities by selling approximately two-thirds of its real estate owned (REO) homes to owner-occupants since 2009.
Freddie Mac Fourth Quarter 2012 Financial Results
February 28, 2013
Page 6
Credit Quality
Post-2008 Single-Family Books of Business – Since 2008, Freddie Mac has enhanced its credit and underwriting policies, purchased fewer loans with high-risk characteristics and seen positive changes in the underwriting practices of lenders and mortgage insurers. These factors have contributed to the credit quality of loans purchased since 2008 (excluding relief refinance mortgages).
Credit Quality of Single-Family Credit Guarantee Portfolio Purchases
| 2009 | 2010 | 2011 | 2012 | |||||||||||||
| Weighted Average Original LTV Ratio: |
||||||||||||||||
| Relief refinance (includes HARP) |
80 | % | 77 | % | 77 | % | 97 | % | ||||||||
| All other |
66 | % | 67 | % | 67 | % | 68 | % | ||||||||
| Total purchases |
67 | % | 70 | % | 70 | % | 76 | % | ||||||||
| Weighted Average Credit Score: |
||||||||||||||||
| Relief refinance (includes HARP) |
738 | 747 | 744 | 740 | ||||||||||||
| All other |
757 | 758 | 759 | 762 | ||||||||||||
| Total purchases |
756 | 755 | 755 | 756 | ||||||||||||
Total single-family loans (including relief refinance loans) purchased by Freddie Mac in 2012 had a weighted average FICO credit score of 756 and an average original LTV ratio of 76 percent. The higher LTV ratio for 2012 purchases reflects the significant increase in the company’s purchase of HARP loans during 2012, which was driven by FHFA-directed enhancements to HARP that expanded eligibility to refinance borrowers whose mortgages have LTV ratios above 125 percent. HARP loans with LTV ratios above 125 percent represented 23 percent of the HARP loans Freddie Mac purchased during 2012 (measured by both UPB and number of loans). HARP loans generally reflect many of the credit risk attributes of the original loans. However, in many cases, through refinancing the borrower’s payments are reduced, thereby strengthening the borrower’s potential to make their mortgage payments.
At December 31, 2012, loans originated after 2008 accounted for 63 percent of the UPB of Freddie Mac’s single-family credit guarantee portfolio and HARP loans represented 11 percent of that portfolio.
Freddie Mac Fourth Quarter 2012 Financial Results
February 28, 2013
Page 7
Single-Family Credit Guarantee Portfolio – Concentration of Credit Risk
| As of 12/31/2012 | Full-Year 2012 | |||||||||||
| % of Portfolio | Serious Delinquency Rate |
% of Credit Losses | ||||||||||
| Loans originated in 2009 – 2012 |
63 | % | 0.39 | % | 4 | % | ||||||
| HARP |
11 | 1.06 | % | 2 | ||||||||
| Other relief refinance |
7 | 0.29 | % | <1 | ||||||||
| All other loans |
45 | 0.27 | % | 2 | ||||||||
| Loans originated in 2005 – 2008 |
24 | 9.56 | % | 87 | ||||||||
| Loans originated in 2004 and prior |
13 | 3.20 | % | 9 | ||||||||
|
|
|
|
|
|
|
|||||||
| Total |
100 | % | 3.25 | % | 100 | % | ||||||
2005 to 2008 Single-Family Books of Business – Since the beginning of 2008, on an aggregate basis, the company has recorded provision for credit losses of $75.2 billion associated with single-family loans and recorded an additional $3.9 billion in losses on loans purchased from the company’s PC trusts, net of recoveries. The majority of these losses are associated with loans originated in 2005 through 2008. Loans originated in 2005 through 2008 are becoming a smaller portion of the company’s single-family credit guarantee portfolio. At December 31, 2012, loans originated in 2005 through 2008 represented 24 percent of the company’s single-family credit guarantee portfolio, based on UPB, down from 32 percent at December 31, 2011.
Single-family serious delinquency rate was 3.25 percent at December 31, 2012, compared to 3.37 percent at September 30, 2012 and 3.58 percent at December 31, 2011. While the company’s single-family serious delinquency rate remains higher than the rate in years prior to 2009, it is substantially below the rate for the entire U.S. mortgage market. According to the Mortgage Bankers Association’s National Delinquency Survey, the serious delinquency rate on first-lien single-family loans in the U.S. mortgage market was 6.78 percent at December 31, 2012.
Multifamily delinquency rate (based on loans 60 days or more past due or in the process of foreclosure) was 0.19 percent at December 31, 2012, compared to 0.27 percent at September 30, 2012, and 0.22 percent at December 31, 2011. Freddie Mac’s multifamily delinquency rate reflects the continued improvement in the overall multifamily market and remains low compared to other industry participants.
Additional Information
For more information, including that related to Freddie Mac’s financial results, conservatorship and related matters, see the company’s Annual Report on Form 10-K for the year ended December 31, 2012, and the company’s Consolidated Financial Statements, Core Tables and Financial Results Supplement. These documents are available on the Investor Relations page of the company’s Web site at www.FreddieMac.com/investors.
Additional information about Freddie Mac and its business is also set forth in the company’s filings with the SEC, which are available on the Investor Relations page of the company’s Web site at
Freddie Mac Fourth Quarter 2012 Financial Results
February 28, 2013
Page 8
www.FreddieMac.com/investors and the SEC’s Web site at www.sec.gov. Freddie Mac encourages all investors and interested members of the public to review these materials for a more complete understanding of the company’s financial results and related disclosures.
* * * *
This press release contains forward-looking statements, which may include statements pertaining to the conservatorship, the company’s current expectations and objectives for its efforts under the Making Home Affordable program, the servicing alignment initiative and other programs to assist the U.S. residential mortgage market, future business plans, liquidity, capital management, economic and market conditions and trends, market share, the effect of legislative and regulatory developments, implementation of new accounting guidance, credit losses, internal control remediation efforts, and results of operations and financial condition on a GAAP, Segment Earnings and fair value basis. Forward-looking statements involve known and unknown risks and uncertainties, some of which are beyond the company’s control. Management’s expectations for the company’s future necessarily involve a number of assumptions, judgments and estimates, and various factors, including changes in market conditions, liquidity, mortgage-to-debt option-adjusted spread, credit outlook, actions by FHFA, Treasury, the Federal Reserve, the SEC, HUD, other federal agencies, the Administration and Congress, and the impacts of legislation or regulations and new or amended accounting guidance, could cause actual results to differ materially from these expectations. These assumptions, judgments, estimates and factors are discussed in the company’s Annual Report on Form 10-K for the year ended December 31, 2012, which is available on the Investor Relations page of the company’s Web site at www.FreddieMac.com/investors and the SEC’s Web site at www.sec.gov. The company undertakes no obligation to update forward-looking statements it makes to reflect events or circumstances after the date of this press release.
Freddie Mac was established by Congress in 1970 to provide liquidity, stability and affordability to the nation’s residential mortgage markets. Freddie Mac supports communities across the nation by providing mortgage capital to lenders. Today Freddie Mac is making home possible for one in four home borrowers and is one of the largest sources of financing for multifamily housing. For more information, visit www.FreddieMac.com.
# # #
Freddie Mac Fourth Quarter 2012 Financial Results
February 28, 2013
Page 9
Appendix — Financial Results Discussion
Summary Consolidated Statements of Comprehensive Income
| Three Months Ended | Full-Year | |||||||||||||||||
| ($ Millions) | September 30, 2012 |
December 31, 2012 |
2011 | 2012 | ||||||||||||||
| 1 | Net interest income | $ | 4,269 | $ | 4,456 | $ | 18,397 | $ | 17,611 | |||||||||
| 2 | (Provision) benefit for credit losses | (610 | ) | 700 | (10,702 | ) | (1,890 | ) | ||||||||||
| 3 | Derivative losses | (488 | ) | (22 | ) | (9,752 | ) | (2,448 | ) | |||||||||
| 4 | Net impairments of AFS securities recognized in earnings | (267 | ) | (1,239 | ) | (2,301 | ) | (2,168 | ) | |||||||||
| 5 | Other | 195 | 5 | 1,175 | 533 | |||||||||||||
|
|
|
|
|
|
|
|
|
|||||||||||
| 6 | Non-interest income (loss) | (560 | ) | (1,256 | ) | (10,878 | ) | (4,083 | ) | |||||||||
| 7 | Administrative expenses | (401 | ) | (422 | ) | (1,506 | ) | (1,561 | ) | |||||||||
| 8 | REO operations income (expense) | 49 | 33 | (585 | ) | (59 | ) | |||||||||||
| 9 | Other | (121 | ) | (199 | ) | (392 | ) | (573 | ) | |||||||||
|
|
|
|
|
|
|
|
|
|||||||||||
| 10 | Non-interest expense | (473 | ) | (588 | ) | (2,483 | ) | (2,193 | ) | |||||||||
| 11 | Income tax benefit | 302 | 1,145 | 400 | 1,537 | |||||||||||||
|
|
|
|
|
|
|
|
|
|||||||||||
| 12 | Net income (loss) | $ | 2,928 | $ | 4,457 | $ | (5,266 | ) | $ | 10,982 | ||||||||
| 13 | Total other comprehensive income (loss) | 2,702 | 1,271 | 4,036 | 5,057 | |||||||||||||
|
|
|
|
|
|
|
|
|
|||||||||||
| 14 | Comprehensive income (loss) | $ | 5,630 | $ | 5,728 | $ | (1,230 | ) | $ | 16,039 | ||||||||
|
|
|
|
|
|
|
|
|
|||||||||||
Net interest income was $4.5 billion for the fourth quarter of 2012, compared to $4.3 billion for the third quarter of 2012. Net interest yield was 87 basis points for the fourth quarter of 2012, compared to 82 basis points for the third quarter of 2012. The increases in both net interest income and net interest yield mainly reflect higher prepayment fee income on multifamily loans.
Net interest income for the full-year 2012 was $17.6 billion, compared to $18.4 billion for the full-year 2011. The decrease in net interest income is mostly driven by the reduction in the balance of higher-yielding mortgage-related assets. Net interest yield for the full-year 2012 was 84 basis points, compared to 82 basis points for the full-year 2011. The increase in net interest yield is primarily due to the benefits of lower funding costs, partially offset by the negative impact of the reduction in the balance of higher-yielding mortgage-related assets.
(Provision) benefit for credit losses was a benefit of $700 million for the fourth quarter of 2012, compared to provision expense of $610 million for the third quarter of 2012. Provision for credit losses for the full-year 2012 was $1.9 billion, compared to $10.7 billion for the full-year 2011. The improvement in both the
Freddie Mac Fourth Quarter 2012 Financial Results
February 28, 2013
Page 10
fourth quarter and full-year 2012 is driven by a decrease in the volume of newly delinquent single-family loans and the positive impact of increased national home prices.
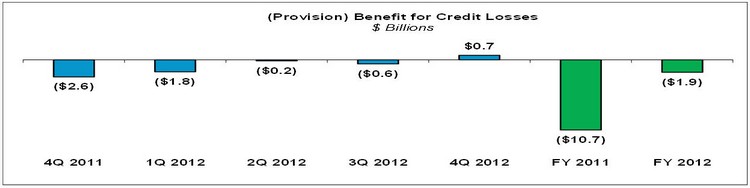
The company’s loan loss reserves were $30.9 billion as of December 31, 2012, compared to $33.8 billion as of September 30, 2012 and $39.5 billion as of December 31, 2011.
Derivative losses were $22 million for the fourth quarter of 2012, compared to $488 million for the third quarter of 2012. The decrease in derivative losses is attributable to higher fair value gains on the net pay-fixed swap portfolio as long-term interest rates increased during the fourth quarter.
Derivative losses for the full-year 2012 were $2.4 billion, compared to $9.8 billion for the full-year 2011. The decrease is primarily due to improvement in the fair value of the company’s net pay-fixed swap portfolio as interest rates declined less in 2012 as compared to 2011.
Net impairment of AFS securities recognized in earnings was $1.2 billion for the fourth quarter of 2012, compared to $267 million for the third quarter of 2012. The increase is mainly attributable to the implementation of a third-party model to project cash flow estimates on Freddie Mac’s single-family non-agency mortgage-related securities, partially offset by improvements in forecasted home prices over the expected life of the company’s AFS securities.
Net impairment of AFS securities recognized in earnings was $2.2 billion for the full-year 2012, compared to $2.3 billion for the full-year 2011. The slight decrease is primarily driven by improvements in forecasted home prices and lower interest rates which benefited structural credit enhancements. These favorable impacts were mostly offset by the implementation, in the fourth quarter, of the third-party model referenced above.
Freddie Mac Fourth Quarter 2012 Financial Results
February 28, 2013
Page 11
REO operations income was $33 million for the fourth quarter of 2012, compared to $49 million for the third quarter of 2012. Maintaining and disposing of REO properties results in REO operations income or expense, which can vary from quarter to quarter primarily due to disposition gains or losses and recoveries from credit enhancements, such as mortgage insurance. The decrease in REO operations income in the fourth quarter of 2012 primarily reflects lower gains on disposition of REO properties due to a decline in disposition volume.
REO operations expense for the full-year 2012 was $59 million, compared to $585 million for the full-year 2011. The decrease in REO operations expense is primarily driven by higher gains on disposition of REO properties as a result of improvement in home prices during 2012.
Income tax benefit was $1.1 billion for the fourth quarter of 2012, compared to $302 million for the third quarter of 2012. Income tax benefit was $1.5 billion for the full-year 2012, compared to $400 million for the full-year 2011. The increase in both the fourth quarter and full-year 2012 is primarily due to the release of tax reserves as a result of the favorable resolution of tax matters with the IRS.
Total other comprehensive income was $1.3 billion for the fourth quarter of 2012, compared to $2.7 billion for the third quarter of 2012. The decrease mostly reflects that third quarter results benefited from significant spread tightening on non-agency AFS securities whereas non-agency spreads were relatively flat in the fourth quarter of 2012.
Total other comprehensive income was $5.1 billion for the full-year 2012, compared to $4.0 billion for the full-year 2011. The increase is primarily driven by the favorable impact of spread changes on certain of the company’s non-agency AFS securities in 2012, partially offset by lower benefit from interest rates as rates declined less in 2012 as compared to 2011.
Segment Financial Results – Freddie Mac’s operations consist of three reportable segments, which are based on the type of business activities each performs — Investments, Single-family Guarantee and Multifamily. Certain activities that are not part of a reportable segment are included in the All Other
Freddie Mac Fourth Quarter 2012 Financial Results
February 28, 2013
Page 12
category. For both fourth quarter 2012 and full-year 2012, the All Other category primarily reflects the impact of the favorable resolution of tax matters with the IRS.
Summary of Segment Earnings (Loss) and Comprehensive Income (Loss) (1)
| Three Months Ended | Full-Year | |||||||||||||||||
| ($ Billions) | September 30, 2012 |
December 31, 2012 |
2011 | 2012 | ||||||||||||||
| Segment Earnings (loss), net of taxes | ||||||||||||||||||
| 1 | Investments | $ | 2.5 | $ | 1.6 | $ | 3.4 | $ | 8.2 | |||||||||
| 2 | Single-family Guarantee | (0.2 | ) | 1.4 | (10.0 | ) | (0.2 | ) | ||||||||||
| 3 | Multifamily | 0.7 | 0.5 | 1.3 | 2.1 | |||||||||||||
| 4 | All Other | (0.1 | ) | 0.9 | 0.0 | 0.8 | ||||||||||||
|
|
|
|
|
|
|
|
|
|||||||||||
| 5 | Total Segment Earnings (loss), net of taxes | $ | 2.9 | $ | 4.5 | $ | (5.3 | ) | $ | 11.0 | ||||||||
|
|
|
|
|
|
|
|
|
|||||||||||
| Comprehensive income (loss) of segments | ||||||||||||||||||
| 6 | Investments | $ | 4.5 | $ | 2.5 | $ | 6.5 | $ | 11.4 | |||||||||
| 7 | Single-family Guarantee | (0.2 | ) | 1.4 | (10.0 | ) | (0.2 | ) | ||||||||||
| 8 | Multifamily | 1.4 | 1.0 | 2.2 | 4.1 | |||||||||||||
| 9 | All Other | (0.1 | ) | 0.9 | 0.0 | 0.8 | ||||||||||||
|
|
|
|
|
|
|
|
|
|||||||||||
| 10 | Comprehensive income (loss) of segments | $ | 5.6 | $ | 5.7 | $ | (1.2 | ) | $ | 16.0 | ||||||||
|
|
|
|
|
|
|
|
|
|||||||||||
| (1) | Columns may not add due to rounding. |
Investments segment had earnings of $1.6 billion for the fourth quarter of 2012, compared to $2.5 billion for the third quarter of 2012. The decrease in segment earnings is primarily driven by higher security impairments recognized in earnings. Comprehensive income for the Investments segment was $2.5 billion for the fourth quarter of 2012, compared to $4.5 billion for the third quarter of 2012. The decrease primarily reflects lower gains on non-agency AFS securities, coupled with lower segment earnings.
Investments segment had earnings of $8.2 billion for the full-year 2012, compared to $3.4 billion for the full-year 2011. The increase in segment earnings was primarily due to the shift from derivative losses during 2011 to derivative gains during 2012. Comprehensive income for the Investments segment was $11.4 billion for the full-year 2012, compared to $6.5 billion for the full-year 2011, primarily reflecting higher segment earnings.
Single-family Guarantee segment had earnings of $1.4 billion for the fourth quarter of 2012, compared to a loss of $163 million for the third quarter of 2012. The shift from segment loss to segment earnings is primarily driven by the benefit for credit losses in the fourth quarter of 2012 versus the provision for credit losses in the third quarter of 2012. Comprehensive income for the Single-family Guarantee segment approximated segment earnings for both the third and fourth quarters of 2012.
Single-family Guarantee segment had a loss of $164 million for the full-year 2012, compared to a loss of $10.0 billion for the full-year 2011. The decrease in segment loss is primarily attributable to the lower provision for credit losses. Comprehensive income for the Single-family Guarantee segment approximated segment earnings for both full-year 2012 and 2011.
Freddie Mac Fourth Quarter 2012 Financial Results
February 28, 2013
Page 13
Multifamily segment had earnings of $494 million for the fourth quarter of 2012, compared to $710 million for the third quarter of 2012. The decrease in segment earnings is primarily driven by lower gains on mortgage loans recorded at fair value and lower gains on sales of mortgage loans in the fourth quarter of 2012. Comprehensive income for the Multifamily segment was $1.0 billion for the fourth quarter of 2012, compared to $1.4 billion for the third quarter of 2012. The decrease reflects lower segment earnings, as well as lower fair value gains on CMBS due to less favorable market spread movements in the fourth quarter than in the third quarter of 2012.
Multifamily segment had earnings of $2.1 billion for the full-year 2012, compared to $1.3 billion for the full-year 2011. The increase in segment earnings is primarily due to higher gains on mortgage loans recorded at fair value, increased volumes during the year, lower security impairments and higher gains on disposition of certain previously impaired AFS securities during 2012. Comprehensive income for the Multifamily segment was $4.1 billion for the full-year 2012, compared to $2.2 billion for the full-year 2011. The increase is mostly attributable to the favorable impact of spread tightening on CMBS, as well as higher segment earnings in 2012.