Attached files
| file | filename |
|---|---|
| 8-K - 8-K - People's United Financial, Inc. | d491827d8k.htm |
| EX-99.2 - EX-99.2 - People's United Financial, Inc. | d491827dex992.htm |
 2013 KBW Boston Bank Conference
February 27, 2013
Investor Contact:
Peter Goulding, CFA
203-338-6799
peter.goulding@peoples.com
Exhibit 99.1 |
 1
Forward-Looking Statement
Certain statements contained in this release are forward-looking in
nature. These include all statements about People's United
Financial's plans, objectives, expectations and other statements that are not historical facts, and
usually use words such as "expect," "anticipate,"
"believe," "should" and similar expressions. Such statements
represent management's current beliefs, based upon information
available at the time the statements are made, with regard to
the matters addressed. All forward-looking statements are subject to risks and uncertainties that
could cause People's United Financial's actual results or financial
condition to differ materially from those expressed in or
implied by such statements. Factors of particular importance to People’s United Financial
include, but are not limited to: (1) changes in general, national or
regional economic conditions; (2) changes in interest rates; (3)
changes in loan default and charge-off rates; (4) changes in deposit levels; (5) changes in
levels of income and expense in non-interest income and expense
related activities; (6) residential mortgage and secondary
market activity; (7) changes in accounting and regulatory guidance applicable to banks; (8) price
levels and conditions in the public securities markets generally; (9)
competition and its effect on pricing, spending, third-party
relationships and revenues; (10) the successful integration of acquisitions; and (11)
changes in regulation resulting from or relating to financial reform
legislation. People's United Financial does not undertake any
obligation to update or revise any forward-looking statements, whether as a result of new
information, future events or otherwise.
|
 2
Corporate Overview
Snapshot, as of December 31, 2012
People’s United Financial, Inc.
NASDAQ (PBCT)
Headquarters:
Bridgeport, CT
Chief Executive Officer:
Jack Barnes
Chief Financial Officer:
Kirk Walters
Market Capitalization (2/25/13):
$4.4 billion
Assets:
$30.3 billion
Loans:
$21.7 billion
Deposits:
$21.8 billion
Branches:
419
ATMs:
634
Standalone ATMs:*
83
Founded:
1842
* Includes 25 ATMs in Stop & Shop locations where a branch is not
present. |
 3
9.9
0.0
2.0
4.0
6.0
8.0
10.0
12.0
14.0
16.0
Median - US Publicly Traded Banks ($1-$100BN Banks by Assets as of 4Q12)
State of the Industry
Return on Average Tangible Equity
Source: SNL Financial and Company filings
The median return on average tangible equity, since 2Q 2007, the
time of our second
step conversion, is below the current median cost of equity for the industry. . .
Median ROATE 2Q 2007 to 4Q 2012: 8.8% |
 4
9.9
8.6
0.0
2.0
4.0
6.0
8.0
10.0
12.0
14.0
16.0
Median - US Publicly Traded Banks ($1-$100BN Banks by Assets as of 4Q12)
PBCT
State of the Industry
People’s United Differentiation
. . . Since 2Q 2010, the time of a CEO change, People’s United has significantly
improved ROATE
without
the
benefit
of
credit
leverage
which
supported
the
returns
of
the
industry during the same period
Continued organic balance sheet growth, further profitability improvements and active
capital management will continue to differentiate People’s United from
the industry Median ROATE 2Q 2007 to 4Q 2012: 8.8%
CEO Change
Current
Normalized PBCT ROATE *: 11.8%
Notes:
* Current Normalized PBCT ROATE is pro forma for normalized Tangible Common Equity
of 7.75%, in line with peers and excludes the income related to cash & securities above
the normalized 7.75% TCE/TA level
Source:
SNL Financial and Company Filings |
 5
2012 Results
Overview / 2012 vs. 2011
Operating earnings grew 10% to $254 million
Operating EPS grew 14% to $0.75
Operating return on average assets was 90 basis points, up 1 basis point
Operating return on average tangible equity was 8.5%, up 130 basis points
Efficiency ratio improved to 62.4% from 64.0%
Asset quality remained strong
NPAs as a percentage of originated loans, REO and repossessed assets
improved to 1.48%
NCOs to average loans remained low at 21 basis points
Strong capital levels
Tangible common equity to tangible assets ratio at 10.2%
Dividend yield of 5% in 2012*
* Using average stock price in 2012 |
 6
Branch Map |
 7
Fortified Foundation for Growth
Our Relationship Based World |
 8
Strategic Vision Outlined in mid-2010
Optimize the Existing Business
Continue to grow high quality, in-footprint, relationship-based C&I,
commercial real estate, home equity and select residential loans
Maintain conservative underwriting standards and focus on asset quality
Compete on service and relationships and maintain pricing discipline
Yield enhancing moves on investments without credit risk or significant duration
risk Further leverage our brand
Deepen our presence in NYC Metro (Westchester County and Long Island) and Greater
Boston Continue to upgrade our products & services
Build out our small business lending capabilities
Continue to deepen wealth management and insurance relationships
Improved infrastructure facilitates future growth
Core systems conversion complete
Our objective is to reach 1.25% ROAA |
 9
Substantial Progress Since 1Q 2010
Continued to build on our premium brand
Expanding footprint into two of the largest MSAs in the country (NYC, #1 and
Boston, #10)
NYC MSA: 5 branches in 2010, nearly 100 branches in 2012
Boston MSA: 20 branches in 2010, nearly 60 branches in 2012
Attracted senior level talent to augment an already strong leadership team
Significantly enhanced corporate governance and risk management capabilities
Maintained
superior
asset
quality
with
NCOs
/
Average
Loans
of
27
basis
points
Lowered
the
efficiency
ratio
over
15%
from
76.1%
in
1Q
2010
to
63.1%
in
4Q
2012
Improved
profitability
as
demonstrated
by
an
EPS
CAGR
of
over
100%
Operating
ROAA
has
increased
45%
from
60bps
in
1Q10
to
87bps
in
4Q12
Returned over $1.3BN
of capital to shareholders through dividends and share
repurchases –
30% of our current market capitalization
All of this has occurred while the US economy and economic outlook has weakened
10 Year Treasury Yield: 3.83%, Mar. 31, 2010; 1.86%, Feb. 25, 2013
|
 10
Loans
Deposits
Growing Future Earnings Per Share
Loans and Deposits per Share
$65.59
$14
$15
$16
$17
$18
$19
$20
$21
$22
$23
3Q10
4Q10
1Q11
2Q11
3Q11
4Q11
1Q12
2Q12
3Q12
4Q12
$40
$45
$50
$55
$60
$65
$70
Gross Loans ($BN)
Loans per Share
$65.64
$14
$15
$16
$17
$18
$19
$20
$21
$22
$23
3Q10
4Q10
1Q11
2Q11
3Q11
4Q11
1Q12
2Q12
3Q12
4Q12
$40
$45
$50
$55
$60
$65
$70
Deposits ($BN)
Deposits per Share
Over the past two years, loans per share and deposits per share have grown at
compound annual rates of 16% and 14% |
 11
Deepening Market Presence
Connecticut
Massachusetts
Vermont
New York
New Hampshire
Maine
Leading market position in the best commercial banking market in
the US
#1 in Fairfield County, CT, 64 branches, $6.1BN, 18.2% market share
#5 deposit market share in New England
Source: SNL Financial
Branches
$BN
%
1
People's United
42
2.6
22.4
2
TD Bank
34
2.6
22.0
3
Merchants
33
1.2
10.6
4
RBS
21
0.9
7.3
5
KeyCorp
13
0.8
6.7
6
Northfield
13
0.5
4.3
7
Community
14
0.4
3.7
8
Union
13
0.4
3.4
9
Passumpsic
7
0.3
2.9
10
Berkshire Hills
7
0.3
2.8
Branches
$BN
%
1
RBS
80
6.8
24.3
2
TD Bank
72
5.4
19.3
3
B of A
29
4.9
17.5
4
People's United
29
1.4
4.9
5
Merrimack
18
1.0
3.6
6
BNH
23
0.9
3.2
7
Santander
20
0.8
2.9
8
NH Thrift
20
0.8
2.8
9
Northway
17
0.7
2.4
10
Centrix
6
0.7
2.3
Branches
$BN
%
1
B of A
262
54.6
25.0
2
RBS
254
30.9
14.1
3
Santander
229
18.9
8.6
4
TD Bank
157
10.8
5.0
5
Eastern Bank
99
6.8
3.1
6
Independent Bank
78
4.5
2.0
7
Middlesex
30
3.5
1.6
8
People's United
56
3.2
1.5
9
Boston Private
11
2.9
1.3
10
Century
28
2.4
1.1
Branches
$BN
%
1
JPM Chase
804
393.1
38.3
2
Citi
268
69.6
6.8
3
B of A
365
60.6
5.9
4
HSBC
164
57.3
5.6
5
Capital One
277
39.0
3.8
6
M&T
299
33.3
3.3
7
TD Bank
222
22.4
2.2
8
KeyCorp
269
18.3
1.8
9
Wells Fargo
87
18.0
1.8
10
First Niagara
212
16.1
1.6
35
People's United
98
2.5
0.2
Branches
$BN
%
1
TD Bank
55
3.7
16.4
2
KeyCorp
60
2.7
11.7
3
Bangor Bancorp
58
2.0
8.9
4
Camden National
50
1.8
8.1
5
B of A
19
1.4
6.0
6
First Bancorp
15
1.0
4.6
7
Machias
14
0.8
3.6
8
People's United
28
0.8
3.5
9
Bar Harbor
16
0.8
3.4
10
Norway
21
0.7
3.2
Branches
$BN
%
1
B of A
155
24.5
24.0
2
Webster
124
12.1
11.8
3
People's United
166
10.9
10.7
4
Wells Fargo
76
7.3
7.2
5
TD Bank
81
5.9
5.8
6
First Niagara
86
4.6
4.5
7
JPM Chase
52
4.5
4.4
8
Citi
20
3.0
2.9
9
Liberty
48
2.9
2.8
10
RBS
50
2.6
2.5 |
 12
Growing loans and deposits organically
Continue to grow in existing markets
Leverage brand in under-represented markets such as New York and Boston
Lower deposit costs
Improve DDA mix, commercial mix
Lower deposit costs on acquired deposits
Strengthen fee income
Continue to reduce absolute expense levels on a pro forma basis
Operating Leverage
Grow Revenue While Reducing Expenses |
 13
EMOC has been fully operational since November 2011
Three person committee comprised of the CFO, Chief Administrative Officer and
Chief HR Officer EMOC oversees PBCT’s noninterest expense management,
implements strategies to ensure attainment of expense management targets and
oversees revenue initiatives that require expenditures
Provides a horizontal view of the organization
Expense Management Units (EMUs) established to facilitate EMOC functions
Defined EMUs include:
•
Technology
•
Operations
•
Real Estate Services
Spending requests above $25,000 are submitted by EMU owners for approval
Staffing models, staffing replacements and additions for mid-level positions and
above require approval by the Committee
Introduction to EMOC
Expense Management Oversight Committee (EMOC)
•
Employment/Benefits
•
Marketing
•
Regulatory/Institutional
•
Depreciation/Equipment
•
Decentralized
•
Intangible Amortization |
 14
Expense Progress
Estimated Cost Savings Analysis
Our Q4 2012 operating expense base of $204.5MM reflects $35MM (~$140MM
annualized) savings from successfully-executed expense initiatives
Source: SNL Financial
Note:
“Pro
Forma
/
Actual”
represents
PBCT
operating
noninterest
expense
and
the
actual
expenses
at
the
acquired
institutions.
Acquisition target costs fall away as the acquisitions are completed.
“Without
Expense
Initiatives”
represents
PBCT
operating
noninterest
expense
and
the
actual
expenses
at
the
acquired
institutions in 4Q09, and then applies the peer median expense growth rate in each subsequent
quarter. Operating Noninterest Expense ($MM)
205
240
200
210
220
230
240
250
4Q09
1Q10
2Q10
3Q10
4Q10
1Q11
2Q11
3Q11
4Q11
1Q12
2Q12
3Q12
4Q12
Pro Forma / Actual
Without Expense Initiatives
$35MM
Cost
Savings |
 15
Expense Progress
Estimated Cost Savings Analysis
The $35MM in quarterly cost reductions is attributable to efforts related to
acquisition cost savings and other initiatives
Source: SNL Financial
Note:
“Pro
Forma
/
Actual”
represents
PBCT
operating
noninterest
expense
and
the
actual
expenses
at
the
acquired
institutions.
Acquisition target costs fall away as the acquisitions are completed.
“Without
Expense
Initiatives”
represents
PBCT
operating
noninterest
expense
and
the
actual
expenses
at
the
acquired
institutions in 4Q09, and then applies the peer median expense growth rate in each subsequent
quarter. Operating Noninterest Expense ($MM)
240
205
7
28
$0
$50
$100
$150
$200
$250
Without Expense
Initiatives
Announced Acquisition
Savings
Other Initiatives
Pro Forma / Actual |
 16
Expense Management vs. Peers*
Peers* grew non-interest expenses significantly more than PBCT in 2012, even
while we incurred a half year of additional expenses relating to
the Citizens
branch acquisition
Excluding costs associated with the recently acquired southern New York
branches, our operating expense base remained flat at ~$800MM
0.3%
2.6%
PBCT
Peers*
* Notes:
1.
PBCT and Peers expense growth rates are based on full year ended Dec-31-12 vs.
full year ended Dec-31-11
2.
Peers* is defined as 12 peers of 20, including: Associated, BancorpSouth, Commerce,
Cullen/Frost, EastWest, FirstMerit, Fulton, Huntington, Signature, Synovus, Webster,
Zions
3.
8 peers excluded because they completed material acquisitions in either 2011 or 2012,
including: CityNational, Comerica, FirstNiagara, M&T, New York Community,
Susquehanna, Valley, Wintrust |
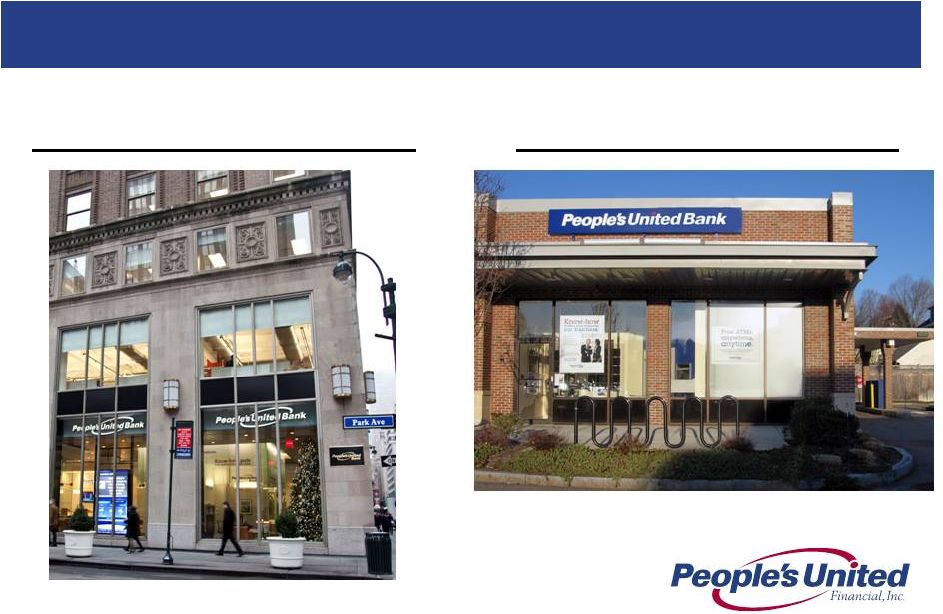 17
Manhattan, NY (Park Ave & 47
th
St.)
Opened December 3, 2012
Wellesley, MA
Opened November 27, 2012
Branch Re-alignment
In 2012, we consolidated or sold 15 branches while we opened three traditional
branches in eastern Massachusetts, Long Island and New York City
|
 18
$35.2
$11.5
($31.8)
$55.5
($40.0)
($30.0)
($20.0)
($10.0)
-
$10.0
$20.0
$30.0
$40.0
$50.0
$60.0
Revenue Initiatives
Revenue-related Expenses
Expense Reductions
Operating Leverage
Recent revenue initiatives with their associated expenses combined with expense
reduction initiatives produced initiative related operating leverage of $56MM, which
represents $0.11/share or 15% of total EPS
In 2013, recent operating leverage initiatives are expected to contribute over 20% of
EPS ($ in millions)
Operating Leverage Initiatives
Creating
New
Opportunities
-
2012
$0.11/share
15% of Total EPS |
 19
Cross-sell
Educating our employee base / breaking down silo thinking
Leveraging technology
2.2
products
per
residential
mortgage
household
and
3.4
products
per
home equity household
667,000 retail households
Penetration rates are measured and monitored closely
Residential mortgage, home equity, wealth management and brokerage offer
large opportunities
Cross-sell performance becoming an increasingly important part of
compensation |
 20
2013 Goals
Execution Driving Performance
Grow loans in the high single digits to mid-teens
Continued
momentum
from
current
initiatives
combined
with
slower
run-off
from the acquired loan portfolio
Increase deposits in the mid single digits
Net interest income target range of $900 to $940 million
Implies net interest margin in the 3.30-3.40% range
Fee income growth in the mid single digits
Full year operating expense target range of $815 to $825 million
Maintain a fortress balance sheet with continued excellent credit quality
and strong capital levels |
 21
Summary
Sustainable Competitive Advantage
Premium brand built over 170 years
High quality Northeast footprint characterized by wealth, density and
commercial activity
Strong leadership team
Solid net interest margin
Superior asset quality
Focus on relationship-based banking
Growing
loans
and
deposits
within
footprint
-
in
two
of
the
largest
MSAs
in
the country (New York City, #1 and Boston, #10)
Improving profitability
Returning capital to shareholders
Strong capital base as evidenced by robust Tier 1 Risk-Based and Tier 1
Common ratios |
 Appendix |
 23
For 3Q 2012 we were more than twice as asset sensitive as the estimated median of our
peer group
Currently for an immediate parallel increase of 100bps, our net interest income is
projected to increase by ~$48MM on an annualized basis
Yield curve twist scenarios confirm that we are reasonably well protected from bull
flattener (short rates are unchanged, long rates fall) and benefit
considerably from bear flattener environments (short rates rise, long rates
are unchanged) Notes:
1.
Analysis is as of 9/30/12 filings
2.
Data as of 9/30/12 SEC filings; where exact +100bps shock up scenario data was not
provided, PBCT interpolated based on data disclosed 3.
Data as of 9/30/12 SEC filings; where exact +200bps shock up scenario data was not
provided, PBCT interpolated based on data disclosed Current Asset
Sensitivity Net Interest Income at Risk
1
Analysis involves PBCT estimates, see notes below
Change in Net Interest Income
Scenario
Lowest
Amongst Peers
Highest
Amongst Peers
Peer Median
PBCT Multiple to
Peer Median
Shock Up
100bps
2
-3.6%
6.7%
2.7%
2.8x
Shock Up
200bps
3
-6.2%
13.4%
4.5%
3.4x |
 24
Notes:
1.
Leverage
(core)
Capital
represents
Tier
1
Capital
(total
stockholder’s
equity,
excluding:
(i)
after-tax
net
unrealized
gains
(losses)
on
certain
securities
classified
as
available
for
sale;
(ii)
goodwill
and
other
acquisition-related
intangibles;
and
(iii)
the
amount
recorded
in
accumulated
other
comprehensive
income
(loss)
relating
to
pension
and
other
postretirement benefits), divided by Adjusted Total Assets (period end total assets
less goodwill and other acquisition-related intangibles) 2.
Tier 1 Common represents total stockholder’s equity, excluding goodwill and
other acquisition-related intangibles, divided by Total Risk-Weighted Assets
3.
Tier 1 Risk-Based Capital represents Tier 1 Capital divided by Total
Risk-Weighted Assets 4.
Total
Risk-Based
Capital
represents
Tier
1
Capital
plus
subordinated
notes
and
debentures,
up
to
certain
limits,
and
the
allowance
for
loan
losses,
up
to
1.25%
of
total
risk
weighted assets, divided by Total Risk-Weighted Assets
5.
Well capitalized limits for the Bank are: Leverage Ratio, 5%; Tier 1 Risk-Based
Capital, 6%; and Total Risk-Based Capital, 10% Capital Ratios
Since 1Q 2010
1Q 2010
1Q 2011
1Q 2012
2Q 2012
3Q 2012
4Q 2012
People’s United Financial
Tang. Com. Equity/Tang. Assets
18.7%
13.9%
11.7%
11.4%
11.2%
10.2%
Leverage Ratio
1, 5
19.2%
14.5%
12.1%
11.8%
11.5%
10.6%
Tier 1 Common ²
23.1%
17.1%
13.9%
13.6%
13.6%
12.7%
Tier 1 Risk-Based Capital
3, 5
23.9%
17.9%
14.4%
14.1%
14.1%
13.2%
Total Risk-Based Capital
4, 5
25.6%
19.4%
16.0%
15.6%
15.6%
14.7%
People’s United Bank
Leverage Ratio
1, 5
12.3%
11.4%
11.0%
10.9%
10.8%
9.8%
Tier 1 Risk-Based Capital
3, 5
15.4%
13.9%
13.1%
13.0%
13.2%
12.2%
Total Risk-Based Capital
4,5
16.3%
14.8%
14.0%
14.0%
14.1%
13.1% |
 25
Peer Group
Firm
Ticker
City
State
1
Associated
ASBC
Green Bay
WI
2
BancorpSouth
BXS
Tupelo
MS
3
City National
CYN
Los Angeles
CA
4
Comerica
CMA
Dallas
TX
5
Commerce
CBSH
Kansas City
MO
6
Cullen/Frost
CFR
San Antonio
TX
7
East West
EWBC
Pasadena
CA
8
First Niagara
FNFG
Buffalo
NY
9
FirstMerit
FMER
Akron
OH
10
Fulton
FULT
Lancaster
PA
11
Huntington
HBAN
Columbus
OH
12
M&T
MTB
Buffalo
NY
13
New York Community
NYCB
Westbury
NY
14
Signature
SBNY
New York
NY
15
Susquehanna
SUSQ
Lititz
PA
16
Synovus
SNV
Columbus
GA
17
Valley National
VLY
Wayne
NJ
18
Webster
WBS
Waterbury
CT
19
Wintrust
WTFC
Lake Forest
IL
20
Zions
ZION
Salt Lake City
UT |
 26
In addition to evaluating People’s United Financial’s results of operations in accordance
with U.S. generally accepted accounting principles (“GAAP”), management routinely
supplements this evaluation with an analysis of certain non-GAAP financial measures, such
as the efficiency and tangible equity ratios, tangible book value per share and operating
earnings metrics. Management believes these non-GAAP financial measures provide information
useful to investors in understanding People’s United Financial’s underlying operating performance
and trends, and facilitates comparisons with the performance of other banks and thrifts. Further, the
efficiency ratio and operating earnings metrics are used by management in its assessment of
financial performance, including non-interest expense control, while the tangible equity
ratio and tangible book value per share are used to analyze the relative strength of
People’s United Financial’s capital position. The
efficiency
ratio,
which
represents
an
approximate
measure
of
the
cost
required
by
People’s
United
Financial
to
generate
a
dollar
of
revenue,
is
the
ratio
of
(i)
total
non-interest
expense
(excluding
goodwill
impairment charges, amortization of other acquisition-related intangible assets, losses on real
estate assets and
non-recurring
expenses)
(the
numerator)
to
(ii)
net
interest
income
on
a
fully
taxable
equivalent
("FTE")
basis plus total non-interest income (including the FTE adjustment on bank-owned life
insurance ("BOLI") income, and excluding gains and losses on sales of assets other than
residential mortgage loans, and non- recurring income) (the denominator). People’s
United Financial generally considers an item of income or expense to be non-recurring if it
is not similar to an item of income or expense of a type incurred within the last two years and
is not similar to an item of income or expense of a type reasonably expected to be incurred
within the following two years.
Non-GAAP Financial Measures and Reconciliation to GAAP
|
 27
Operating earnings exclude from net income those items that management considers to be of such a
non- recurring or infrequent nature that, by excluding such items (net of income taxes),
People’s United Financial’s results can be measured and assessed on a more consistent
basis from period to period. Items excluded from operating earnings, which include, but are not
limited to, merger-related expenses, charges related to executive-level management
separation costs, severance-related costs and writedowns of banking house assets, are
generally also excluded when calculating the efficiency ratio. Operating earnings per share is
derived by determining the per share impact of the respective adjustments to arrive at operating
earnings and adding (subtracting) such amounts to (from) GAAP earnings per share. Operating
return on average assets is calculated by dividing operating earnings (annualized) by average
assets. Operating return on average tangible stockholders' equity is calculated by dividing
operating earnings (annualized) by average tangible stockholders' equity. The operating
dividend payout ratio is calculated by dividing dividends paid by operating earnings for the
respective period. Operating net interest margin excludes from the net interest margin those
items that management considers to be of such a discrete nature that, by excluding such items,
People’s United Financial’s net interest margin can be measured and assessed on a
more consistent basis from period to period. Items excluded from operating net interest margin
include cost recovery income on acquired loans and changes in the accretable yield on acquired
loans stemming from periodic cash flow reassessments. Operating net interest margin is calculated
by dividing operating net interest income (annualized) by average earning assets.
Non-GAAP Financial Measures and Reconciliation to GAAP
|
 28
The
tangible
equity
ratio
is
the
ratio
of
(i)
tangible
stockholders’
equity
(total
stockholders’
equity
less
goodwill and
other
acquisition-related
intangible
assets)
(the
numerator)
to
(ii)
tangible
assets
(total
assets less
goodwill and
other
acquisition-related
intangible
assets)
(the
denominator). Tangible book
value per share is
calculated by
dividing
tangible
stockholders’
equity
by
common
shares (total
common
shares
issued,
less
common shares classified as treasury shares and unallocated Employee Stock
Ownership Plan ("ESOP") common shares).
In light of diversity in presentation among financial institutions, the methodologies used by
People’s United Financial for determining the non-GAAP financial measures discussed
above may differ from those used by other financial institutions. Please refer to People’s
United Financial’s latest Form 10-Q regulatory filing for detailed reconciliations to
GAAP figures. Non-GAAP Financial Measures and Reconciliation to GAAP
|
 For
more information, investors may contact: Peter Goulding, CFA
203-338-6799
peter.goulding@peoples.com |