Attached files
| file | filename |
|---|---|
| 8-K - FORM 8-K - PROVIDENT FINANCIAL SERVICES INC | d492705d8k.htm |
  1
Exhibit 99.1 |
  Certain statements
contained herein are "forward-looking statements" within the meaning of Section 27A of the Securities
Act of 1933 and Section 21E of the Securities Exchange Act of 1934. Such forward-looking
statements may be identified by reference to a future period or periods, or by the use of
forward-looking terminology, such as "may," "will," "believe,"
"expect,"
"estimate,"
"anticipate,"
"continue,"
or
similar
terms
or
variations
on
those
terms,
or
the
negative
of
those
terms. Forward-looking statements are subject to numerous risks and uncertainties,
including, but not limited to, those related to the economic environment, particularly in
the market areas in which Provident Financial Services, Inc. (the “Company”)
operates, competitive products and pricing, fiscal and monetary policies of the U.S. Government, changes in
government regulations affecting financial institutions, including regulatory fees and capital
requirements, changes in prevailing interest rates, acquisitions and the integration of
acquired businesses, credit risk management, asset-liability management, the
financial and securities markets and the availability of and costs associated with sources of liquidity.
The Company cautions readers not to place undue reliance on any such forward-looking
statements, which speak only as of the
date
made.
The
Company
also
advises
readers
that
the
factors
listed
above
could
affect
the
Company's
financial
performance and could cause the Company's actual results for future periods to differ materially
from any opinions or statements expressed with respect to future periods in any current
statements. The Company does not undertake and specifically declines any obligation to
publicly release the result of any revisions which may be made to any forward- looking
statements to reflect events or circumstances after the date of such statements or to reflect the occurrence of
anticipated or unanticipated events.
A detailed discussion of factors that could affect our results is included in our SEC filings,
including the “Risk Factors” section of our Annual Report on Form 10-K for
the year ended December 31, 2011 and our Quarterly Report on Form 10-Q filed November
9, 2012. 2
Forward Looking Statements
|
  Superior
Markets Consistent Performance
Valuable Deposit Franchise
Proven Asset Generator
Capable Risk Manager
Shareholder Focused
3
Why PFS? |
 New
Jersey’s oldest state chartered bank Over 75 branch offices
Wealth Management and Trust Administration Services
Well capitalized under current regulatory standards
Ten year history of quarterly cash dividends to stockholders
No TARP
No dilutive stock offerings
No bulk NPA sales or debt restructurings
4
Company Highlights |
 5
Total Return |
 6
Dividend History |
  7
To date, requests for relief limited to 13 loans
totaling $4.9 million
Effective disaster contingency plan minimized
customer disruption
“At risk”
loans in designated flood zones in
Monmouth, Ocean, and Hudson counties represent
< 4% of the total loan portfolio
Strong sponsors, prudent underwriting, federal
flood insurance, private coverage, and business
interruption insurance are expected to minimize
loss exposure
Costs related to storm damage totaled $624,000 in
Q4 2012
Superstorm Sandy |
 8
2012: A Record Setting Year
2012
Change vs. 2011
Total Assets
$7.3 B
$186 M
2.6%
Loans
$4.9 B
$251 M
5.4%
NIB
$864 M
$166 M
24.0%
Deposits
$5.4 B
$272 M
5.3% |
  2012
Change vs. 2011
Net Int Inc
$217 M
$1 M
0.6%
Non Int Inc
$44 M
$11 M
34.0%
Net Revenue
$261 M
$12 M
5.0%
9
2012: A Record Setting Year
|
  2012
Change vs. 2011
Net Income
$67 M
$10 M
5.3%
EPS
$1.18
$0.17
16.8%
ROAA
0.94%
0.11%
13.3%
ROAE
6.88%
0.79%
13.0%
ROATE
10.88%
1.07%
10.9%
10
2012: A Record Setting Year
|
  11
4 Q 2011
1 Q 2012
2 Q 2012
3 Q 2012
4 Q 2012
1.91%
1.89%
1.81%
1.65%
1.53%
$135,351
$134,783
$129,141
$119,586
$111,463
NPAs
NPAs/Assets
Asset Quality 5 Quarter Trend
|
 12
Asset Quality 5 Quarter Trend |
 Q4 2012
Q3 2012
Q4 2011
ALL/Loans
1.43%
1.46%
1.60%
ALL/NPLs
71.07%
66.50%
60.67%
ALL/Ann. NCOs
4.50 yrs
3.14 yrs
3.53 yrs
13
ALL Coverage
|
 Asset
Composition $6.8 B
$7.3 B
64%
25%
11%
2009
67%
23%
10%
2012
Loans
Investments
Other
A Longer View: Structural Gains
14 |
 Loan
Composition 15
A Longer View: Structural Gains
Commercial
$2.3B
53%
Consumer
$2.1B
47%
2009
Commercial
$3.1B
62%
Consumer
$1.8B
38%
2012 |
 Direct vs.
Indirect Lending 16
A Longer View: Structural Gains
84.0%
11.0%
2.2%
1.8%
1.0%
2009
89.7%
8.4%
0.6%
0.8%
0.5%
2012
Direct
Purchased Residential
SNCs
Indirect Marine
Indirect Auto / Other |
 Total Loans:
$4.9 Billion Average Loan Yield: 4.58%
17
Loan Portfolio – 12/31/12
1-4 Res.
26%
CRE
27%
Multi-
family
15%
Constr.
2%
Consumer
12%
C&I
18% |
  18
Two years average increase between 2010-2012
10.63%
Average
Increase
18.33%
Average
Increase
31.71%
Average
Increase
40.36%
Average
Increase
17.17%
Average
Increase
52.51%
Average
Increase
Loan Originations Trend |
 19
Commercial Real Estate – 12/31/12
Multi-Family
35%
Retail
23%
Office
14%
Industrial
13%
Mixed Used
5%
Special Use
Property
4%
Hotel
3%
Land
1%
Residential
1%
Other
1% |
 20
WAL AFS:
3.6 yrs
HTM:
4.3 yrs
Combined:
3.8 yrs
Municipal
Bonds
22%
Corporate
Notes -
Fixed
0%
Agency Notes -
Fixed
6%
Agency MBS -
Fixed
33%
Agency MBS -
ARMs
6%
Agency CMO -
Fixed
30%
Corporate
CMO -
Fixed
3%
Investment Portfolio – 12/31/12
|
  Funding /
Earning Assets 21
A Longer View: Structural Gains
25%
16%
47%
8%
2009
Time Deposits
Borrowings
IB Core Deposits
NIB Deposits
15%
12%
55%
13%
2012 |
  Non-Interest
Income/ Net Revenue: 2009 = $31.5M, 14.8%
2012 = $43.6M, 16.7%
22
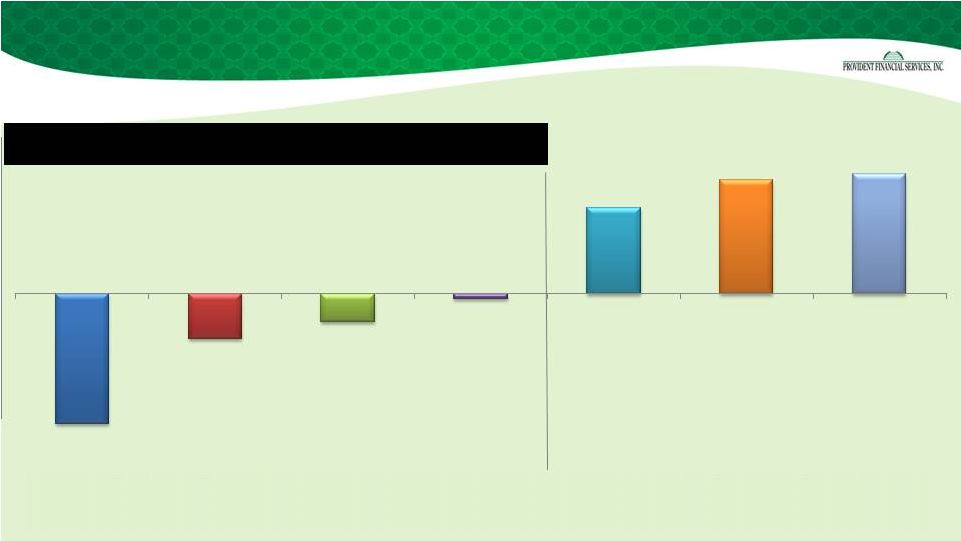
A Longer View: Structural Gains
-2.3%
-0.8%
-0.5%
-0.1%
1.5%
2.0%
2.1%
Deposit fees
($3.2M)
Equity fund income
($1.7M)
BOLI
($0.1M)
Other
$2.0M
Loan fees
$4.0M
Securities gains
$5.1M
Wealth fees &
Annuity Sales
$6.1M |
  Capacity
Utilization 23
*Excludes impact of $152.5 million of Goodwill
impairment in 2009.
A Longer View: Structural Gains
2012
2009
Change
Revenue
$260,950
$212,469
$48,481
Eff.
Eff.
Non-Interest Expense*
Compensation & benefits
80,874
30.99%
68,735
32.35%
-1.36%
Net occupancy expense
20,487
7.85%
20,170
9.49%
-1.64%
Data processing expense
10,318
3.95%
9,325
4.39%
-0.43%
FDIC Insurance
5,095
1.95%
11,778
5.54%
-3.59%
Advertising & promo expense
4,139
1.59%
4,291
2.02%
-0.43%
Amortization of intangibles
2,466
0.95%
5,111
2.41%
-1.46%
Other operating expenses
25,449
9.75%
25,121
11.82%
-2.07%
148,828
57.03%
144,534
68.03%
-10.99%
|
  24
*Excludes impact of $152.5 million of Goodwill impairment in 2009.
A Longer View: Structural Gains
2012
2009 NIM
3.38%
3.06%
Loans/Deposits
90.4%
89.5%
Net Revenues
$261M
$212M
Provision
$16M
$30M
Net Income*
$67M
$31M
|
  25
Capital Ratios – 12/31/12
Provident
Consolidated
Bank
PFS
TCE
-
9.00%
Tier 1 Leverage
7.80%
8.93%
Tier 1 RBC
11.08%
12.68%
Total RBC
12.33%
13.93%
|
  26
Capital flexibility
Recent additions to lending teams in Middle Market /
Consumer / Healthcare / CRE
Technology enhancements
Sandy stimulus
Accelerating economic recovery
Opportunities |
  27
|