Attached files
| file | filename |
|---|---|
| 8-K - 8-K - CALGON CARBON Corp | a13-6115_18k.htm |
Exhibit 99.1
|
|
Investor Presentation Robert W. Baird & Co. February 27, 2013 1 Calgon Carbon Corporation |
|
|
2 Forward-Looking Information Safe Harbor This news release contains historical information and forward-looking statements. Forward-looking statements typically contain words such as “expect,” “believe,” “estimate,” “anticipate,” or similar words indicating that future outcomes are uncertain. Statements looking forward in time, including statements regarding future growth and profitability, price increases, cost savings, broader product lines, enhanced competitive posture and acquisitions, are included in the company’s most recent Annual Report pursuant to the “safe harbor” provision of the Private Securities Litigation Reform Act of 1995. They involve known and unknown risks and uncertainties that may cause the company’s actual results in future periods to be materially different from any future performance suggested herein. Further, the company operates in an industry sector where securities values may be volatile and may be influenced by economic and other factors beyond the company’s control. Some of the factors that could affect future performance of the company are changes in, or delays in the implementation of, regulations that cause a market for our products, acquisitions, higher energy and raw material costs, costs of imports and related tariffs, labor relations, capital and environmental requirements, changes in foreign currency exchange rates, borrowing restrictions, validity of patents and other intellectual property, and pension costs. In the context of the forward-looking information provided in this news release, please refer to the discussions of risk factors and other information detailed in, as well as the other information contained in the company’s most recent Annual Report. |
|
|
Agenda Overview of Calgon Carbon Corporation Major Growth Opportunities Corporate Initiatives 3 |
|
|
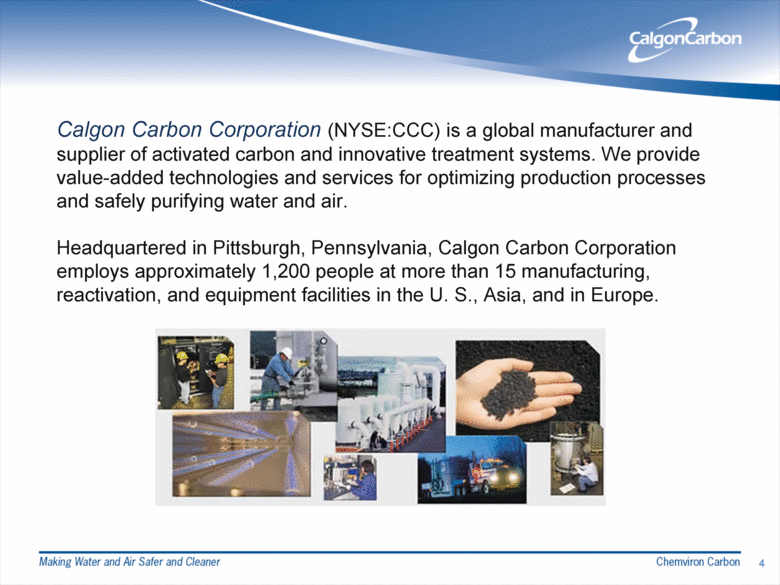
4 Calgon Carbon Corporation (NYSE:CCC) is a global manufacturer and supplier of activated carbon and innovative treatment systems. We provide value-added technologies and services for optimizing production processes and safely purifying water and air. Headquartered in Pittsburgh, Pennsylvania, Calgon Carbon Corporation employs approximately 1,200 people at more than 15 manufacturing, reactivation, and equipment facilities in the U. S., Asia, and in Europe. |
|
|
Corporate Overview Headquarters in Pittsburgh, Pennsylvania Business regions Americas Asia EMEA (Europe, Middle East, Africa) Facilities 7 production sites 9 Reactivation sites (+ two under construction) 5 R&D or technical support centers Sales: $562MM (2012) Employees: ~ 1,200 5 |
|
|
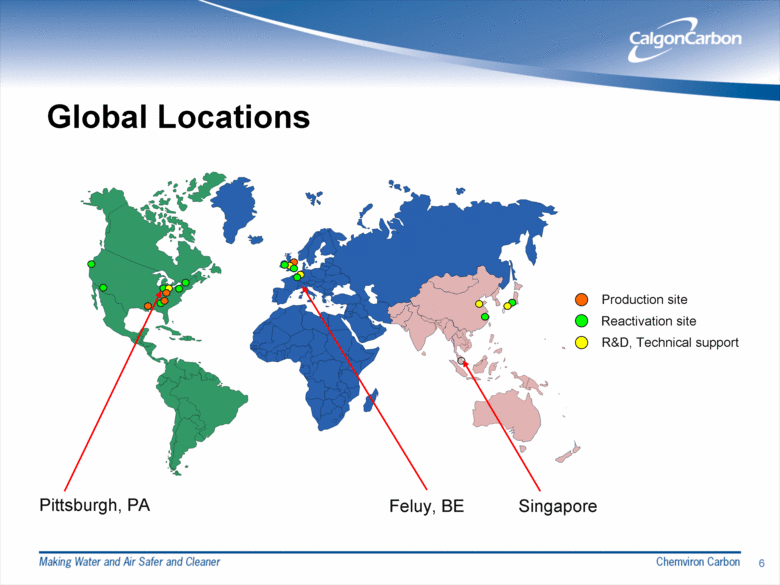
Global Locations Feluy, BE Pittsburgh, PA Production site Reactivation site R&D, Technical support Singapore 6 |
|
|
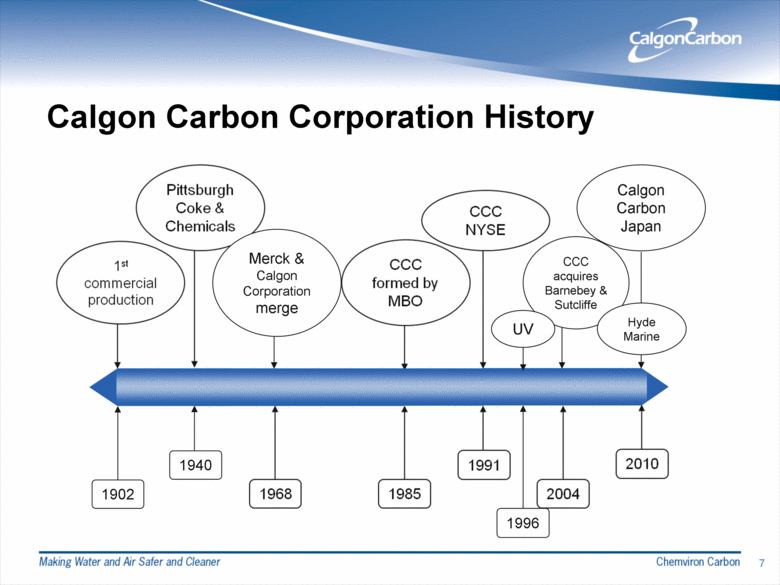
Calgon Carbon Corporation History 1902 1940 Merck & Calgon Corporation merge CCC acquires Barnebey & Sutcliffe Calgon Carbon Japan 1996 UV Hyde Marine 7 |
|
|
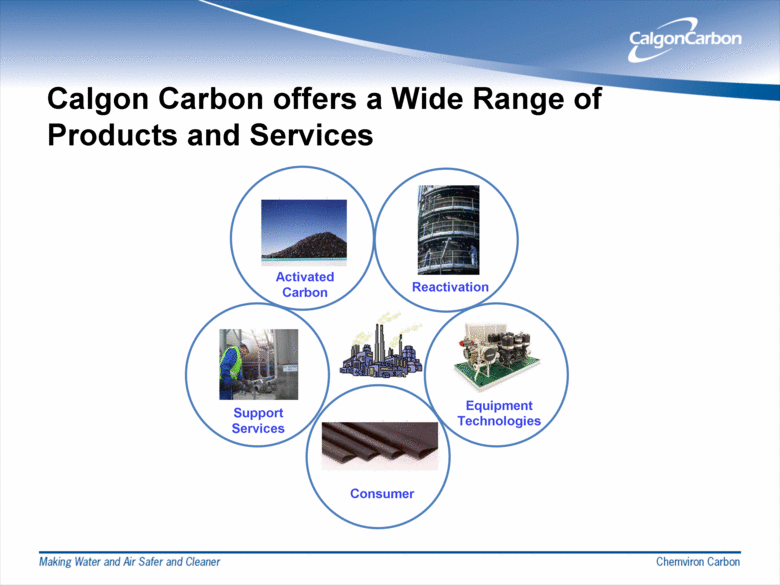
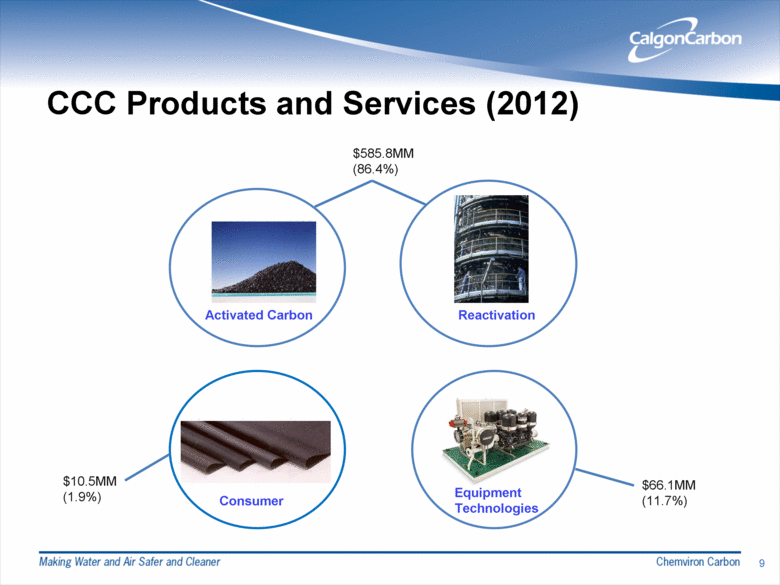
Calgon Carbon offers a Wide Range of Products and Services Consumer Activated Carbon Reactivation Equipment Technologies Support Services |
|
|
CCC Products and Services (2012) 9 Activated Carbon Reactivation Equipment Technologies Consumer $585.8MM (86.4%) $66.1MM (11.7%) $10.5MM (1.9%) |
|
|
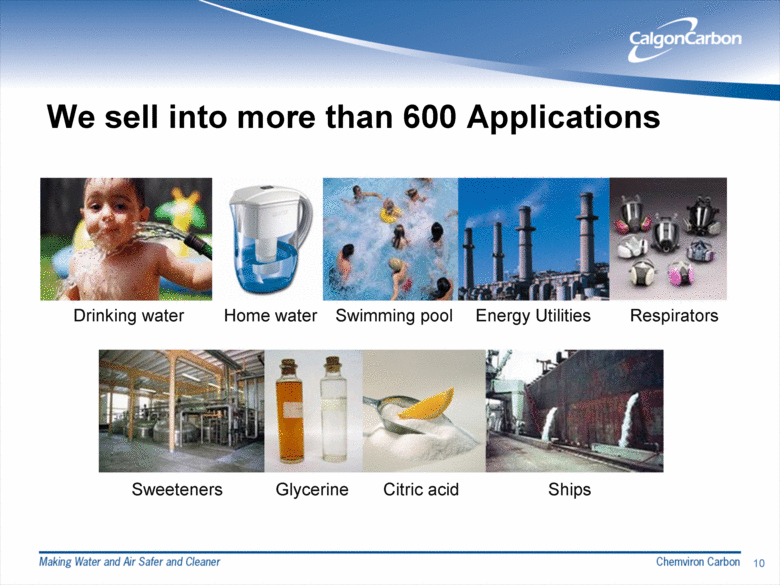
We sell into more than 600 Applications Home water Drinking water Sweeteners Ships Glycerine Citric acid Swimming pool Energy Utilities Respirators 10 |
|
|
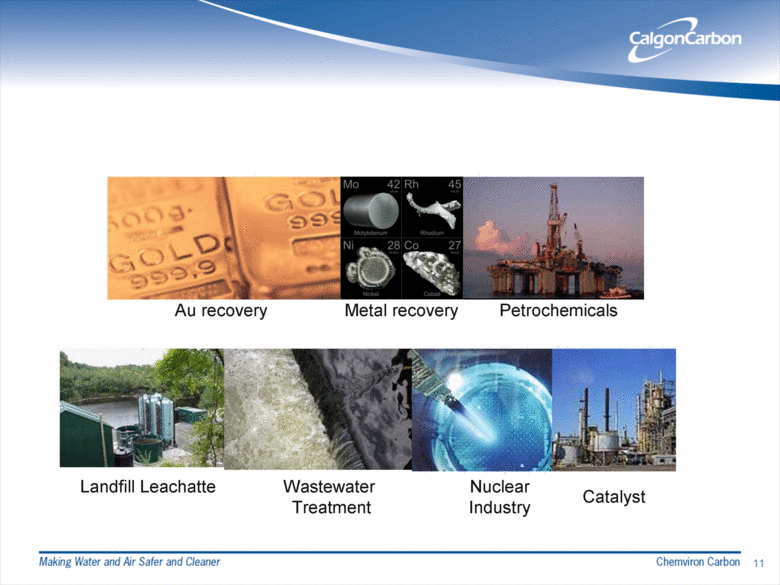
Au recovery Metal recovery Petrochemicals Landfill Leachatte Wastewater Treatment Catalyst Nuclear Industry 11 |
|
|
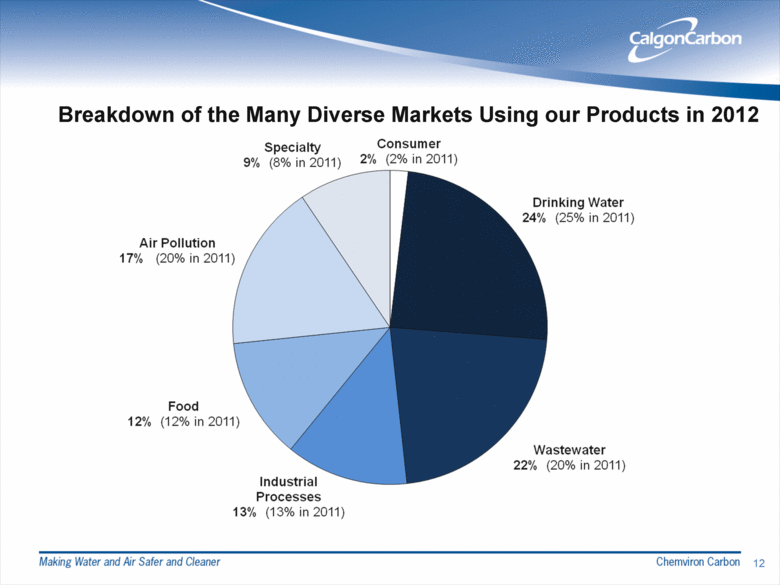
12 Breakdown of the Many Diverse Markets Using our Products in 2012 12 |
|
|
The focus at Calgon Carbon is growing our traditional businesses while capitalizing on emerging regulation-driven growth markets 13 Emerging Markets include: - Disinfection Byproduct Control- Municipal Drinking Water - Mercury Removal from Coal-Fired Power Plants - Ballast Water Treatment |
|
|
Growth Opportunities with Emerging Markets 2012 - 2020 14 |
|
|
Control of Disinfection Byproducts (DBP) in Municipal Drinking Water Market Size: $100 M+/Yr. Market Driver: U.S. EPA regulation DBPs formed when chlorine reacts with naturally occurring matter in drinking water DBPs increase health risks: cancer/reproductive and developmental effects Stage 2 Disinfectants and Disinfection Byproduct Rule promulgated in 2006 mandates control of DBPs (Compliance: 2013 – 2015) CCC Solution: Granular Activated Carbon (GAC) + Reactivation Excellent application for GAC CCC global leader in GAC production and reactivation Cost: $6.00/year per family 15 |
|
|
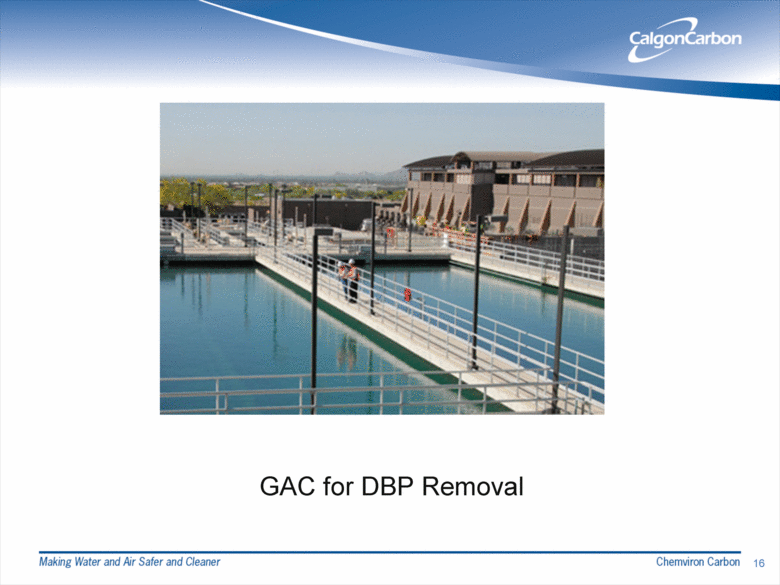
16 GAC for DBP Removal |
|
|
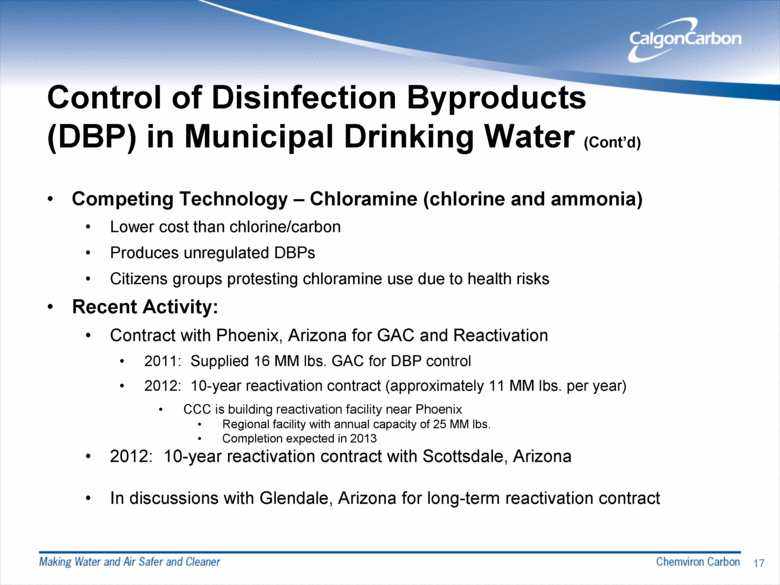
Control of Disinfection Byproducts (DBP) in Municipal Drinking Water (Cont’d) Competing Technology – Chloramine (chlorine and ammonia) Lower cost than chlorine/carbon Produces unregulated DBPs Citizens groups protesting chloramine use due to health risks Recent Activity: Contract with Phoenix, Arizona for GAC and Reactivation 2011: Supplied 16 MM lbs. GAC for DBP control 2012: 10-year reactivation contract (approximately 11 MM lbs. per year) CCC is building reactivation facility near Phoenix Regional facility with annual capacity of 25 MM lbs. Completion expected in 2013 2012: 10-year reactivation contract with Scottsdale, Arizona In discussions with Glendale, Arizona for long-term reactivation contract 17 |
|
|
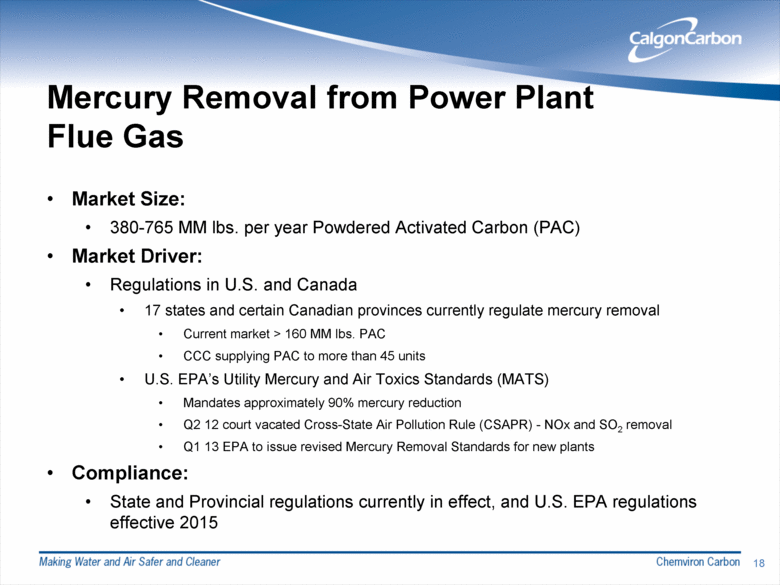
Mercury Removal from Power Plant Flue Gas Market Size: 380-765 MM lbs. per year Powdered Activated Carbon (PAC) Market Driver: Regulations in U.S. and Canada 17 states and certain Canadian provinces currently regulate mercury removal Current market > 160 MM lbs. PAC CCC supplying PAC to more than 45 units U.S. EPA’s Utility Mercury and Air Toxics Standards (MATS) Mandates approximately 90% mercury reduction Q2 12 court vacated Cross-State Air Pollution Rule (CSAPR) - NOx and SO2 removal Q1 13 EPA to issue revised Mercury Removal Standards for new plants Compliance: State and Provincial regulations currently in effect, and U.S. EPA regulations effective 2015 18 |
|
|
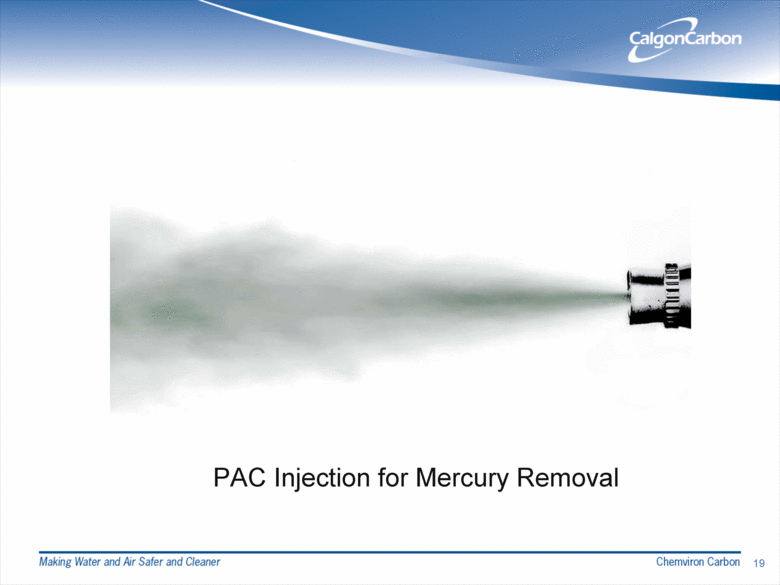
19 PAC Injection for Mercury Removal |
|
|
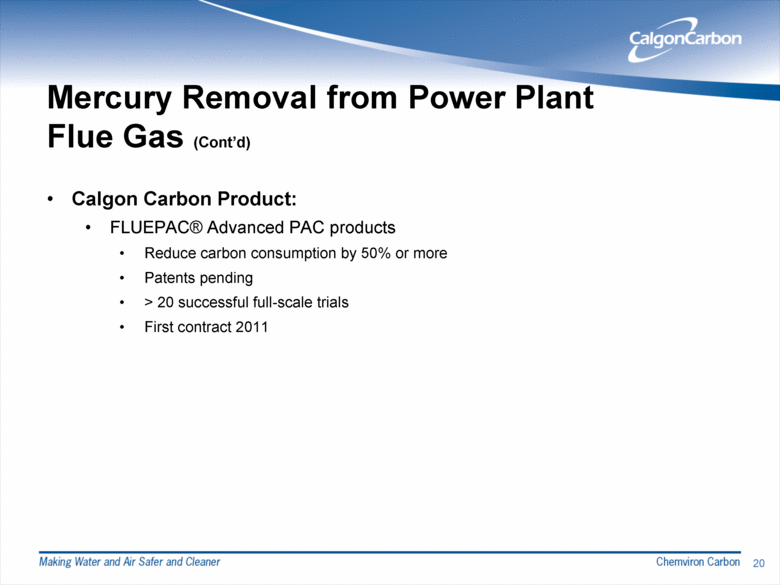
Mercury Removal from Power Plant Flue Gas (Cont’d) Calgon Carbon Product: FLUEPAC® Advanced PAC products Reduce carbon consumption by 50% or more Patents pending > 20 successful full-scale trials First contract 2011 20 |
|
|
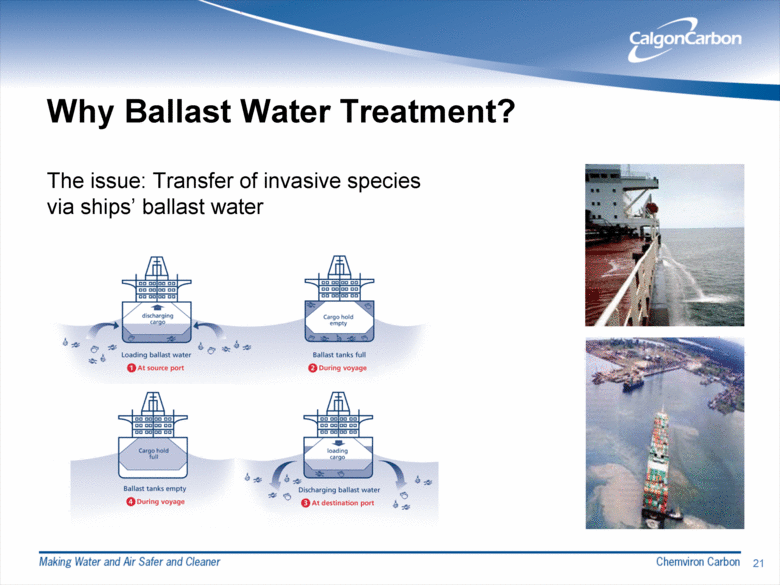
21 Why Ballast Water Treatment? The issue: Transfer of invasive species via ships’ ballast water |
|
|
Ballast Water Disinfection – Largest Growth Opportunity for Calgon Carbon Market Size: $15 B (60,000 ships New and Retrofits)* Market Driver: Regulations U.S. Coast Guard rule issued 3/23/12 International Maritime Organization regulations pending U.S. Coast Guard (USCG) Compliance: New Ships Keel laid after 12/1/13 – at delivery Retrofits 2014 – 2020 22 *Internal Estimate – Systems only |
|
|
Ballast Water Disinfection – Largest Growth Opportunity for Calgon Carbon (cont.) U.S. Coast Guard (USCG) Compliance (cont): System with IMO Type Approval may be designated Alternative Management System (AMS) by USCG Ships with AMS can discharge ballast water in U.S. ports for 5 years without USCG Type Approval 23 *Internal Estimate – Systems only |
|
|
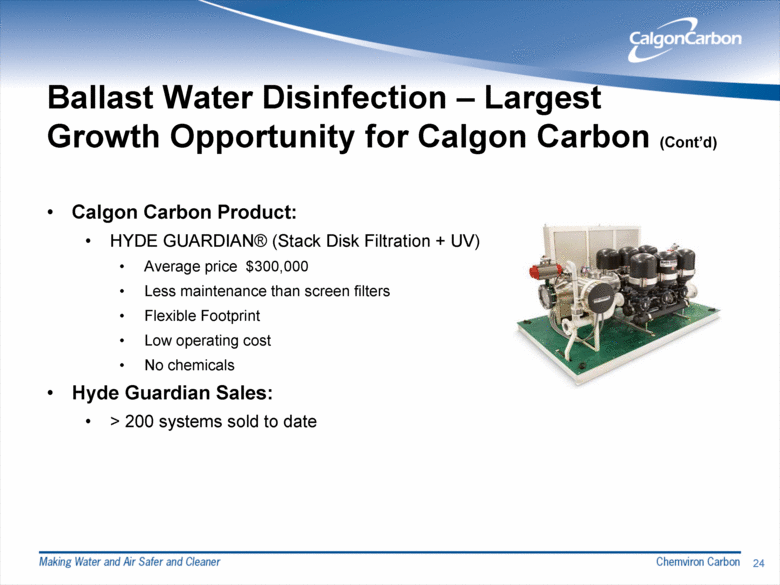
Ballast Water Disinfection – Largest Growth Opportunity for Calgon Carbon (Cont’d) Calgon Carbon Product: HYDE GUARDIAN® (Stack Disk Filtration + UV) Average price $300,000 Less maintenance than screen filters Flexible Footprint Low operating cost No chemicals Hyde Guardian Sales: > 200 systems sold to date 24 |
|
|
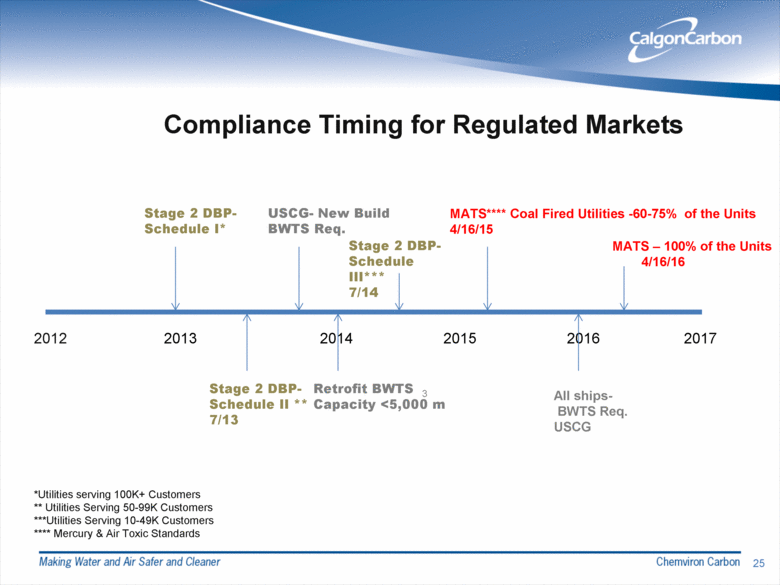
2012 2015 2013 2014 2016 2017 Compliance Timing for Regulated Markets Stage 2 DBP- Schedule I* Stage 2 DBP- Schedule II ** 7/13 USCG- New Build BWTS Req. Retrofit BWTS Capacity <5,000 m 3 MATS**** Coal Fired Utilities -60-75% of the Units 4/16/15 All ships- BWTS Req. USCG MATS – 100% of the Units 4/16/16 *Utilities serving 100K+ Customers ** Utilities Serving 50-99K Customers ***Utilities Serving 10-49K Customers **** Mercury & Air Toxic Standards Stage 2 DBP- Schedule III*** 7/14 25 |
|
|
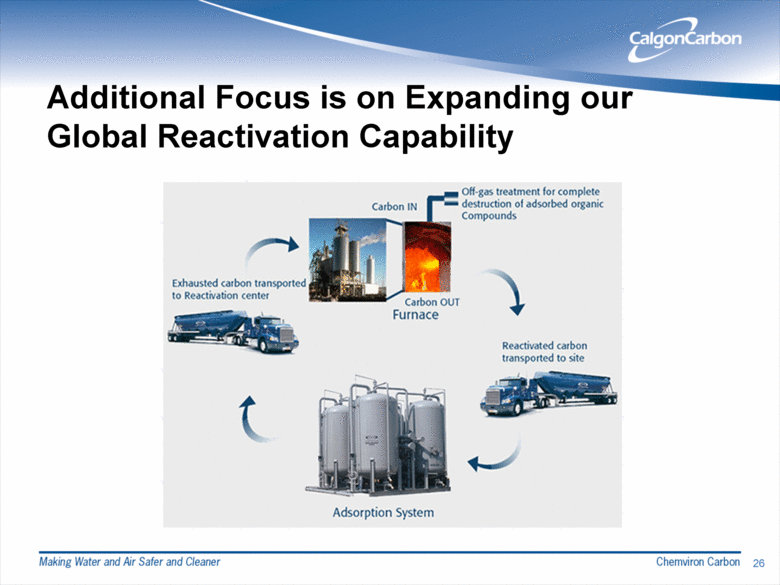
Additional Focus is on Expanding our Global Reactivation Capability 26 |
|
|
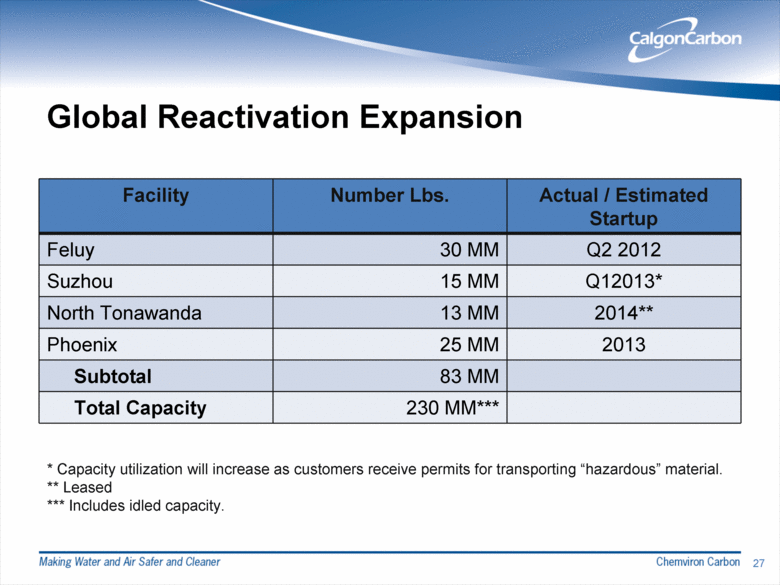
Global Reactivation Expansion Facility Number Lbs. Actual / Estimated Startup Feluy 30 MM Q2 2012 Suzhou 15 MM Q12013* North Tonawanda 13 MM 2014** Phoenix 25 MM 2013 Subtotal 83 MM Total Capacity 230 MM*** 27 * Capacity utilization will increase as customers receive permits for transporting “hazardous” material. ** Leased *** Includes idled capacity. |
|
|
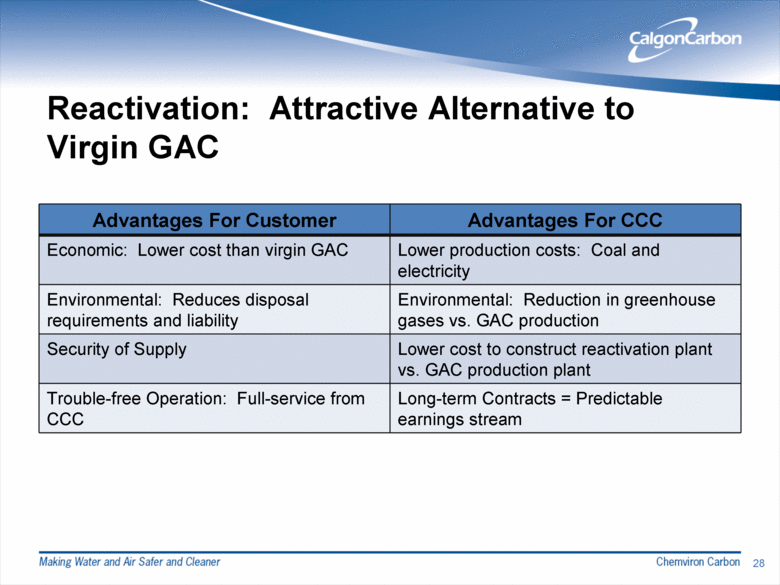
Reactivation: Attractive Alternative to Virgin GAC Advantages For Customer Advantages For CCC Economic: Lower cost than virgin GAC Lower production costs: Coal and electricity Environmental: Reduces disposal requirements and liability Environmental: Reduction in greenhouse gases vs. GAC production Security of Supply Lower cost to construct reactivation plant vs. GAC production plant Trouble-free Operation: Full-service from CCC Long-term Contracts = Predictable earnings stream 28 |
|
|
Anti-Dumping Tariff Update 2006: Tariffs first imposed by International Trade Commission on Chinese activated carbon imports to U.S. Periodic reviews by Department of Commerce can change tariff rate Current Average Tariff Rate changed from $0.13/lb. to $0.47/lb. (Nov. 2012) CCC’s current tariff rate: $0.00/lb. U.S. International Trade Commission announced (Feb. 2013) that anti-dumping order will remain in effect until at least 2017. 29 |
|
|
30 Corporate Initiatives |
|
|
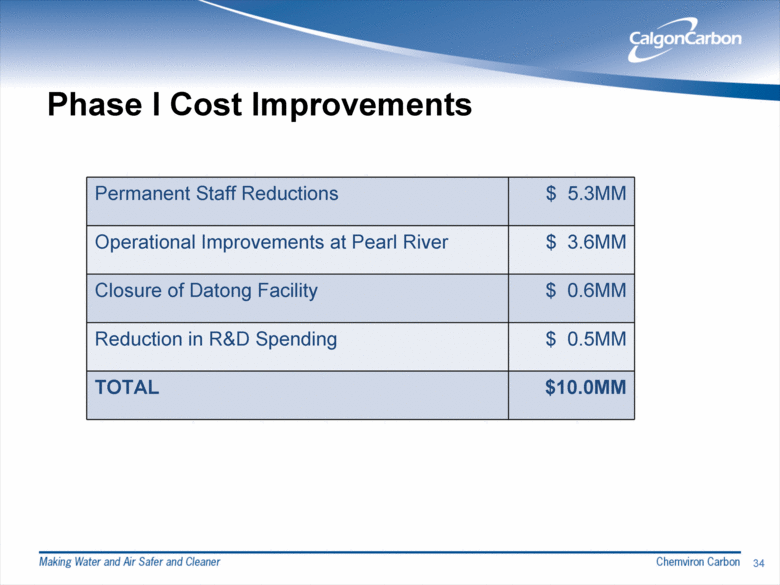
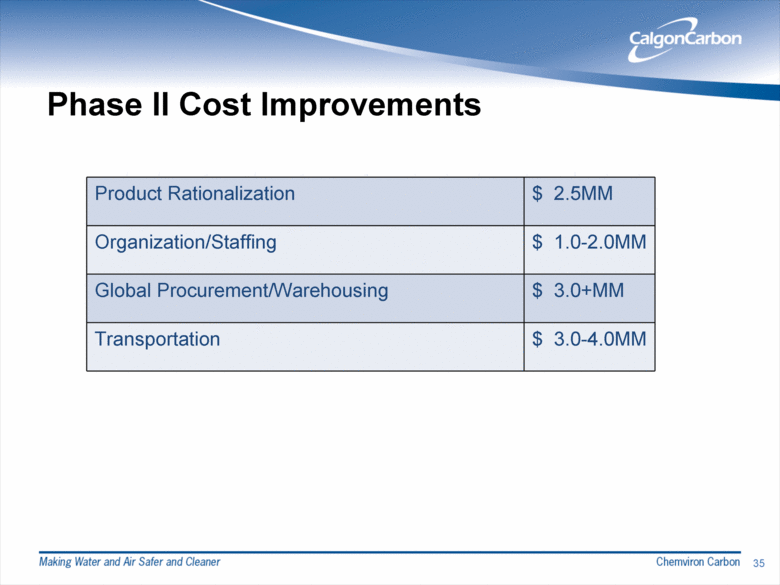
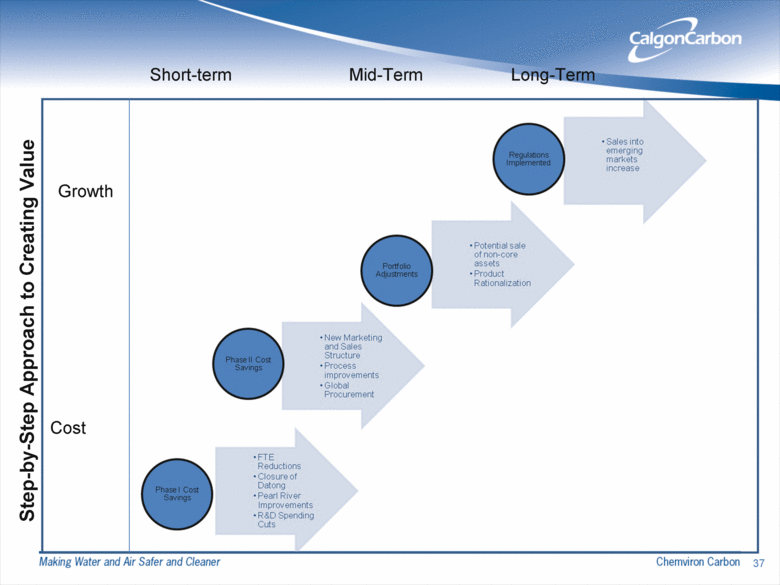
Profitability Improvement is 2012 Top Priority Improve balance in top- and bottom-line growth 2009 – 2011 Revenue CAGR = 14.7% 2009 – 2011 Net Income CAGR = 0.1% Organizational realignment for company unification Q2 12 initiated Cost Improvement Program Phase I – $10MM in annual savings ($9.0MM in 2013) Phase II – $10MM to start in 2013 ($6.0MM in 2013) 31 |
|
|
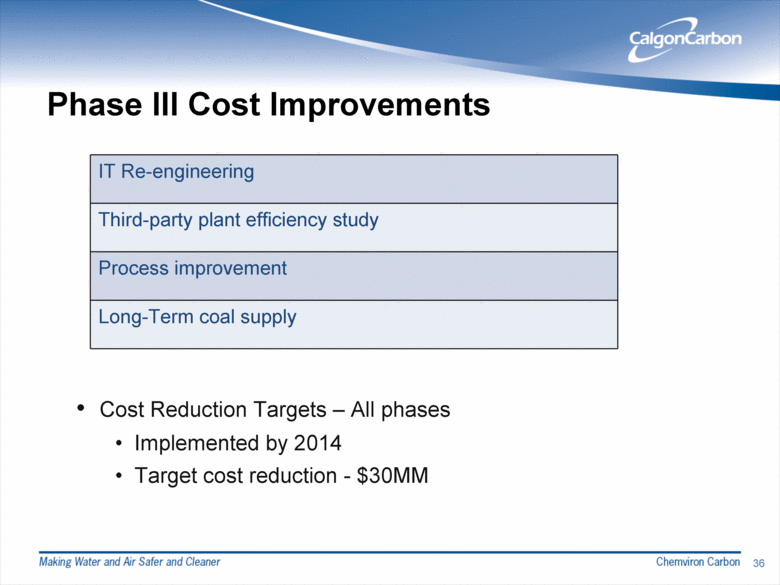
Comprehensive Approach to Shareholder Value Creation Executing worldwide cost and profit improvement program Transforming company into a leaner, higher-performance enterprise and improving profitability through three-part, $30MM cost cutting effort Reengineering organizational structure Centralizing sales, marketing, and product management activities in order to sharpen focus on key markets and optimize opportunities for long-term growth 32 Several key initiatives have launched within the past few months |
|
|
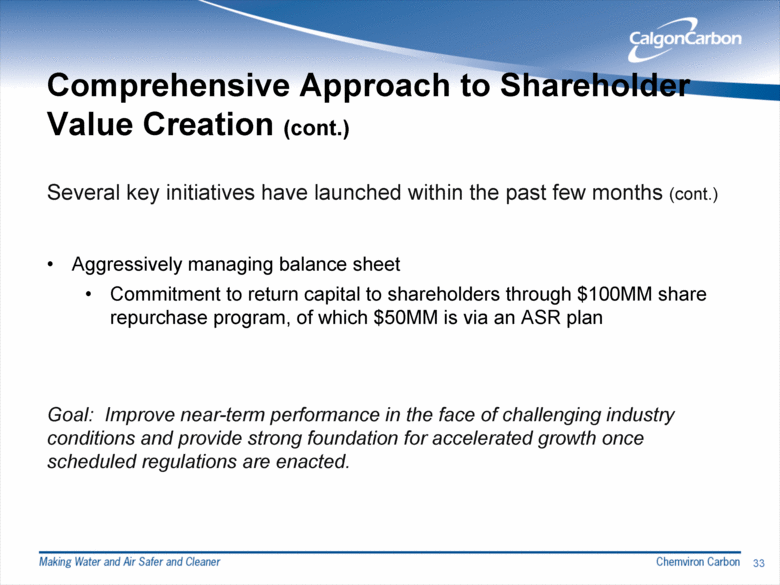
Comprehensive Approach to Shareholder Value Creation (cont.) Aggressively managing balance sheet Commitment to return capital to shareholders through $100MM share repurchase program, of which $50MM is via an ASR plan 33 Several key initiatives have launched within the past few months (cont.) Goal: Improve near-term performance in the face of challenging industry conditions and provide strong foundation for accelerated growth once scheduled regulations are enacted. |
|
|
Phase I Cost Improvements Permanent Staff Reductions $ 5.3MM Operational Improvements at Pearl River $ 3.6MM Closure of Datong Facility $ 0.6MM Reduction in R&D Spending $ 0.5MM TOTAL $10.0MM 34 |
|
|
Phase II Cost Improvements Product Rationalization $ 2.5MM Organization/Staffing $ 1.0-2.0MM Global Procurement/Warehousing $ 3.0+MM Transportation $ 3.0-4.0MM 35 |
|
|
Phase III Cost Improvements IT Re-engineering Third-party plant efficiency study Process improvement Long-Term coal supply 36 Cost Reduction Targets – All phases Implemented by 2014 Target cost reduction - $30MM |
|
|
37 Cost Short-term Mid-Term Long-Term Growth Step-by-Step Approach to Creating Value |
|
|
Thank You! 38 |

