Attached files
| file | filename |
|---|---|
| 8-K - FORM 8-K - REDWOOD TRUST INC | d458614d8k.htm |
| EX-99.1 - EX-99.1 - REDWOOD TRUST INC | d458614dex991.htm |
Exhibit 99.2

|
|

| |
|
TABLE OF CONTENTS
|

| Introduction |
4 | |||
| Shareholder Letter |
5 | |||
| Quarterly Overview |
9 | |||
| Financial Insights |
15 | |||
| u Balance Sheet |
15 | |||
| u GAAP Income |
19 | |||
| u REIT Taxable Income and Dividends |
24 | |||
| u Cash Flow |
26 | |||
| Residential Mortgage Banking Activities |
28 | |||
| Residential Real Estate Securities |
29 | |||
| Commercial Mortgage Banking Activities |
32 | |||
| Investments in Consolidated Entities |
34 | |||
| Appendix |
36 | |||
| Redwood’s Business Strategy |
37 | |||
| The “Qualified Mortgage” Rule and our Business |
40 | |||
| Accounting Discussion |
42 | |||
| Glossary |
43 | |||
| Financial Tables |
51 | |||
| THE REDWOOD REVIEW | 4TH QUARTER 2012 | 1 |
|
|
| |
|
CAUTIONARY STATEMENT
|
This Redwood Review contains forward-looking statements within the meaning of the safe harbor provisions of the Private Securities Litigation Reform Act of 1995. Forward-looking statements involve numerous risks and uncertainties. Our actual results may differ from our expectations, estimates, and projections and, consequently, you should not rely on these forward-looking statements as predictions of future events. Forward-looking statements are not historical in nature and can be identified by words such as “anticipate,” “estimate,” “will,” “should,” “expect,” “believe,” “intend,” “seek,” “plan,” and similar expressions or their negative forms, or by references to strategy, plans, or intentions. These forward-looking statements are subject to risks and uncertainties, including, among other things, those described in our most recent Annual Report on Form 10-K under the caption “Risk Factors.” Other risks, uncertainties, and factors that could cause actual results to differ materially from those projected are described below and may be described from time to time in reports we file with the Securities and Exchange Commission, including reports on Forms 10-K, 10-Q, and 8-K. We undertake no obligation to update or revise forward-looking statements, whether as a result of new information, future events, or otherwise.
Statements regarding the following subjects, among others, are forward-looking by their nature: (i) statements we make regarding Redwood’s future business strategy and strategic focus, including: the opportunities we see for our business resulting from, among other things, the government eventually reducing its role in the mortgage market (including through reform of Fannie Mae and Freddie Mac); new bank regulation (including Basel III capital standards); future demand for commercial loan refinancing transactions; and increasing servicing fees we earn that result from our ownership of mortgage servicing rights; (ii) statements relating to our general intention to retain profits generated and taxed in our operating subsidiaries and our belief that retaining any such profits will enhance our ability to grow profitably (and that, if we are successful, shareholders could reasonably expect to benefit from both dividends and also from rising book value and share value); (iii) statements describing and relating to our residential goals for 2013, including: our goals of adding additional loan sellers, loan products, and capital sources; our goals to acquire and securitize approximately $7 billion of residential mortgage loans; our plan to acquire “jumbo conforming” loans; and our belief that we will be able to compete for and generate revenues from the acquisition and securitization of jumbo conforming loans, which goals may not be achieved or, if achieved, may not result in positive financial results; (iv) statements relating to our ability to profit in 2013 from accumulating conforming residential loans and selling them to Fannie Mae or Freddie Mac, that we see attractive opportunities to acquire mortgage servicing rights associated with conforming loans, and our statement that this conforming loan business activity is an area that could generate healthy volume and profits in the future; (v) statements relating to the profits or margins we may earn in the future from acquiring and securitizing residential mortgage loans (including that the margins we expect to earn from this activity in a more normalized business environment range between 25 to 50 basis points), the reduction in residential loan origination (and acquisition) volume that could result from future increases in mortgage interest rates, and our plan to sustain or grow the volume of residential loans we acquire and market share in 2013 and beyond; (vi) statements describing and relating to our commercial goals for 2013, including originating for sale $1 billion of senior commercial loans and originating for investment $150 million of mezzanine commercial loans, our statement that, while we expect mezzanine loan origination opportunities to wane over time, we still expect to find attractive opportunities in 2013, and our statement that we expect to sell a senior commercial loan that is currently on our balance sheet in the first quarter of 2013, which goals may not be achieved or, if achieved, may not result in positive financial results; (vii) any statements relating to our competitive position and our ability to compete in the future; (viii) any statements relating to our future investment strategy and future investment activity, including, without limitation, that over time, as senior securities in our portfolio continue to pay down or be sold, we expect that investments created through our Sequoia program or other mortgage banking activities, as well as through the acquisition of newly issued subordinate securities from third-party securitization sponsors, will replace the senior residential securities in our investment portfolio; (ix) our statements relating to acquiring residential mortgage loans in the future, including our future acquisition of loans that we have identified for purchase or plan to purchase, including the amount of such loans that we identified for purchase at December 31, 2012 and at February 15, 2013; (x) statements relating to future residential loan securitization and sale transactions and the size and timing of the completion of those
| 2 | THE REDWOOD REVIEW | 4TH QUARTER 2012 |
|
|
| |
|
CAUTIONARY STATEMENT
|
future transactions, including the number of securitization transactions we expect to complete in the first quarter of 2013 and our goal to acquire and securitize $7 billion of jumbo residential mortgage loans in 2013, assuming market conditions are favorable, which future transactions may not be completed when planned or at all, and, more generally, statements regarding the likelihood and timing of, and our participation in, future transactions of these types and our ability to finance residential loan acquisitions through the execution of these types of transactions, and the profitability of these transactions; (xi) our statement that we expect to recover an aggregate of less than $1 million of loan loss reserves that relate to a Sequoia securitization entity in future periods; (xii) our statements relating to our estimate of our investment capacity (including that we estimate our investment capacity was approximately $130 million at December 31, 2012) and our statement that we believe this level of investment capacity should sustain our capital needs through the first quarter of 2013; (xiii) any statements relating to future market and economic conditions and the future volume of transactions in those markets, including, without limitation, future conditions in the residential and commercial real estate markets and related financing markets, and the related potential opportunities for our residential and commercial businesses; (xiv) our beliefs about, and our outlook for, the future direction of housing market fundamentals, including, without limitation, home prices, household formation and demand for housing, delinquency rates, foreclosure rates, repayment rates, inventory of homes for sale, affordability, and mortgage interest rates and their potential impact on our business and results of operations and our beliefs that certain delinquency trends should eventually cause total mortgage delinquencies to fall, that, absent a second recession, low interest rates should protect from additional declines in home prices, that we believe housing prices are in the process of stabilizing, and that we do not expect housing, in general, to be a significantly appreciating asset class for several years; (xv) statements relating to the potential impact of the new “Qualified Mortgage” rule on our business, including that we don’t currently believe certain aspects of this rule should have much of an impact on our business, that the rule’s actual short- and long-term impact on us will depend, in large part, on how the credit rating agencies and triple-A securitization investors assess the investment risks associated with certain aspects of the rule, and that certain aspects of the rule could increase the percentage of interest-only loans we securitize and expand our share of this market; (xvi) our expectations regarding credit reserves, credit losses, the adequacy of credit support, and impairments and their impact on our investments (including as compared to our original expectations and credit reserve levels) and the timing of losses and impairments, and statements that the amount of credit reserves we designate are adequate or may require changes in the future; (xvii) any statements relating to our expectations regarding future interest income and net interest income, future earnings, future gains, future earnings volatility, and future trends in operating expenses and the factors that may affect those trends; (xviii) our statement that we are committed to paying a meaningful dividend in the future and the statement of our Board of Directors’ intention to pay a regular dividend of $0.28 per share per quarter in 2013; (ixx) statements regarding our estimates of REIT taxable income and estimated total taxable income for the fourth quarter of 2012, the third quarter of 2012, and the full year 2012; and (xx) our expectations and estimates relating to the characterization for income tax purposes of our dividend distributions (including, without limitation, that we expect 77% of the dividends we distributed in 2012 to be taxable to shareholders as ordinary income and 23% to be characterized as return of capital), our expectations and estimates relating to tax accounting, and our anticipation of additional credit losses for tax purposes in future periods (and, in particular, our statement that, for tax purposes, we expect an additional $111 million of credit losses on residential securities to be realized over an estimated three-to-five year period).
| THE REDWOOD REVIEW | 4TH QUARTER 2012 | 3 |
|
|
| |
|
INTRODUCTION
|
Note to Readers:
We file annual reports (on Form 10-K) and quarterly reports (on Form 10-Q) with the Securities and Exchange Commission. These filings and our earnings press releases provide information about Redwood and our financial results in accordance with generally accepted accounting principles (GAAP). We urge you to review these documents, which are available through our web site, www.redwoodtrust.com.
This document, called The Redwood Review, is an additional format for providing information about Redwood through a discussion of many GAAP and non-GAAP metrics, such as taxable income and economic book value. Supplemental information is also provided in the Financial Tables in this Review to facilitate more detailed understanding and analysis of Redwood. When we use non-GAAP metrics it is because we believe that these figures provide additional insight into Redwood’s business. In each case in which we discuss a non-GAAP metric you will find an explanation of how it has been calculated, why we think the figure is important, and a reconciliation between the GAAP and non-GAAP figures.
References herein to “Redwood,” the “company,” “we,” “us,” and “our” include Redwood Trust, Inc. and its consolidated subsidiaries. References to “at Redwood” exclude all consolidated securitization entities (with the exception of the residential resecuritization we completed in the third quarter of 2011 and the commercial mezzanine securitization we completed in the fourth quarter of 2012) in order to present our operations in the way management analyzes them. Note that because we round numbers in the tables to millions, except per share amounts, some numbers may not foot due to rounding. References to the “fourth quarter” refer to the quarter ending December 31, 2012, and references to the “third quarter” refer to the quarter ending September 30, 2012, unless otherwise specified.
We hope you find this Review helpful to your understanding of our business. We thank you for your input and suggestions, which have resulted in our changing the form and content of The Redwood Review over time.
|
Selected Financial Highlights
| ||||||||||||
| Quarter: Year | GAAP Income (Loss) per Share |
REIT Taxable Income (Loss) per Share (1) |
Annualized GAAP Return on Equity |
GAAP
Book Value per Share |
Non-GAAP Economic Value per Share (2) |
Dividends per Share | ||||||
| Q410 | $0.18 | ($0.01) | 6% | $13.63 | $14.31 | $0.25 | ||||||
| Q111 | $0.22 | $0.09 | 8% | $13.76 | $14.45 | $0.25 | ||||||
| Q211 | $0.11 | $0.02 | 4% | $13.04 | $13.81 | $0.25 | ||||||
| Q311 | $0.01 | $0.09 | 1% | $12.22 | $13.33 | $0.25 | ||||||
| Q411 | ($0.03) | $0.04 | (1%) | $11.36 | $12.45 | $0.25 | ||||||
| Q112 | $0.37 | $0.13 | 13% | $12.22 | $13.18 | $0.25 | ||||||
| Q212 | $0.24 | $0.22 | 8% | $12.00 | $12.87 | $0.25 | ||||||
| Q312 | $0.48 | $0.19 | 16% | $12.88 | $13.62 | $0.25 | ||||||
| Q412 | $0.50 | $0.23 | 15% | $13.95 | $14.48 | $0.25 | ||||||
| (1) REIT taxable income per share for 2012 is an estimate until we file tax returns for that year. | ||||||||||||
| (2) Non-GAAP economic value per share is calculated using estimated bid-side values (which take into account available bid-side marks) for our financial assets and estimated offer-side values (which take into account available offer-side marks) for our financial liabilities, when available, using the same valuation process used to estimate the fair values of our other financial assets and liabilities under GAAP. Non-GAAP economic value is reconciled to GAAP book value in the Financial Insights section and in Table 3 in the Financial Tables in the Review. | ||||||||||||
| 4 | THE REDWOOD REVIEW | 4TH QUARTER 2012 |
|
|

| |
|
SHAREHOLDER LETTER
|
Dear Fellow Shareholders:
It’s gratifying to see some tangible results and to be able to reward the patience of our shareholders after three years of hard work and investment in building our new residential and commercial loan platforms. Having said that, we want to assure you that no one at Redwood is walking around high-fiving. The team is hard at work and driven with a clear sense of purpose. In 2012, we broke through. Today it is about continuing to execute and using our strong positions in both the residential and commercial markets as foundations for growth and shareholder value creation.
We continue to put considerable effort into the Redwood Review. As a key source of news and information about Redwood, we strive to keep this publication fresh, topical, and informative. And much like our business, the Review continues to evolve. This quarter we have added a new module entitled “Redwood’s Business Strategy” that aims to convey our “big picture” business strategies and assumptions and to provide additional details on our business model. We hope you like this change and we encourage you to give the new section a read.
As our business evolves, we are also improving how we present our financials to reflect our business initiatives in a simpler and more transparent way. For example, when we recently sold legacy assets, we were able to deconsolidate certain legacy entities. This deconsolidation simplified and clarified our financial presentation, although it did cause a bit of one-time noise in the numbers this quarter. We will walk you through this in detail later in the Review.
Not Your Typical Mortgage REIT
Analysts and investors puzzle about how to categorize Redwood and how to value our company. This is not a simple task. There are no really “spot-on” peers. Most other mortgage real estate investment trusts (REITs) have drastically different business models (e.g., REITs that invest in Fannie Mae and Freddie Mac mortgage-backed securities and that pass through 90% or more of the earnings to shareholders in the form of dividends). So we thought it would be constructive to share our high level thoughts on how we view our business model, dividends, capital retention, and valuation.
One important distinction we note between Redwood and many of the other REITs is our management compensation structure. We are internally managed and most of our compensation is directly impacted by Redwood’s financial performance, aligning our interests with shareholders. This is in contrast to the more common externally-managed REIT structure, where compensation is more closely linked to the amount of equity under management.
Second, the operating aspects of our business are increasing in importance relative to our investing activities. Our residential and commercial mortgage banking operations generate earnings that are taxable earnings within an ordinary corporate structure. Our investing activities use the tax advantages of a REIT structure to efficiently hold mortgage-related investments. Valuing both the taxable and non-taxable components of our business, to arrive at a value for the consolidated entity, Redwood Trust, is not a simple exercise.
| THE REDWOOD REVIEW | 4TH QUARTER 2012 | 5 |
|
|
| |
|
SHAREHOLDER LETTER
|
One challenge to this hybrid model is that our dividend declarations and policy cannot be analyzed using the same approach one would use for an investment in a pass-through mortgage REIT. For us, dividends will not track earnings directly, as we generally intend to retain profits generated and taxed in our operating subsidiaries. While this retention may lead to lower dividend pay-out ratios and a lower dividend-yielding stock compared to a pass-through mortgage REIT, we believe it will enhance our ability to grow profitably. As with most other operating companies, we will be retaining a portion of our earnings, allowing us to fund growth internally. This strategy is intended to make each share more valuable over time. If we are successful, shareholders could reasonably expect to benefit both from dividends and also from rising book value and share value.
Redwood remains committed to paying a meaningful dividend as a portion of our generation of shareholder value. We expect that the investing activities in our REIT will remain a significant portion of our overall business. These activities generate income that we must distribute as dividends. Furthermore, we are always aware that, in some circumstances, distributing as dividends the after-tax earnings of our operating subsidiaries may be the best use of those earnings. So that could be a portion of our future dividends as well. Otherwise, we will reinvest the after-tax earnings in our business with the goal of increasing company value per share.
Our goal over time is for the market to value Redwood primarily on the basis of our earnings and earnings growth prospects, as opposed to an exclusive focus on our dividend and book value. We strive to not be tethered to book value. We realize we are not there yet. As we evolve and operating earnings expand, we plan to continue presenting the metrics we believe are useful for analyzing our residential and commercial platforms, so the market can better evaluate our earnings and growth prospects as well as our competitive advantages and opportunities.
Recap of 2012 and Goals for 2013
Now, let’s take a brief look back on 2012. We think it was, by and large, a fairly successful year, as we were able to generate a 13.3% return on equity for shareholders while executing on our strategic goals.
Our residential goals for 2012 were to acquire $2 billion of prime jumbo residential loans from 30-40 originators and to complete four to six Sequoia securitizations. We exceeded those goals by acquiring $2.3 billion of loans, increasing the number of active sellers to 62 by the end of the year, and by completing six securitizations. We were also able to invest an aggregate of $150 million in new Sequoia securitizations during 2012.
Our commercial goals for 2012 were to originate between $200 and $300 million of mezzanine commercial loans and to obtain debt financing for this portfolio. We successfully completed a secured financing of our mezzanine commercial loan portfolio in the fourth quarter of 2012, the first securitization of its kind in the post-crisis period. While we originated only $156 million of mezzanine commercial loans, we also shifted our strategy in the second half of the year to transition toward originating senior commercial loans and boosting gain-on-sale income. We ended up originating $61 million of senior commercial loans and are working to expand this aspect of our business in the year ahead.
For 2013, our residential goals are to add additional loan sellers, loan products, and capital sources. We also have a goal to acquire and securitize approximately $7 billion of residential mortgage loans in 2013.
| 6 | THE REDWOOD REVIEW | 4TH QUARTER 2012 |
|
|
| |
|
SHAREHOLDER LETTER
|
We expect that the majority of the residential loans we acquire will be jumbo loans that are too large (i.e., over $417,000 in most areas and over $625,500 in high cost areas) to be sold to Fannie Mae or Freddie Mac (the “Agencies”). We also plan to acquire “jumbo conforming” loans, those between $417,000 and $625,500. The fees the Agencies charge originators to guarantee these loans are rising at the same time that our operations and securitizations are becoming more efficient. As a result, we believe Redwood will be able to compete for and generate revenues from the acquisition and securitization of jumbo conforming loans.
We also believe we can begin to profit later this year from accumulating conforming residential loans (balances of $417,000 or less) and then selling them to the Agencies. We currently have approval to sell conforming loans we acquire to Freddie Mac and we are working toward obtaining similar approval from Fannie Mae. In addition, we see attractive opportunities (for the first time in many years) to acquire mortgage servicing rights (MSRs) associated with conforming loans. In order to manage MSRs and to accommodate the expected growth in our jumbo conduit activities, we recently leased office space in Denver, Colorado, a supportive environment with a good labor pool of skilled mortgage banking professionals. It is too early to provide numbers around this conforming loan opportunity, but it is an area that could generate healthy volume and profits in the future.
We are also interested in potential credit-risk sharing opportunities with the Agencies. We are one of several companies that have been discussing risk-sharing ideas with the Agencies, which has turned out to be a more complicated project than perhaps initially envisioned. Given the size of the Agency market, the potential opportunity to participate could be substantial, but this is also too early to gauge.
Our commercial goals for 2013 include originating for sale $1 billion of senior commercial loans and originating for investment $150 million of mezzanine commercial loans. We are off to a good start, having originated $80 million of senior commercial loans and $25 million of mezzanine commercial loans through February 15, 2013.
Qualified Mortgage Rule
We’ve been asked how the recently issued Qualified Mortgage (QM) rule will affect our jumbo mortgage business activity. One reason we get asked is that, historically, a large percentage of the loans we have securitized through our Sequoia platform had an interest-only (IO) feature – and under the rule a residential mortgage loan with an IO feature will not, by definition, be a QM. The short answer is that because the borrowers under the IO loans we acquire generally have favorable credit profiles, we currently don’t believe that this aspect of the QM rule should have much of an impact on our business.
We also note that IO loans have been a smaller and declining percentage of our recent securitizations. Of the eight securitizations we completed from January 2012 through January 2013, only 6% (by loan count) and 8.5% (by dollar amount) have had IO features. There are also other aspects of the QM rule, including limitations on debt-to-income ratios and points and fees, that could affect our jumbo business and we are still analyzing their potential impact.
Our ability to continue to acquire and securitize IO loans, however, is dependent in large part on how the risks related to these non-QM loans are regarded by credit rating agencies (who establish subordination levels and credit ratings for our Sequoia securitization transactions) and by the triple-A investors that invest in the mortgage-backed securities issued in these transactions. We remain comfortable with this
| THE REDWOOD REVIEW | 4TH QUARTER 2012 | 7 |
|
|
| |
|
SHAREHOLDER LETTER
|
type of loan product and we are working to keep ourselves positioned to continue to acquire, securitize, and invest in IO loans even after the QM rule goes into effect in January 2014. We have more in-depth comments on the QM rule in the Appendix of this Review.
Closing
We made good progress executing on our residential and commercial strategies in 2012 and we are off to a good start in 2013. Rest assured that we understand we are only at the beginning stages of the build-out of our mortgage banking platforms and we are just as hungry today for success as we ever have been before. We recognize we have a long way to go and we appreciate your continued support.

|

| |
| Martin S. Hughes | Brett D. Nicholas | |
| CEO | President |
| 8 | THE REDWOOD REVIEW | 4TH QUARTER 2012 |
|
|

| |
|
QUARTERLY OVERVIEW
|
Fourth Quarter 2012 Results
Overview
Our residential and commercial business activities continued to generate good results in the fourth quarter, and this has carried over into the start of 2013. Fourth quarter 2012 highlights (with details following in subsequent parts of this Quarterly Overview) include:
| • | We completed two residential securitizations totaling $622 million |
| • | At year-end, we held residential loans totaling $561 million for sale or securitization and our pipeline of loans identified for purchase was $2.3 billion |
| • | Our residential loan gain on sale margins remained elevated |
| • | We completed a secured financing of $291 million of mezzanine commercial loans, freeing up $168 million in capital for investment |
| • | We originated four new mezzanine commercial loans totaling $21 million |
| • | We made progress on our senior commercial loan initiative, originating two senior loans totaling $24 million and ending 2012 with senior loans in application of $80 million |
Financial Results
We maintained positive earnings momentum in the fourth quarter of 2012, earning $42 million, or $0.50 per share, as compared to $40 million, or $0.48 per share, in the third quarter of 2012. We believe that our key earnings metrics were encouraging. In terms of the major earnings components (after giving effect to the one-time reclassification adjustment described below), net interest income on our investments was in line with past quarters, mortgage banking income continued to trend higher, operating expenses were up only modestly from the third quarter due to our expanding infrastructure, and realized gains on sales were lower than in the third quarter.
During the fourth quarter of 2012, we sold our remaining interests in nine legacy Acacia entities and ten legacy Sequoia entities. Our interests in these entities had an aggregate economic value of approximately $8 million. From a financial reporting standpoint, however, our interests in these legacy entities added significant complexity to our balance sheet presentation, as we were required to consolidate these legacy entities’ underlying assets and liabilities, which totaled $933 million and $948 million, respectively, at November 30, 2012.
The sale of our interests in these legacy entities triggered a derecognition of their underlying assets and liabilities for financial reporting purposes and resulted in a $4 million net, non-recurring increase to fourth quarter 2012 earnings. The $4 million net, non-recurring increase is not reflected as a simple line item in our fourth quarter income statement. Instead, it is expressed as an $11 million decrease to net interest income, reflecting the accelerated recognition of deferred hedging costs relating to Acacia entities, and a $15 million realized gain upon deconsolidation. The $15 million gain primarily reflects the proceeds we received on the sale of our interests in these legacy entities, as well as our recovery of excess loan loss reserves related to legacy Sequoia entities that we were required to record in past periods under GAAP.
| THE REDWOOD REVIEW | 4TH QUARTER 2012 | 9 |
|
|
| |
|
QUARTERLY OVERVIEW
|
Financial Results (continued)
The table below sets forth the components of our third and fourth quarter 2012 net income, together with a non-GAAP presentation of the components of our fourth quarter 2012 net income. The non-GAAP presentation reflects a reclassification adjustment which, overall, does not impact reported net income under GAAP, but which we believe is useful for investors because it reflects the impact of the deconsolidation of legacy Acacia and Sequoia entities in a manner consistent with the way management analyzes fourth quarter results of operations and the manner in which management compares our fourth quarter results to our third quarter 2012 results.
|
Components of Consolidated Income |
| |||||||||||||||
| ($ in millions)
|
| |||||||||||||||
| Three Months Ended | ||||||||||||||||
| 12/31/12 | 9/30/12 | |||||||||||||||
| As Reported | Reclassification Adjustment (1) |
(Non-GAAP) As Adjusted |
As Reported | |||||||||||||
| Net interest income |
$ | 20 | $ | 11 | $ | 31 | $ | 31 | ||||||||
| Provision for loan losses |
(3 | ) | - | (3 | ) | (1 | ) | |||||||||
| Other market valuation adjustments, net |
(1 | ) | - | (1 | ) | (3 | ) | |||||||||
| Mortgage banking activities, net |
24 | - | 24 | 17 | ||||||||||||
| Operating expenses |
(18 | ) | - | (18 | ) | (17 | ) | |||||||||
| Total realized gains, net: (2) |
||||||||||||||||
| Realized gains on sales, net |
5 | - | 5 | 14 | ||||||||||||
| Realized gain on deconsolidation |
15 | (11 | ) | 4 | - | |||||||||||
| Provision for income taxes
|
|
-
|
|
|
-
|
|
|
-
|
|
|
(1
|
)
| ||||
| Net income |
$ | 42 | $ | - | $ | 42 | $ | 40 | ||||||||
(1) The Reclassification Adjustment column shows a reclassification adjustment related to the deconsolidation of certain legacy Acacia and Sequoia entities that impacts items reported under GAAP, but which, overall, does not impact reported net income: Net interest income is increased by $11 million to address the non-recurring decrease to net interest income resulting from accelerated recognition of $11 million of deferred hedging costs relating to Acacia entities upon deconsolidation of these entities; and Realized gain on deconsolidation is decreased by $11 million to reflect that the deconsolidation of these Sequoia and Acacia entities resulted in a non-recurring net increase to earnings of only $4 million.
(2) Total realized gains, net were $20 million as reported under GAAP for the three months ended December 31, 2012.
Continuing on with our quarterly results, the $24 million of mortgage banking revenue we realized in the fourth quarter of 2012 made up a larger share of our reported revenues than the $17 million we reported for the third quarter of 2012. The increase was due to higher residential securitization and loan acquisition volumes and attractive gain on sale margins that remain well above the more normalized 25 to 50 basis points that we expect to earn over time from this activity. Our profits on residential loans that we have accumulated and sold into securitizations continue to be driven by the relatively wide spread between jumbo mortgage rates and securitization funding costs.
Net interest income was the other primary revenue driver during the fourth quarter of 2012. As adjusted by the non-GAAP reclassification adjustment set forth in the table above, net interest income was $31 million in the fourth quarter, which was equal to GAAP net interest income in the third quarter, as our investment activity for third-party securities remained subdued. As reported under GAAP, net interest income for the fourth quarter was $20 million.
Realized gains from sales of third-party securities with an amortized cost of $15 million were $5 million in the fourth quarter of 2012. This compares to sales of third-party securities with an amortized cost of $48 million and realized gains of $14 million in the prior quarter.
The GAAP Income section of this Redwood Review provides additional details of both our fourth quarter and annual 2012 results.
| 10 | THE REDWOOD REVIEW | 4TH QUARTER 2012 |
|
|
| |
|
QUARTERLY OVERVIEW
|
GAAP book value at December 31, 2012, was $13.95 per share, an increase of $1.07 per share from September 30, 2012. Continued rising prices for our securities contributed $0.59 per share of the increase. We also retained $0.25 per share of fourth quarter 2012 GAAP earnings after the payment of a $0.25 per share fourth quarter dividend. An additional $0.15 per share of the increase resulted from the deconsolidation of Acacia and certain Sequoia entities during the fourth quarter.
The following table presents a summary of GAAP book value for the fourth and third quarters of 2012.
|
Changes in GAAP Book Value Per Share |
| |||||||||||
| ($ in per share)
|
| |||||||||||
| Q4 2012 | Q3 2012 | Variance | ||||||||||
| Beginning book value |
$ | 12.88 | $ | 12.00 | $ | 0.88 | ||||||
| Net income |
0.50 | 0.48 | 0.02 | |||||||||
| Unrealized gains on securities |
0.59 | 0.52 | 0.07 | |||||||||
| Unrealized gains on hedges (1) |
0.20 | 0.04 | 0.16 | |||||||||
| Equity issuance |
0.01 | 0.06 | (0.05 | ) | ||||||||
| Other, net |
0.02 | 0.03 | (0.01 | ) | ||||||||
| Dividends |
(0.25 | ) | (0.25 | ) | - | |||||||
| Ending book value |
$ | 13.95 | $ | 12.88 | $ | 1.07 | ||||||
(1) Unrealized gains on hedges for the three months ended December 31, 2012, includes $0.15 per share attributable to the accelerated recognition of deferred hedging costs relating to Acacia entities and resulting from the deconsolidation of these entities in the fourth quarter of 2012.
Portfolio Acquisition and Sales Activity
We deployed $63 million of capital into new investments in the fourth quarter of 2012, down from $88 million in the third quarter of 2012.
The following table summarizes our quarterly investment activity during 2012.
|
Quarterly Investment Activity |
| |||||||||||||||||||
| ($ in millions)
|
| |||||||||||||||||||
| Q4 2012 | Q3 2012 | Q2 2012 | Q1 2012 | YTD 2012 | ||||||||||||||||
| Sequoia RMBS |
$ | 42 | $ | 24 | $ | 23 | $ | 61 | $ | 150 | ||||||||||
| Third-party RMBS |
- | 33 | 103 | 223 | 359 | |||||||||||||||
| Less: Short-term debt |
- | (9 | ) | (83 | ) | (175 | ) | (267 | ) | |||||||||||
| Total residential |
42 | 48 | 43 | 109 | 242 | |||||||||||||||
| Commercial loans |
21 | 40 | 69 | 27 | 157 | |||||||||||||||
| Equity capital invested |
$ | 63 | $ | 88 | $ | 112 | $ | 136 | $ | 399 | ||||||||||
| THE REDWOOD REVIEW | 4TH QUARTER 2012 | 11 |
|
|
| |
|
QUARTERLY OVERVIEW
|
Residential Securities Portfolio
At December 31, 2012, our residential securities portfolio totaled $1.1 billion and was financed with a combination of $372 million of short-term debt, $165 million of non-recourse resecuritization debt, and $558 million of equity. Compared to the end of the third quarter of 2012, our RMBS portfolio was up over 3 percentage points in price, or $40 million, in the fourth quarter of 2012, due in part to the overall firming of home prices and the Federal Reserve’s continued purchases of Agency MBS. Given strong demand for seasoned RMBS and a steady decline in market yields, we continued to strategically sell selected positions and free up capital for new investments.
We did not purchase any third-party securities in the fourth quarter of 2012. Our fourth quarter portfolio investment activity was instead driven by our acquisition of $42 million of subordinate and interest-only (IO) securities created from new Sequoia securitizations. For all of 2012, we created and retained $150 million of securities from Sequoia securitizations. Over time, we expect that investments created through our Sequoia program or other mortgage banking activities, as well as through the acquisition of newly issued subordinate securities from third-party securitization sponsors, will replace the senior residential securities in our investment portfolio. Senior securities in our portfolio continue to pay down or be sold, and represented 67% of the portfolio at the end of the fourth quarter of 2012, down from 71% at the end of the third quarter of 2012, and down from 75% a year ago.
Residential Mortgage Banking Activities
Our Sequoia residential mortgage loan platform had a strong fourth quarter and full year in 2012 as measured by increases in: 1) loans identified for purchase; 2) number of loan sellers; 3) securitization volume; and 4) retained investments created from our Sequoia securitizations.
We completed two securitizations totaling $622 million in the fourth quarter of 2012, as compared to one securitization of $313 million in the third quarter of 2012. Our volume of loans identified for purchase grew to $2.2 billion in the fourth quarter of 2012, up from $1.1 billion in the third quarter of 2012, as a result of increased volume from both new and existing sellers driven by low mortgage rates. We added 13 active sellers in the fourth quarter to increase the total to 62 at December 31, 2012. Growth in the number of sellers is expected to slow in 2013 as we refine our targeted seller base. We note that it is not simply the number of sellers that drives our acquisition volume, but the quantity of loans we acquire from each of these sellers.
| 12 | THE REDWOOD REVIEW | 4TH QUARTER 2012 |
|
|
| |
|
QUARTERLY OVERVIEW
|
The table below illustrates the number of sellers and the volume of loans identified for purchase during the quarter through our flow-based loan platform (and does not include loans identified for purchase in bulk transactions).
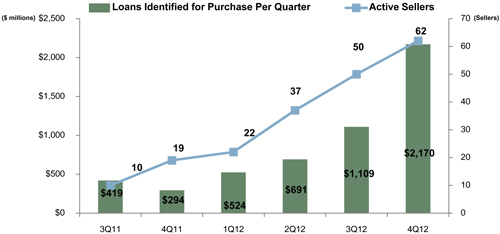
Our sellers are located throughout the U.S. Currently, they consist of 31 regional and community banks (or their subsidiaries) and 31 mortgage companies. We have consistently offered these sellers competitive pricing on 15- and 30-year jumbo fixed-rate mortgages. Sellers can address their interest rate exposure by selling loans they originate to us, a non-bank counterparty, without the concern that we will turn around and become a direct competitor for their retail borrower relationships.
Our fourth quarter 2012 loan acquisitions totaled $789 million, up from $524 million in the prior quarter, and at December 31, 2012 we had $561 million of loans held for future sale or securitization on our balance sheet. At December 31, 2012, our pipeline of loans identified for purchase totaled $2.3 billion. In January 2013, we completed two additional Sequoia securitizations totaling $1.1 billion and identified an additional $952 million of loans for purchase, our largest monthly total since we commenced the program in 2010. At February 15, 2013, our pipeline of residential loans identified for purchase totaled $2.0 billion. We expect to complete three to four securitizations during the first quarter of 2013.
We have yet to see significant margin compression in our residential business, which we attribute largely to sustained refinance volume and a strengthening economy. Our refinance volume continues to remain in line with the market (the Mortgage Bankers Association estimates that 75% of fourth quarter mortgage originations were refinancing transactions). Since a high percentage of the loans being originated in the market today are interest-rate driven refinancings, it will be more difficult for the market to grow and for margins to remain elevated if mortgage rates rise significantly, despite recent declines in unemployment and increased home purchase activity. While we are mindful of a likely reduction in loan refinance activity to the extent that interest rates begin to rise, our plan to sustain or grow our loan volume and market share in 2013 and beyond entails: 1) adding additional sellers in 2013 and beyond; 2) expanding the types of loan products we acquire from sellers; and 3) enhancing our infrastructure to further accommodate growth.
At the end of the fourth quarter of 2012, we owned mortgage servicing rights (“MSRs”) on $1 billion of prime-quality jumbo residential loans acquired through our platform. Approximately half of the portfolio was acquired in the fourth quarter of 2012. The capitalized value of these MSRs was $5.3 million, or 52 basis points of the principal amount of the associated mortgage loans. We earn fees from these MSRs, but outsource the actual servicing. We expect servicing fees to increase over time and become an increasing contributor to earnings.
| THE REDWOOD REVIEW | 4TH QUARTER 2012 | 13 |
|
|
| |
|
QUARTERLY OVERVIEW
|
Commercial Mortgage Banking Activities
We continued to make steady progress with our commercial platform activities in the fourth quarter of 2012. In late November 2012, we completed a $291 million securitization of our mezzanine investment portfolio, the first of its kind (with multiple collateral property types) in the post-financial crisis period. The securitization provided us with permanent non-recourse financing for 59% of the portfolio, freed up $168 million of cash for additional investment, and increased the yield on our retained subordinate investment to a more attractive level. For accounting purposes, the securitization is treated as a financing and the loans remain on our balance sheet as “commercial real estate loans” with the related debt shown within “asset-backed securities issued – Redwood.”
Our senior loan origination initiative began to gain traction in the fourth quarter of 2012. We originated two senior commercial loans in the fourth quarter totaling $24 million that also provided $4 million of mezzanine loans for our investment portfolio. We sold the senior loan balance of one of those loans plus an additional $37 million senior loan we originated in the third quarter to CMBS conduits, and recorded income of $1 million from those sales. We expect to sell the other senior loan and others we originate in subsequent quarters to CMBS conduits and generate additional income from these sales. Our origination and sale of senior loans will increase the returns from our commercial activities. Since year-end 2012 and through February 15, 2013, we originated seven senior commercial loans totaling $135 million and at February 15, 2013, we had four senior commercial loans for $73 million in application.
In the fourth quarter of 2012, we funded four mezzanine loans totaling $21 million, which increased our full year originations to 21 loans totaling $156 million. At December 31, 2012, our commercial loan portfolio consisted of 35 investments totaling $305 million (excluding an $8.5 million senior loan). The gross yield on the mezzanine portfolio was just over 10% and was funded through a combination of the November 2012 securitization we completed (56%) and equity (44%). While we expect mezzanine loan origination opportunities to wane over time, we still expect to find attractive opportunities in 2013 and through February 15, 2013, we have originated five mezzanine loans totaling $26 million. As we have noted previously, we are targeting to allocate up to $300 million of equity capital to fund our commercial investments, although it is possible that this allocation could exceed that amount from time to time in anticipation of asset sales or other transactions.
Capital
At December 31, 2012, we estimate our investment capacity (defined as the amount of capital we have readily available for long-term investments) at approximately $130 million, which should sustain our capital needs through the first quarter. To carry out our plans for investment in future Sequoia securitizations, mortgage servicing rights, and other business initiatives, we expect to need more capital during 2013. As a result, we are considering raising capital from external sources, such as through a debt or equity offering. We also continue to maintain the option of raising capital through “just in time” common stock issuances through our Direct Stock Purchase Plan. Our approach to raising capital will continue to be based on what we believe to be in the best long-term interest of shareholders.
| 14 | THE REDWOOD REVIEW | 4TH QUARTER 2012 |
|
|

| |
|
FINANCIAL INSIGHTS
|
Balance Sheet
| u | The following table shows the components of our balance sheet at December 31, 2012. |
|
Consolidating Balance Sheet |
| |||||||||||
| December 31, 2012 | ||||||||||||
| ($ in millions)
|
| |||||||||||
| At Redwood |
Consolidated Entities |
Redwood Consolidated |
||||||||||
| Residential loans |
$ | 563 | $ | 2,273 | $ | 2,835 | ||||||
| Commercial loans |
313 | - | 313 | |||||||||
| Real estate securities - Third party |
985 | - | 985 | |||||||||
| Real estate securities - Sequoia |
124 | - | 124 | |||||||||
| Cash and cash equivalents |
81 | - | 81 | |||||||||
| Total earning assets |
2,066 | 2,273 | 4,338 | |||||||||
| Other assets
|
|
94
|
|
|
12
|
|
|
106
|
| |||
| Total assets |
$ | 2,159 | $ | 2,285 | $ | 4,444 | ||||||
| Short-term debt |
$ | 552 | $ | - | $ | 552 | ||||||
| Other liabilities |
80 | 2 | 83 | |||||||||
| Asset-backed securities issued |
336 | 2,193 | 2,530 | |||||||||
| Long-term debt |
140 | - | 140 | |||||||||
| Total liabilities |
1,108 | 2,196 | 3,304 | |||||||||
| Stockholders’ equity
|
|
1,051
|
|
|
89
|
|
|
1,140
|
| |||
| Total liabilities and equity |
$ | 2,159 | $ | 2,285 | $ | 4,444 | ||||||
| u | We present this table to highlight the impact that the consolidated Sequoia entities had on our GAAP balance sheet at December 31, 2012. As shown, Redwood’s $89 million investment in these consolidated entities increased our consolidated assets by $2.3 billion and liabilities by $2.2 billion. |
| u | During the fourth quarter of 2012, we deconsolidated nine Acacia securitization entities and ten Sequoia securitization entities. The net effect of these transactions on our balance sheet was the derecognition of $933 million of assets and $948 million of liabilities owned at these entities, after giving effect to all other accounting entries, and the reclassification of $11 million of unrealized losses on hedging from stockholders’ equity to the income statement. The net effect was an increase to stockholders’ equity of $4 million. |
| u | We are required under GAAP to consolidate the assets and liabilities of certain Sequoia securitizations that are treated as secured borrowing transactions. However, the securitized assets of these entities are not legally ours and we own only the securities and interests that we acquired from these securitization entities. Similarly, the liabilities of these entities are obligations payable only from the cash flow generated by their securitized assets and are not obligations of Redwood. |
| u | All of the consolidated Sequoia securitizations were transactions that were completed before 2012. The six securitizations that we completed during 2012 were accounted for as sales of assets under GAAP. As a result, these securitizations were not consolidated and are not reflected in Consolidated Entities. The $124 million of securities we retained (net of sales) from the six securitizations we completed during 2012 are reflected on our balance sheet in Real Estate Securities — Sequoia. |
| u | Included in the “At Redwood” column of the consolidating balance sheet are the assets and liabilities of the residential resecuritization we completed during the third quarter of 2011, although these assets and liabilities are owned by the resecuritization entity and are legally not ours and we own only |
| THE REDWOOD REVIEW | 4TH QUARTER 2012 | 15 |
|
|
| |
|
FINANCIAL INSIGHTS
|
Balance Sheet (continued)
the securities and interests that we acquired from the resecuritization entity. At December 31, 2012, this resecuritization accounted for $326 million of assets ($325 million of available-for-sale securities at fair value and $1 million of other assets) and $165 million of asset-backed securities issued (at historical cost). Our $161 million investment in this resecuritization, as estimated for GAAP, equals the difference between these assets and liabilities. Management’s estimate of the non-GAAP economic value of our investment in the resecuritization was $154 million. To determine this estimate of non-GAAP economic value, we used the same valuation process that we follow to fair value our other real estate securities as described in the Accounting Discussion in the Appendix.
| u | Also included in the “At Redwood” column are the assets and liabilities of the commercial loan securitization that we completed in the fourth quarter of 2012. These assets and liabilities are owned by the securitization entity and are legally not ours and we own only the securities and interests that we acquired from the securitization entity. At December 31, 2012, this securitization accounted for $290 million of assets ($284 million of commercial real estate loans at historical cost and $6 million of other assets) and $172 million of asset-backed securities issued (at historical cost). Our $118 million investment in this securitization, as estimated for GAAP, equals the difference between these assets and liabilities. Management’s estimate of the non-GAAP economic value of our investment in the commercial loan securitization was $119 million. To determine this estimate of non-GAAP economic value, we used the same valuation process that we follow to fair value our other real estate securities as described in the Accounting Discussion in the Appendix. |
Real Estate Loans
| u | At December 31, 2012, at Redwood, we had $563 million of unsecuritized residential real estate loans, as compared to $418 million at September 30, 2012. The increase reflects $789 million of residential loan acquisitions and $23 million of fair value increases, less $2 million of principal payments, $14 million of whole loan sales, and $651 million of sales into the October and November 2012 Sequoia securitizations. Most of our unsecuritized residential real estate loans (and others we have identified for future acquisition) are being held for future securitizations. See the Sequoia Residential Mortgage Loan Business section on page 28 for more information. |
| u | At December 31, 2012, at Redwood, we had $313 million of commercial loans (including $29 million of unsecuritized loans and $284 million of securitized loans), as compared to $286 million at September 30, 2012. The change reflects the origination of six loans totaling $44 million, the sale of one loan for $15 million, and $2 million of loan loss provisions. As noted above, $284 million of the commercial loans have been securitized in a structured financing transaction. See the Commercial Real Estate Business section that begins on page 32 for more information. |
| 16 | THE REDWOOD REVIEW | 4TH QUARTER 2012 |
|
|
| |
|
FINANCIAL INSIGHTS
|
Balance Sheet (continued)
Real Estate Securities
| u | The following table presents the fair value of real estate securities at Redwood at December 31, 2012. We segment our securities portfolio by vintage (the year(s) the securities were issued), priority of cash flow (senior, re-REMIC, and subordinate), and by the quality of underlying loans (prime and non-prime). |
|
Real Estate Securities at Redwood (1) |
||||||||||||||||||||||||
| December 31, 2012 | ||||||||||||||||||||||||
| ($ in millions) | ||||||||||||||||||||||||
| % of Total | ||||||||||||||||||||||||
| <=2004 | 2005 | 2006-2008 | 2012 (4) | Total | Securities | |||||||||||||||||||
| Residential |
||||||||||||||||||||||||
| Seniors |
||||||||||||||||||||||||
| Prime |
$ | 22 | $ | 190 | $ | 255 | $ | 10 | $ | 477 | 43 | % | ||||||||||||
| Non-prime (3) |
99 | 162 | 6 | - | 267 | 24 | % | |||||||||||||||||
| Total Seniors |
$ | 121 | $ | 352 | $ | 261 | $ | 10 | $ | 744 | 67 | % | ||||||||||||
| Total Re-REMIC |
$ | - | $ | 67 | $ | 96 | $ | - | $ | 163 | 15 | % | ||||||||||||
| Subordinates |
||||||||||||||||||||||||
| Prime |
$ | 56 | $ | 13 | $ | 2 | $ | 114 | $ | 185 | 17 | % | ||||||||||||
| Non-prime (3) |
2 | 1 | - | - | 3 | 0 | % (2) | |||||||||||||||||
| Total Subordinates |
$ | 58 | $ | 14 | $ | 2 | $ | 114 | $ | 188 | 17 | % | ||||||||||||
| Total Residential |
$ | 179 | $ | 433 | $ | 359 | $ | 124 | $ | 1,095 | 99 | % | ||||||||||||
| Commercial subordinates
|
$
|
14
|
|
$
|
-
|
|
$
|
-
|
|
$
|
-
|
|
$
|
14
|
|
|
1
|
%
| ||||||
| Total real estate securities |
$ | 193 | $ | 433 | $ | 359 | $ | 124 | $ | 1,109 | 100 | % | ||||||||||||
(1) Included in the residential securities table above are $325 million of senior securities that are included in a resecuritization that we completed in July 2011. Under GAAP accounting, we account for the resecuritization as a financing even though these securities are owned by the resecuritization entity and are legally not ours. We own only the securities and interests that we acquired from the resecuritization entity, which amounted to $145 million at December 31, 2012. As a result, to adjust at December 31, 2012 for the legal and economic interests that resulted from the resecuritization, Total Residential Senior Securities would be decreased by $325 million to $419 million, Total Re-REMIC Residential Securities would be increased by $145 million to $308 million, and Total Residential Securities would be reduced by $180 million to $915 million.
(2) The fair value of these securities are less than 1% of the fair value of the total securities.
(3) Non-prime residential securities consist of $268 million of Alt-A senior and subordinate securities and $2 million of subprime subordinate securities.
(4) All of the securities from the 2012 vintage are from our Sequoia securitizations.
| u | The table below details the change in fair value of securities at Redwood during the fourth and third quarters of 2012. |
|
Real Estate Securities at Redwood |
| |||||||
| ($ in millions)
|
| |||||||
| Three Months Ended | ||||||||
| 12/31/12 | 9/30/12 | |||||||
| Beginning fair value |
$ | 1,069 | $ | 1,057 | ||||
| Acquisitions (1) |
42 | 56 | ||||||
| Sales (1) |
(20 | ) | (62 | ) | ||||
| Gain on sale |
5 | 14 | ||||||
| Effect of principal payments |
(33 | ) | (33 | ) | ||||
| Change in fair value, net | 46 | 37 | ||||||
| Ending fair value |
$ | 1,109 | $ | 1,069 | ||||
(1) Included in the acquisitions and sales totals are investments in and sales of investments in Sequoia Entities. For detailed information on these acquisitions and sales, see Cash Flow discussion on pages 26 and 27.
| THE REDWOOD REVIEW | 4TH QUARTER 2012 | 17 |
|
|
| |
|
FINANCIAL INSIGHTS
|
Balance Sheet (continued)
| u | Our acquisitions in the fourth quarter included $42 million of prime subordinate securities that were retained from our fourth quarter Sequoia securitizations. During the fourth quarter, we did not acquire any securities issued by third parties. |
Investments in Consolidated Entities
| u | Our investments in Consolidated Entities, as estimated for GAAP, totaled $89 million at December 31, 2012. This amount reflects the estimated book value of our retained investments in Sequoia entities based on the difference between the consolidated assets and liabilities of the entities in the aggregate according to their GAAP carrying amounts. Management’s estimate of the non-GAAP economic value of our investments in consolidated Sequoia entities was $90 million. To determine this estimate of non-GAAP economic value, we used the same valuation process that we follow to fair value our other real estate securities as described in the Accounting Discussion in the Appendix. |
Debt
| u | At December 31, 2012, we had short-term mortgage warehouse debt outstanding of $180 million, which was used to finance a portion of our $561 million inventory of residential mortgage loans held for future securitization or sale. At December 31, 2012, we had four uncommitted residential mortgage warehouse facilities with an aggregate borrowing capacity of $800 million. We also had a $150 million commercial warehouse facility, of which $100 million was committed. |
| u | At December 31, 2012, we had short-term debt incurred through securities repurchase facilities of $372 million secured by $480 million of our RMBS at market value, resulting in a debt-to-equity leverage ratio for these RMBS of 3.4x (excluding the additional amount of cash we set aside and designate as a liquidity capital cushion related to these short-term borrowings). |
| u | At December 31, 2012, we had $165 million outstanding of non-recourse, asset-backed debt issued at a stated interest rate of one-month LIBOR plus 200 basis points related to our resecuritization of senior securities. We also had $172 million outstanding of non-recourse, asset-backed debt issued at a stated interest rate of 5.62% (excluding deferred issuance costs) related to our securitization of commercial loans. |
| u | At December 31, 2012, we had $140 million of long-term debt outstanding due in 2037 with a stated interest rate of three-month LIBOR plus 225 basis points. In 2010, we effectively fixed the interest rate on this long-term debt at a rate of approximately 6.75% (excluding deferred debt issuance costs) through interest rate swaps. Although we report our long-term debt in accordance with GAAP based on its $140 million historical cost, we estimate the non-GAAP economic value of this debt at $91 million based on its stated interest rate using the same valuation process used to fair value our other financial assets and liabilities. |
Capital and Cash
| u | At December 31, 2012, our total capital was $1.3 billion, including $1.1 billion of shareholders’ equity and $140 million of long-term debt. We use our capital to invest in earning assets, meet lender capital requirements, and to fund our operations and working capital needs. |
| 18 | THE REDWOOD REVIEW | 4TH QUARTER 2012 |
|
|
| |
|
FINANCIAL INSIGHTS
|
Capital and Cash (continued)
| u | During the fourth quarter, we did not issue common stock through the optional cash purchase feature of our Direct Stock Purchase and Dividend Reinvestment Plan. We did issue $2 million of common stock through the dividend reinvestment feature of this Plan. |
| u | Our cash balance was $81 million at December 31, 2012. We hold cash for two main reasons. First, we hold cash in an amount we believe will be sufficient to manage our liquidity. For example, we hold cash to maintain compliance with certain debt covenants to meet potential margin calls, and to cover cash operating expenses. Second, we hold cash in anticipation of new investment opportunities. |
| u | We estimate that our investment capacity was approximately $130 million at December 31, 2012. |
GAAP Income
| u | The following table provides a summary of our consolidated GAAP income for the fourth and third quarters of 2012. |
|
GAAP Income |
| |||||||
| ($ in millions, except per share data)
|
| |||||||
| Three Months Ended | ||||||||
| 12/31/12 | 9/30/12 | |||||||
| Interest income | $ | 53 | $ | 60 | ||||
| Interest expense | (33 | ) | (28 | ) | ||||
| Net interest income | 20 | 31 | ||||||
| Provision for loan losses | (3 | ) | (1 | ) | ||||
| Other market valuation adjustments, net | (1 | ) | (3 | ) | ||||
| Net interest income after provision and other market valuation adjustments | 16 | 27 | ||||||
| Mortgage banking activities, net | 24 | 17 | ||||||
| Operating expenses | (18 | ) | (17 | ) | ||||
| Realized gains, net | 20 | 14 | ||||||
| Provision for income taxes | - | (1 | ) | |||||
| GAAP income | $ | 42 | $ | 40 | ||||
| GAAP income per share | $ | 0.50 | $ | 0.48 | ||||
| u | Our consolidated GAAP net income for the fourth quarter of 2012 was $42 million, or $0.50 per share, as compared to $40 million, or $0.48 per share, for the third quarter of 2012. The $2 million increase resulted from higher mortgage banking income and realized gains. These increases were partially offset by a decrease in interest income at consolidated entities of $6 million as a result of declining average earning assets at these entities as assets continue to paydown or be derecognized through the deconsolidation of legacy securitization entities, and to a lesser extent lower realized yields on consolidated Sequoia loans due to declining benchmark interest rates during the quarter. In addition, we also recognized a moderately higher loan loss provision and higher operating expenses during the fourth quarter as compared to the third quarter. As detailed in the Quarterly Overview section beginning on page 9, net interest income was affected by a one-time $11 million interest expense adjustment related to the deconsolidation of certain securitization entities. |
| THE REDWOOD REVIEW | 4TH QUARTER 2012 | 19 |
|
|
| |
|
FINANCIAL INSIGHTS
|
GAAP Income (continued)
| u | The following tables show the estimated effect that Redwood and our Consolidated Entities had on GAAP income for the fourth and third quarters of 2012. |
|
Consolidating Income Statement |
| |||||||||||
| Three Months Ended December 31, 2012 | ||||||||||||
| ($ in millions)
|
| |||||||||||
| At Redwood |
Consolidated Entities |
Redwood Consolidated |
||||||||||
| Interest income | $ | 27 | $ | 19 | $ | 46 | ||||||
| Net discount (premium) amortization | 9 | (2 | ) | 7 | ||||||||
| Total interest income | 36 | 17 | 53 | |||||||||
| Interest expense | (7 | ) | (26 | ) | (33 | ) | ||||||
| Net interest income (expense) | 29 | (8 | ) | 20 | ||||||||
| Provision for loan losses | (2 | ) | (1 | ) | (3 | ) | ||||||
| Other market valuation adjustments, net | (4 | ) | 3 | (1 | ) | |||||||
| Net interest income (loss) after provision and other market valuation adjustments | 23 | (6 | ) | 16 | ||||||||
| Mortgage banking activities, net | 24 | - | 24 | |||||||||
| Operating expenses | (18 | ) | - | (18 | ) | |||||||
| Realized gains, net | 5 | 15 | 20 | |||||||||
| Provision for income taxes | - | - | - | |||||||||
| Net income | $ | 34 | $ | 9 | $ | 42 | ||||||
|
Consolidating Income Statement |
| |||||||||||
| Three Months Ended September 30, 2012 | ||||||||||||
| ($ in millions)
|
| |||||||||||
| At Redwood |
Consolidated Entities |
Redwood Consolidated |
||||||||||
| Interest income | $ | 29 | $ | 25 | $ | 54 | ||||||
| Net discount (premium) amortization | 7 | (2 | ) | 6 | ||||||||
| Total interest income | 36 | 23 | 60 | |||||||||
| Interest expense | (6 | ) | (22 | ) | (28 | ) | ||||||
| Net interest income | 30 | 1 | 31 | |||||||||
| Provision for loan losses | (1 | ) | (1 | ) | (1 | ) | ||||||
| Other market valuation adjustments, net | (6 | ) | 2 | (3 | ) | |||||||
| Net interest income after provision and other market valuation adjustments | 24 | 3 | 27 | |||||||||
| Mortgage banking activities, net | 17 | - | 17 | |||||||||
| Operating expenses | (17 | ) | - | (17 | ) | |||||||
| Realized gains, net | 14 | - | 14 | |||||||||
| Provision for income taxes | (1 | ) | - | (1 | ) | |||||||
| Net income | $ | 37 | $ | 3 | $ | 40 | ||||||
| 20 | THE REDWOOD REVIEW | 4TH QUARTER 2012 |
|
|
| |
|
FINANCIAL INSIGHTS
|

GAAP Income (continued)
Redwood Parent
| u | Total interest income from our securities portfolio and our residential and commercial loans totaled $36 million in the fourth quarter of 2012, consistent with the third quarter of 2012. |
| u | Interest income from our securities portfolio was $24 million for the fourth quarter of 2012, a decline of $1 million from the third quarter of 2012, as higher yielding third-party securities purchased over the last few years paid down and were replaced with lower yielding new issue securities created from our Sequoia securitization program. |
| u | Interest income from residential loans was $4 million during the fourth quarter of 2012, a slight decrease from the third quarter of 2012, as the average balance of loans on our balance sheet declined 10% to $419 million, reflecting the increased pace of purchase and sale activity. These loans are financed at Redwood prior to either being securitized through our Sequoia program or sold as whole loans. The amount of interest earned at Redwood is dependent upon prevailing mortgage rates and the amount of time they are held on our balance sheet ahead of an anticipated sale. |
| u | Commercial loans generated $8 million of interest income in the fourth quarter of 2012, an increase from $7 million in the third quarter of 2012, as the average portfolio increased by 14% to $304 million from the prior quarter. New mezzanine loan investments totaled $21 million in the fourth quarter of 2012, increasing the portfolio to $305 million at December 31, 2012. We also originated two senior commercial loans totaling $24 million and during the fourth quarter subsequently sold one of these loans (and we expect to sell the other in the first quarter of 2013) and a previously originated loan generating a gain of $1 million. |
| u | Interest expense was $7 million in the fourth quarter, an increase from $6 million in the third quarter of 2012, primarily as a result of the issuance of $172 million of ABS-issued debt related to our securitization of most of our commercial mezzanine loan portfolio during the quarter. Our debt at Redwood at December 31, 2012 consisted of $140 million of long-term debt at an effective cost of 6.88% per annum, ABS-issued debt related to our resecuritization of certain senior residential securities at an effective cost of 2.56% per annum, ABS-issued debt related to our securitization of certain commercial loans at an effective cost of 6.93% per annum, and short-term securities repurchase and mortgage warehouse related debt at a cost of approximately 1.87% per annum. |
| u | Net negative market valuation adjustments on securities and derivatives were $4 million in the fourth quarter of 2012, a decrease of $2 million from the third quarter of 2012. These valuation decreases were primarily a result of lower market valuations on IO securities retained from recent Sequoia securitizations. These IOs have declined in value due to an increase in prepayment expectations over the past three quarters. These IOs help us manage risks associated with our residential loan pipeline and consequently reduce the amount of risk management derivatives we may otherwise use to manage our residential loan pipeline. |
| THE REDWOOD REVIEW | 4TH QUARTER 2012 | 21 |
|
|
| |
|
FINANCIAL INSIGHTS
|
GAAP Income (continued)
Redwood Parent (continued)
| u | The following table presents the components of mortgage banking activities for the fourth and third quarters of 2012. |
|
Mortgage Banking Activities |
| |||||||
| ($ in millions, except per share data)
|
| |||||||
| Three Months Ended | ||||||||
| 12/31/12 | 9/30/12 | |||||||
| Net gains on residential mortgage loan sales and securitizations |
$ | 2 | $ | 5 | ||||
| Net gains on commercial mortgage loan sales |
1 | - | ||||||
| Net valuation gains on residential loans |
23 | 15 | ||||||
| Net valuation losses from economic hedges |
(2 | ) | (2 | ) | ||||
| Net valuation losses from MSRs |
(1 | ) | (1 | ) | ||||
| Total mortgage banking activities, net | $ | 24 | $ | 17 | ||||
| u | Income from mortgage banking activities was $24 million in the fourth quarter of 2012, as compared to $17 million in the third quarter of 2012. This increase resulted from an increase in residential loan acquisition volume combined with rising values for loans we held on our balance sheet for securitizations during the fourth quarter, primarily due to strong demand for AAA-rated securities backed by these types of loans. In the third quarter of 2012, we began marking these loans to market through our income statement. This accounting change has helped to further align our reported results with the economics underlying our residential loan business. Consequently, we expect gains (or losses) on the sale of residential loans during subsequent reporting periods to be smaller, all else equal, as their cost basis at the end of each quarter will already reflect the price at which we believe they could be sold. |
| u | Income from mortgage banking activities included $3 million in gains from the sale of $681 million of loans through securitization and whole loan sales. Gains on the sale of loans primarily reflect price increases for those loans held on our balance sheet subsequent to their September 30, 2012, valuations, as well as increases in the value of loans acquired during the fourth quarter of 2012. These gains were partially offset by hedging expenses of $2 million. |
| u | During the fourth quarter of 2012, we recognized $5 million of gains from the sale of securities, as compared to $14 million recognized in the third quarter of 2012. These gains were realized as a result of the ongoing management of our securities portfolio. Since future sale activity is uncertain, future gains or losses may be volatile. |
| u | Operating expenses at Redwood increased $1 million to $18 million in the fourth quarter, as compared to $17 million in the third quarter, largely due to higher non-compensation expenses attributable to our expanding operations. |
| 22 | THE REDWOOD REVIEW | 4TH QUARTER 2012 |
|
|
| |
|
FINANCIAL INSIGHTS
|
Consolidated Entities
| u | During the fourth quarter of 2012, we deconsolidated nine Acacia securitization entities and ten Sequoia entities. The net effect of these transactions was a derecognition of $933 million of assets and $948 million of liabilities, and after giving effect to all other accounting entries, resulted in a $4 million net, non-recurring increase to fourth quarter earnings. |
| u | We recognized net income of $9 million for the fourth quarter from our investments in Legacy Sequoia and Acacia securitization entities, as compared to net income of $3 million for the previous quarter. This increase is primarily attributable to the $4 million net, non-recurring increase to earnings recognized upon deconsolidation of certain securitization entities. This increase was partially offset by declining interest income as average earning assets at these entities continue to paydown or be derecognized. |
| u | Our allowance for loan losses at legacy Sequoia entities was $29 million at December 31, 2012, as compared to $54 million at September 30, 2012. During the fourth quarter, we derecognized $22 million of allowance for loan losses upon the deconsolidation of certain Sequoia entities. While our overall credit reserving needs continue to remain flat or decline largely due to improvements in housing, we booked $1 million of provision expense during the fourth quarter of 2012 to replenish the reserve after recording $4 million of charge-offs during the quarter. These charge-offs relate to existing delinquent loans that have transitioned towards short-sale or foreclosure status, as opposed to an uptrend in new delinquencies. |
| u | There is currently one Sequoia entity for which we have aggregate loan-loss reserves of less than $1 million in excess of our reported investment for GAAP purposes, an amount we expect to recover in future periods. |
| u | In subsequent quarters, the consolidated entities we discuss in this section of the Redwood Review will only represent Sequoia securitization transactions that were accounted for as secured borrowings, which currently consist of pre-2012 securitizations. |
| THE REDWOOD REVIEW | 4TH QUARTER 2012 | 23 |
|
|
| |
|
FINANCIAL INSIGHTS
|
REIT Taxable Income and Dividends
Summary
As a REIT, Redwood is required to distribute to shareholders at least 90% of its REIT taxable income (and meet certain other requirements), although Redwood’s Board of Directors can declare dividends in excess of this minimum requirement. REIT taxable income is defined as income as calculated for tax that is earned at Redwood and its qualified REIT subsidiaries. Redwood also earns taxable income at its taxable subsidiaries, which it is not required to distribute. To the extent Redwood retains taxable income that is not distributed to shareholders, it is taxed at corporate tax rates. A reconciliation of GAAP and taxable income is set forth in Table 2 in the Financial Tables in this Review.
Overview
| u | Our REIT taxable income continues to remain volatile and has not been the primary driver of our dividend for the past few years. In addition to REIT taxable income, the Board of Directors has considered other factors when establishing our dividend policy, including cash flow, liquidity, and GAAP earnings. On November 13, 2012, the Board of Directors declared a regular dividend of $0.25 per share for the fourth quarter, which was paid on December 27, 2012, to shareholders of record on December 14, 2012. Also in November 2012, the Board of Directors announced its intention to increase the regular dividend to $0.28 per share per quarter in 2013. On February 20, 2013, the Board of Directors authorized the declaration of a first quarter regular dividend of $0.28 per share, payable on March 29, 2013, to shareholders of record on March 15, 2013. |
| u | Under federal income tax rules, our dividend distributions will be taxed at the shareholder level based on our 2012 tax results before application of any loss carryforwards. Therefore, Redwood’s 2012 dividend distributions are expected to be characterized for income tax purposes as 77% ordinary income and 23% return of capital. None of Redwood’s 2012 dividend distributions are expected to be characterized for federal income tax purposes as long-term capital gain. |
| u | The portion of Redwood’s dividend distributions characterized as ordinary income under applicable federal income tax rules are generally taxed at full ordinary income tax rates. The portion of Redwood’s dividend distributions characterized as a return of capital are not generally taxable (provided it does not exceed a shareholder’s tax basis in its Redwood shares), and it reduces a shareholder’s basis for shares held at each quarterly distribution date. Shareholders should consult their tax advisors to determine the amount of taxes that should be paid on Redwood’s dividend distributions for federal, state, and other income tax purposes. |
| u | Our estimate of REIT taxable income for the fourth quarter of 2012 was $18 million, or $0.23 per share, as compared to $15 million, or $0.19 per share, for the third quarter of 2012. Our estimate of REIT taxable income for 2012 was $62 million, or $0.77 per share, as compared to REIT taxable income of $20 million, or $0.24 per share, for 2011. Our estimated 2012 tax results are used in part to determine the taxability of our 2012 dividends at the shareholder level. Additional details on our tax results can be found in the Financial Tables in the Appendix of this Redwood Review. |
| u | For the year ended December 31, 2012, we realized net capital losses of $203 million at the REIT for tax purposes. These losses were due mostly to the sale of our investments in Acacia entities already expensed for GAAP in prior years. Net capital losses generated in 2012 by the REIT have no effect on the taxability of our dividend. However, if the REIT had generated realized net capital gains for the entire tax year, those gains would increase the portion of our dividend that is characterized as ordinary income to our shareholders. |
| 24 | THE REDWOOD REVIEW | 4TH QUARTER 2012 |
|
|
| |
|
FINANCIAL INSIGHTS
|
REIT Taxable Income and Dividends (continued)
| u | Our REIT taxable income will likely continue to vary from period to period due to the timing of realized credit losses from legacy investments. Our estimated fourth quarter and 2012 full-year tax results include the effects of $4 million and $26 million of credit losses respectively, driven by losses on legacy investments. Based on the securities we currently own, we expect an additional $111 million of credit losses to be realized over an estimated three- to five-year period for tax purposes. This amount is down from $138 million at year-end 2011 and $208 million at year-end 2010. Given the significant (but declining) impact of legacy losses on our current period taxable income, our GAAP results – which have already provisioned for these losses in prior periods – will likely continue to outpace our tax results and be more reflective of current performance trends. |
| u | Redwood’s estimated total taxable income, defined as the sum of REIT taxable income plus the taxable income at our taxable REIT subsidiaries, was $13 million, or $0.16 per share, in the fourth quarter of 2012, as compared to estimated taxable income of $17 million, or $0.21 per share, in the third quarter of 2012. For 2012, our taxable REIT subsidiaries as a group did not generate taxable income. However, we recorded a tax provision for GAAP at the taxable REIT subsidiary level in the fourth quarter for tax we expect to pay on excess inclusion income from certain Sequoia securitization entities completed since 2010. This excess inclusion income was not earned at the REIT for tax purposes and no portion of our 2012 dividends will be characterized as excess inclusion income as a result of this Sequoia-related taxable income. |
| THE REDWOOD REVIEW | 4TH QUARTER 2012 | 25 |
|
|
| |
|
FINANCIAL INSIGHTS
|
Cash Flow
| u | The sources and uses of cash in the table below are derived from our GAAP Consolidated Statements of Cash Flow for the fourth and third quarters of 2012, aggregating and netting all items in a manner consistent with the way management analyzes them. This table excludes the gross cash flow generated by our Sequoia and Acacia securitization entities (cash flow that is not available to Redwood), but does include the cash flow distributed to Redwood as a result of our investments in these entities. The beginning and ending cash balances presented in the table below are GAAP amounts. |
|
Redwood Sources and Uses of Cash |
| |||||||
| ($ in millions)
|
| |||||||
| Three Months Ended | ||||||||
| 12/31/12 | 9/30/12 | |||||||
| Beginning cash balance | $ | 39 | $ | 70 | ||||
| Business cash flow (1) | ||||||||
| Loans, securities, and investments (2) |
61 | 66 | ||||||
| Operating expenses |
(12 | ) | (11 | ) | ||||
| Interest expense on other borrowed funds (3) |
(5 | ) | (5 | ) | ||||
| Dividends |
(20 | ) | (20 | ) | ||||
| Net business cash flow | 24 | 30 | ||||||
| Investment-related cash flow | ||||||||
| Acquisition of residential loans |
(789 | ) | (524 | ) | ||||
| Origination/acquisition of commercial debt investments |
(44 | ) | (40 | ) | ||||
| Acquisition of third-party securities (4) |
(21 | ) | (12 | ) | ||||
| Sale of third-party securities |
20 | 52 | ||||||
| Investments in Sequoia Entities, net (5) |
(34 | ) | (13 | ) | ||||
| Total investment-related cash flow |
(868 | ) | (537 | ) | ||||
| Financing and other cash flow | ||||||||
| Proceeds from residential loan sales |
681 | 376 | ||||||
| Proceeds from commercial securitization |
168 | - | ||||||
| Proceeds from repo debt, net |
7 | 5 | ||||||
| Proceeds from warehouse debt, net |
23 | 62 | ||||||
| Margin returned, net |
3 | 4 | ||||||
| Derivative pair-off/premiums paid |
(2 | ) | (3 | ) | ||||
| Share issuance |
2 | 30 | ||||||
| Changes in working capital |
4 | 2 | ||||||
| Net financing and other cash flow
|
|
886
|
|
|
476
|
| ||
| Ending cash balance | $ | 81 | $ | 39 | ||||
| (1) | Cash flow from securities and investments can be volatile from quarter to quarter depending on the level of invested capital, the timing of credit losses, acquisitions, sales, and changes in prepayments and interest rates. Therefore, (i) cash flow generated by these investments in a given period is not necessarily reflective of the long-term economic return we will earn on these investments; and (ii) it is difficult to determine what portion of the cash received from an investment is a return “of” principal and what portion is a return “on” principal in a given period. |
| (2) | Sources of cash from loans, securities, and investments includes the gross cash flow received from the securities that were included in the Residential Resecuritization, net of the principal and interest payments made in respect of the ABS issued in that Residential Resecuritization as well as the gross cash flow received from the commercial loans that were included in the Commercial Securitization, net of the principal and interest payments made in respect of the ABS issued in that Commercial Securitization. |
| (3) | Other borrowed funds consist of short-term repurchase and warehouse debt and long-term debt. |
| (4) | Total acquisitions of third-party securities in the third quarter of 2012 were $33 million. Securities acquisitions of $21 million made in the third quarter that settled in October are reflected in the fourth quarter under Acquisitions of third-party securities, net. There were no acquisitions of third-party securities in the fourth quarter of 2012. |
| (5) | Investments in Sequoia Entities, net during the fourth quarter of 2012 included $42 million of securities issued during the fourth quarter, and sales of $8 million of securities issued in previous years. Investments in Sequoia Entities, net during the third quarter of 2012 included $24 million of securities, of which $5 million were sold in the quarter. Also included in the third quarter of 2012 are sales of $6 million of investments made in the second quarter. |
| 26 | THE REDWOOD REVIEW | 4TH QUARTER 2012 |
|
|
| |
|
FINANCIAL INSIGHTS
|
Cash Flow (continued)
| u | Net business cash flow totaled $24 million in the fourth quarter, as compared to $30 million in the third quarter. Contributing to the decrease was a $5 million reduction in principal and interest payments from residential loans, securities, and investments as a result of lower average balances of residential loans and senior securities as sales and paydowns outpaced acquisitions. There was also a $1 million increase in operating expenses primarily reflecting an increase in legal and consulting expenses related to our continued business expansion. |
| u | The $61 million of cash flow in the fourth quarter of 2012 from our loans, securities, and investments exceeds the sum of our cash operating expenses of $12 million, interest expense on borrowed funds of $5 million, and dividends paid of $20 million. |
| u | Notable sources of cash in the fourth quarter of 2012 included $651 million from the proceeds of two Sequoia residential mortgage securitizations, $30 million from whole loan sales, $168 million from our commercial loan securitization, and $20 million from the sale of third-party securities. |
| u | A notable use of cash in the fourth quarter of 2012 was $789 million for the acquisition of residential loans, as compared to $524 million in the third quarter. (For the full year in 2012, cash used for residential loan acquisitions totaled $2.3 billion, up from $832 million in 2011.) |
| u | Other significant uses of cash in the fourth quarter of 2012 included $44 million for commercial loan investments and $42 million to acquire securities from Sequoia securitizations. Another $21 million was used to acquire third-party RMBS that settled in the fourth quarter but were purchased in the third quarter. |
| u | Cash flow from securities and investments can be volatile from quarter to quarter depending on the level of invested capital, the timing of credit losses, acquisitions, sales, and changes in prepayment rates and interest rates. |
| THE REDWOOD REVIEW | 4TH QUARTER 2012 | 27 |

|
| |
|
RESIDENTIAL MORTGAGE BANKING ACTIVITIES
|
Summary
We purchase newly originated loans (mainly prime jumbo loans) that meet our collateral criteria from third-party originators on a flow or bulk basis. Loans acquired through this process (our “conduit”) are expected to be securitized through Sequoia securitization entities, which acquire residential mortgage loans from our conduit and issue RMBS backed by these loans, or sold as whole loans. Most of the senior or investment-grade rated RMBS issued by Sequoia entities are sold to third-party investors. Redwood generally acquires the subordinate or non-investment grade securities but has also acquired senior securities and interest-only securities from the Sequoia entities.
Quarterly Update
| u | In the fourth quarter of 2012, we completed two residential prime jumbo securitizations totaling $621 million. Our investments in these fourth quarter securitizations were $42 million. |
| u | At December 31, 2012, we held $161 million (estimated economic value) of RMBS issued from the nine Sequoia securitizations we completed from April 2010 through December 2012. Included are $37 million of investments from the 2010 and 2011 Sequoia securitizations that we have consolidated and accounted for as financings under GAAP, and $124 million of investments we retained from the 2012 Sequoia securitizations that were accounted for as sales under GAAP. |
| u | At December 31, 2012, there were six 30-day delinquencies among the loans underlying these nine Sequoia securitizations, which were all current by January 31, 2013. These delinquencies were related to first payment servicing transfer issues. There have not been any 60-day delinquencies or credit losses related to these nine securitizations. |
| u | At December 31, 2012, residential loans purchased and held on our balance sheet for future securitizations or whole loan sales totaled $561 million, and the pipeline of residential loans we have identified for purchase totaled $2.3 billion. |
| u | At December 31, 2012, we had 62 active mortgage sellers, up from 49 at September 30, 2012, and 19 at December 31, 2011. |
| u | At February 15, 2013, residential loans purchased and held on our balance sheet for future securitization or sale totaled $992 million and the pipeline of residential loans we have identified for purchase totaled $2 billion. |
| u | We completed six securitizations totaling $1.97 billion in 2012, compared to two securitizations totaling $671 million in 2011, and one securitization of $238 million in 2010. Subsequent to December 31, 2012, we closed SEMT 2013-1, a $398 million securitization on January 15, 2013, and SEMT 2013- 2, a $666 million securitization on January 30, 2013. We anticipate closing up to four securitizations in the first quarter of 2013. Our goal is to acquire and securitize $7 billion of residential jumbo loans in 2013, assuming market conditions are favorable. |
| 28 | THE REDWOOD REVIEW | 4TH QUARTER 2012 |
|
|

| |
|
RESIDENTIAL REAL ESTATE SECURITIES
|
Summary
Redwood invests in securities that are backed by pools of residential loans. These investments in residential securities consist of senior prime and non-prime securities and non-senior securities. Residential prime securities are mortgage-backed securities backed by prime residential mortgage loans. Residential non-prime securities are mortgage-backed securities backed by non-prime (Alt-A, Option ARM, and Subprime) residential mortgage loans. Non-senior securities include subordinate and re-REMIC securities.
Senior securities are those interests in a securitization that have the first right to cash flows and are last in line to absorb losses. Subordinate securities are those interests in a securitization that have a more junior right to cash flows and are in line to absorb losses before the senior securities. A re-REMIC is a resecuritization of RMBS where the cash flow from and any credit losses absorbed by the underlying RMBS are allocated among the securities issued in the resecuritization transaction in a variety of ways.
The following discussion refers only to the residential securities owned by Redwood, which includes some securities issued in Sequoia securitization transactions, but excludes securities owned by Acacia entities and Redwood’s investments in Acacia.
This discussion includes the securities that we resecuritized during the third quarter of 2011, which are presented in our consolidated balance sheet.
Information on the residential securities we own and underlying loan characteristics is set forth in Tables 5 through 8B in the Appendix.
Quarterly Update
| u | Interest income generated by our residential securities was $24 million in the fourth quarter of 2012, resulting in an annualized unlevered yield of 10% on the $927 million average amortized cost of these securities. |
| u | At December 31, 2012, the fair value of the residential securities we own totaled $1.1 billion, consisting of $477 million in prime senior securities, $267 million in non-prime senior securities, $163 million of re-REMIC securities, and $188 million in subordinate securities. The amortized cost of our available-for-sale securities, which accounts for all but $33 million of securities held as trading securities, was 69% of face value and the fair value was 83% of face value at December 31, 2012. |
| u | We financed our holdings of residential securities with short-term debt secured by securities (repo debt), through the resecuritization transaction we completed during the third quarter of 2011 (resecuritization debt), and with equity capital. During the fourth quarter of 2012, average repo debt amounted to $377 million and the average resecuritization debt amounted to $169 million. |
| u | At December 31, 2012, 34% of the residential securities we held were fixed-rate assets, 24% were adjustable-rate assets, 28% were hybrid assets that reset within the next year, 10% were hybrid assets that reset between 12 and 36 months, and 4% were hybrid assets that reset after 36 months. We attempt to strike a balance in the composition of the portfolio between adjustable-rate securities that have lower interest-rate risk but lower yields, and fixed-rate securities that have higher interest-rate risk but higher yields. |
| THE REDWOOD REVIEW | 4TH QUARTER 2012 | 29 |
|
|
| |
|
RESIDENTIAL REAL ESTATE SECURITIES
|
Quarterly Update (continued)
| u | The following table presents information on residential securities at Redwood at December 31, 2012. For GAAP, we account for the large majority of these securities as available-for-sale (AFS) and others as trading securities, and in both cases the securities are reported at their fair value at the report date. |
|
Residential Securities at Redwood |
| |||||||||||||||||||
| December 31, 2012 | ||||||||||||||||||||
| ($ in millions)
|
| |||||||||||||||||||
| Senior | ||||||||||||||||||||
| Prime | Non-prime | Re-REMIC | Subordinate | Total | ||||||||||||||||
| Available-for-sale securities (1) | ||||||||||||||||||||
| Current face |
$ | 486 | $ | 278 | $ | 216 | $ | 299 | $ | 1,279 | ||||||||||
| Credit reserve |
(26 | ) | (18 | ) | (47 | ) | (96 | ) | (187 | ) | ||||||||||
| Net unamortized discount |
(54 | ) | (43 | ) | (70 | ) | (37 | ) | (204 | ) | ||||||||||
| Amortized cost |
406 | 217 | 99 | 166 | 888 | |||||||||||||||
| Unrealized gains |
61 | 29 | 64 | 23 | 177 | |||||||||||||||
| Unrealized losses |
- | (1 | ) | - | (2 | ) | (3 | ) | ||||||||||||
| Trading securities
|
|
10
|
|
|
22
|
|
|
-
|
|
|
1
|
|
|
33
|
| |||||
| Fair value of residential securities | $ | 477 | $ | 267 | $ | 163 | $ | 188 | $ | 1,095 | ||||||||||
| Fair value of AFS securities as a % of face value (2) |
96 | % | 88 | % | 75 | % | 62 | % | 83 | % | ||||||||||
| Amortized cost of AFS securities as a % of face value (2) |
84 | % | 78 | % | 46 | % | 56 | % | 69 | % | ||||||||||
(1) Included in the residential securities table above are $325 million of senior securities that are included in a resecuritization that we completed in July 2011. Under GAAP accounting, we account for the resecuritization as a financing even though these securities are owned by the resecuritization entity and are legally not ours. We own only the securities and interests that we acquired from the resecuritization entity, which amounted to $145 million at December 31, 2012. As a result, to adjust at December 31, 2012 for the legal and economic interests that resulted from the resecuritization, Total Residential Senior Securities would be decreased by $325 million to $419 million, Total Re-REMIC Residential Securities would be increased by $145 million to $308 million, and Total Residential Securities would be reduced by $180 million to $915 million.
(2) Does not include $33 million of trading securities.
| u | Securities are acquired assuming a range of outcomes based on modeling of expected performance at the individual loan level for both delinquent and current loans. Over time, the performance of these securities may require a change in the amount of credit reserves we designate. |
| u | In the fourth quarter of 2012, realized credit losses on our residential securities at Redwood totaled $8 million, as compared to realized credit losses of $11 million in the third quarter of 2012. At December 31, 2012, credit reserves for our securities portfolio totaled $187 million, or 14.6% of the face amount of our residential securities. Until the losses occur, we will generally continue to earn interest, to varying degrees, on the face value of those securities. |
| u | Additional information on interest income and yields for our securities portfolio is reported in the Financial Tables in the Appendix. |
| 30 | THE REDWOOD REVIEW | 4TH QUARTER 2012 |
|
|
| |
|
RESIDENTIAL REAL ESTATE SECURITIES
|
Housing Prices
| u | Our outlook for housing is unchanged from three months ago. If you compare home prices to local incomes, housing is inexpensive by historical standards in most of the country. Record low interest rates are providing additional affordability, which should protect against price declines absent a second recession. The oversupply situation is improving: the National Association of Realtors reported that existing home inventories declined 22% year-over-year through December 2012 and also that the distressed share of home sales fell from 32% to 24% over the same period. We believe housing is in the process of stabilizing and expect it to be a modestly appreciating asset class for several years. |
Delinquencies
| u | Industry-wide delinquencies fell in the fourth quarter of 2012, but remain at historically elevated levels. According to LoanPerformance data, serious (90+ day) delinquencies fell by 0.37% quarter-over-quarter to 10.32% for prime loans and fell 1.11% quarter-over-quarter to 26.56% for Alt-A loans. The loans underlying Redwood’s RMBS portfolio have, on average, lower delinquency rates than the market as a whole: 7.04% of our prime loans, and 13.02% of our Alt-A loans, are 90+ days delinquent. |
| u | Industry-wide early-stage roll rates (from loans “always current” to 30 days delinquent) rose slightly in the fourth quarter. Of previously “always current” prime loans, 0.54% missed their first payment in December 2012, up from 0.44% in September 2012, while the same metric for Alt-A rose 0.08% to 0.90%. These roll rates are high by historical standards but well below 2008 — 2011 levels, and are currently showing no sign of a “double dip” in mortgage performance. This trend should eventually cause total delinquencies to fall, but for now the slowdown in new defaults is being offset by an extension in liquidation timelines. |
Prepayments
| u | Industry-wide prepayment speeds were stable during the fourth quarter of 2012. Prime borrowers with loan-to-value (LTV) ratios below 100% prepaid at 17% CPR in December 2012 (down from 18% in September 2012), while Alt-A borrowers with equity prepaid at 8% CPR, in line with September 2012. Prepayment rates continue to benefit from falling interest rates: according to Freddie Mac, the monthly average interest rate for new 30-year fixed-rate loans fell from 3.47% in September 2012 to an all-time low of 3.35% in December 2012. Borrowers without equity prepaid very slowly regardless of credit quality, with prime and Alt-A loans with above 100% LTV prepaying at only 6% and 1% CPR, respectively. |
| THE REDWOOD REVIEW | 4TH QUARTER 2012 | 31 |

|
| |
|
COMMERCIAL MORTGAGE BANKING ACTIVITIES
|
Summary
Our commercial platform provides debt solutions for borrowers on stabilized commercial properties nationwide. Redwood originates senior mortgages, mezzanine loans, and preferred equity investments. We originate and structure commercial mortgages, distribute senior loans via securitization and/or sales, and transfer subordinate debt investments to Redwood to be retained in its portfolio. We also collaborate with major lending institutions (including commercial banks, life insurance companies, CMBS issuers, and the GSEs) to originate subordinate debt investments for Redwood’s portfolio. At December 31, 2012, Redwood owned a small balance of legacy commercial securities that were acquired prior to 2008, which were sold in the first quarter of 2013.
Quarterly Update
| u | The demand for commercial real estate (CRE) debt capital is expected to continue to outweigh the supply in 2013. Against this backdrop, we are working to execute on our strategy of providing commercial borrowers with full leverage (senior and mezzanine financing). Our commercial platform’s ability to originate both senior and mezzanine loans, as well as access all major traditional commercial mortgage capital sources, is central to this strategy. We began originating commercial loans in late 2010, and since then have collaborated with 20 different senior lenders, including eight banks, an insurance company, a GSE, and ten CMBS lenders. During this period we have provided financing in twenty-two different states and on over 80 stabilized commercial properties across all major property types. |
| u | During the fourth quarter, we generated $1 million in gain on sale income from the distribution of two senior loans in the amount of $52 million to the CMBS market. |
| u | During the fourth quarter of 2012, we also closed and funded two senior loans totaling $24 million that also provided $4 million of mezzanine investments for our portfolio. Through February 15, 2013, we closed a total of seven loans totaling $80 million funded by us and one loan of $55 million through a third- party table funding agreement. We anticipate distribution of these loans in the first quarter of 2013. |
| u | In the fourth quarter of 2012, we securitized our CRE mezzanine loan portfolio via RCMC CREL 2012- 1, a $291 million transaction that effectively provided $172 million of non-recourse, match-funded financing. We are redeploying this capital and expect to generate a gross yield in excess of 13% on our retained equity in this financing vehicle. This transaction is noteworthy as the commercial real estate capital markets’ first post-crisis securitization of subordinate debt. |
| u | RCMC CREL 2012-1 demonstrated the liquidity of the commercial mezzanine loans we originate. We believe this financing structure is repeatable — the four mezzanine loans for $21 million we originated in the fourth quarter, the five mezzanine loans for $26 million we have originated thus far in 2013 through February 15, 2013, and our continued 2013 mezzanine origination activity are being accumulated for future securitized financings. As previously reported, we have a mezzanine warehouse facility in place to assist with this accumulation. |
| 32 | THE REDWOOD REVIEW | 4TH QUARTER 2012 |
|
|
| |
|
COMMERCIAL MORTGAGE BANK ACTIVITIES
|
Quarterly Update (continued)
| u | At December 31, 2012, our commercial mezzanine loan portfolio totaled $305 million. The mezzanine loans, on average, have a weighted average maturity of nearly six years, a yield of 10.5%, loan-to-value ratio of 73% at origination, and a debt service coverage ratio at origination of 1.24X based on our underwritten cash flows. |
| u | At December 31, 2012, all of the mezzanine loans continue to be current. Overall, the commercial mezzanine portfolio has benefitted from improving fundamentals and positive credit migration. |
| u | During the fourth quarter of 2012, our commercial loan portfolio generated net interest income of $7 million, in line with the $7 million generated in the third quarter. However, this quarter’s net interest income included $1 million in interest expense, as we effectively match-funded our mezzanine portfolio through our recently completed securitization. |
| u | The following table and charts provide information on the commercial mezzanine loan portfolio as of December 31, 2012. In addition, as noted above, as of December 31, 2012 we held one senior loan for sale totaling $8.5 million on a retail property in Florida. |
| Property Type | Number of Loans | Weighted Average DSCR(1) |
Weighted Average LTV(2) |
Average Loan Size ($ millions) | ||||
|
Multifamily
|
13 | 1.20X | 79% | $6.7 | ||||
|
Office(1)
|
9 | 1.22X | 72% | $10.1 | ||||
|
Retail
|
4 | 1.16X | 76% | $11.9 | ||||
|
Hospitality
|
5 | 1.36X | 62% | $12.9 | ||||
|
Self Storage(3)
|
3 | 1.34X | 79% | $6.0 | ||||
|
Total
|
34(4) | 1.24X | 73% | $9.1 |
| (1) | The debt service coverage ratio (DSCR) is defined as the property’s annual net operating income divided by the annual principal and interest payments. A DSCR of less than 1.00x would mean there was insufficient cash flow to make principal and interest payments, while a DSCR of more than 1.00x would mean there was positive cash flow after payment of principal and interest. The weighted average DSCRs in this table are based on the ratios at the time the loans were originated and are not based on subsequent time periods during which there may have been increases or decreases in each property’s operating income. |
| (2) | The loan-to-value calculation is defined as the sum of the senior and all subordinate loan amounts divided by the value of the property. The weighted average LTV ratios in this table are based on the ratios at the time the loans were originated and are not based on subsequent time periods during which there may have been increases or decreases in each property’s value. |
| (3) | Three of these loans are recourse to the borrowers (2 self storage, 1 office). |
| (4) | Does not include one commercial loan acquired in 2005. |
| Property Type(1) |
Geography(1) | |
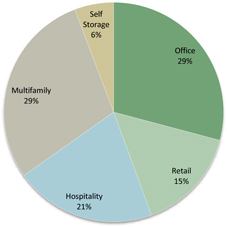
|
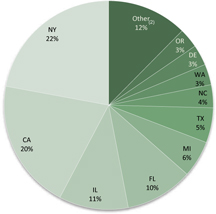
| |
| (1) Percentages based on outstanding loan balances. |
(1) Percentages based on outstanding loan balances.
(2) Other includes DC, NJ, KY, TN, PA, SC, MS, MN, MA and GA, each with 3% or less. |
| THE REDWOOD REVIEW | 4TH QUARTER 2012 | 33 |

|
| |
|
INVESTMENTS IN CONSOLIDATED ENTITIES
|
Summary
We sponsor Sequoia securitization entities that acquire mortgage loans and issue RMBS backed by these loans. Prior to 2012, the securitizations were accounted for under GAAP as secured borrowings resulting in those entities being consolidated on our financial statements. Starting in 2012, we began to use sale accounting for our Sequoia securitizations and as a result, we do not consolidate securitizations that are accounted for as a sale of assets. The change in accounting treatment was made to better reflect the economics of our securitizations by matching expenses with revenues. As a result, we expect our investment in consolidated Sequoia entities to decline over time. During the fourth quarter of 2012, we sold our interests in Acacia securitization entities.
Quarterly Update
| u | We recognized net income of $9 million for the fourth quarter from our investments in legacy Sequoia and Acacia securitization entities, as compared to net income of $3 million for the previous quarter. This increase is primarily attributable to the realized gains recognized upon deconsolidation and sale of certain Sequoia and Acacia securitization entities. |
| u | Within the consolidated Sequoia securitization entities on our balance sheet at December 31, 2012, loans delinquent greater than 90 days were $63 million, or 2.77% of unpaid principal balance (UPB) at December 31, 2012, and were $65 million, or 2.69% of UPB at September 30, 2012. Net charge-offs relating to these loans in the fourth quarter of 2012 amounted to $4 million, or 0.18% of the outstanding principal balance of loans. |
| u | The consolidation of the assets and liabilities of Sequoia securitization entities may lead to potentially volatile reported earnings for a variety of reasons, including the amortization of premiums on the loans and liabilities of Sequoia entities, changes in credit loss provisions for loans held by Sequoia entities, and deconsolidation events. |
| 34 | THE REDWOOD REVIEW | 4TH QUARTER 2012 |
This Page Intentionally Left Blank
| 35 |

| 36 |
|
|

| |
|
REDWOOD’S BUSINESS STRATEGY
|
Redwood’s Business Strategy
This new section of the Redwood Review provides insight into Redwood’s strategic focus and our business model.
Strategic Focus
As the financial world engaged in massive deleveraging at the onset of the financial crisis, we made a strategic decision in late 2009 to invest in and build out our residential and commercial loan platforms. We did this in order to manufacture our own steady sources of attractive investments and fee-generating opportunities.
There is commonality between our residential and commercial business activities. In both cases, we have established ourselves as an intermediary between borrowers and senior investors in the capital markets. This strategy works well with the structure of our balance sheet and the talents and extensive relationships of the professionals who make up our residential and commercial teams.
On the residential side, our focus since mid-2010 has been to source prime, jumbo mortgages primarily for sale through private-label securitization, but also at times through bulk sales. While the initial market opportunity appeared small, our confidence was driven by three big business assumptions: that the government would eventually reduce its outsized role in the mortgage market; that new bank regulation, Basel III, and legacy portfolio issues would open up an opportunity for independent mortgage companies; and that traditional private triple-A institutional investors would return to the market to provide attractive financing for prime residential loans through their investment in private-label securities (“PLS”). We are now seeing our business assumptions play out. The Federal Housing Finance Agency (“FHFA”) that regulates and is the conservator of Fannie Mae and Freddie Mac has begun to raise the fees that the Agencies charge to guarantee MBS, which allows the private market to become more competitive with the Agency market. New bank regulations and pending Basel III capital requirements are forcing the major banks to rethink the ways in which they participate in the mortgage origination market and are causing mortgage servicing rights to change hands at attractive prices. Meanwhile, demand for triple-A securities issued through the Sequoia platform has been strong since we restarted our securitization activity in 2010.
On the commercial side, we set our sights on an inevitable wave of commercial loan refinancing demand, brought about by the pre-crisis era of high-leverage lending. An immediate need was identified for mezzanine capital that could bridge the gap between commercial borrowers’ funding needs and what traditional senior lenders would provide in a deleveraged world. We also assumed that we would eventually position our platform to become an originator of senior commercial loans, offering value through greater flexibility and certainty of execution for borrowers. We have made progress in both areas, as we have originated more than $300 million of mezzanine loans since late 2010, and have made solid progress on our commercial senior loan origination strategy.
| THE REDWOOD REVIEW | 4TH QUARTER 2012 | 37 |
|
|
| |
|
REDWOOD’S BUSINESS STRATEGY
|
Redwood’s Business Model
Our operating model has evolved substantially since the financial crisis began in 2007. This evolution has, in part, been due to our desire to build a franchise value-producing business model that will be positioned to capitalize on the expected eventual reform of Fannie Mae and Freddie Mac (the “Agencies”) and our desire to be competitive in the post-crisis era of greater regulatory and capital requirements for all mortgage market participants, particularly for the more heavily regulated banks.
Today, Redwood is an internally-managed operating business focused on residential and commercial mortgage banking and mortgage-related investments. While we are structured as a REIT for tax purposes, we operate more like a mortgage banking company than most other publicly-traded mortgage REITs.
Below is an illustration of our three primary revenue sources: our residential and commercial mortgage banking activities, which are generally carried out through taxable REIT subsidiaries, and our tax-advantaged investment portfolio, which is housed at our REIT, as shown in the chart below.
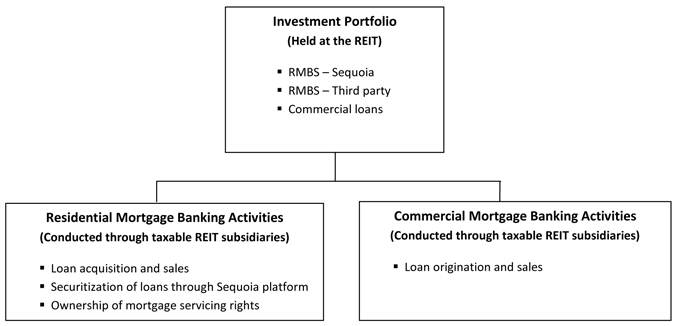
| 38 | THE REDWOOD REVIEW | 4TH QUARTER 2012 |
|
|
| |
|
REDWOOD’S BUSINESS STRATEGY
|
Residential Mortgage Banking Activities
We conduct our residential mortgage banking activities through taxable REIT subsidiaries that pay taxes and can generally retain earnings and reinvest the cash flows generated therein. Earnings and cash flow from these activities can also be up-streamed to Redwood Trust, Inc. to be passed through to shareholders, if desired.
Our residential mortgage banking activities primarily consist of operating a jumbo prime mortgage loan conduit — i.e., the acquisition of jumbo residential mortgages from third party originators and the subsequent sale or securitization of those loans. In carrying out this aspect of our business, we buy individual closed loans one- by- one (on a “flow” basis) from commercial banks and mortgage companies located throughout the U.S. We periodically augment our flow loan acquisitions with bulk portfolio acquisitions. Although we do not originate or directly service residential loans, we have a complete mortgage banking team with a skill set in underwriting, compliance, quality control, secondary marketing, and warehousing. Our current loan acquisition strategy differs from the pre-credit crisis period when we were more focused on acquiring loans in bulk through a competitive bidding process. (Aside from the lack of any material bulk sale activity of newly originated jumbo mortgage loans, we believe the bulk model has lower barriers to entry.) After accumulating a sufficient aggregate principal amount of loans, we typically securitize them through our Sequoia securitization platform and sell the senior securities to a broker/dealer for redistribution to triple-A investors. The subordinate securities are generally retained and held for investment by Redwood Trust, Inc., our tax-advantaged REIT parent company. Most of the loans acquired are securitized, but we occasionally sell whole loans to banks and other buyers.
Commercial Mortgage Banking Activities
We conduct our commercial mortgage banking activities through taxable REIT subsidiaries that also pay taxes but have the ability to retain earnings and cash flow for reinvestment. In summary, we operate as a commercial mortgage lender by originating loans directly to borrowers and through a correspondent network. We may split originated commercial loans in to senior and mezzanine tranches. We typically sell the senior tranches into the capital markets (such as to CMBS conduits, banks, and insurance companies) on a “best execution basis,” and retain the mezzanine tranches for our REIT investment portfolio held at Redwood Trust, Inc.
Investment Portfolio
Our investment portfolio is held within our REIT, and includes investments in RMBS issued in Sequoia securitization transactions that result from our residential mortgage banking activities as well as RMBS issued by third parties, and in residential and commercial loans, including commercial loans that result from our commercial mortgage banking activities. As a REIT, we must distribute a minimum of 90% of pretax earnings from our investment portfolio to shareholders to avoid corporate income tax liability on those earnings.
| THE REDWOOD REVIEW | 4TH QUARTER 2012 | 39 |
|
|
| |
|
THE “QUALIFIED MORTGAGE” RULE AND OUR BUSINESS
|
The “Qualified Mortgage” Rule and our Business
We’ve been asked how the recently issued Qualified Mortgage (QM) rule will affect our jumbo mortgage business. One reason we get asked is that, historically, a large percentage of the loans we have securitized through our Sequoia platform had an interest-only (IO) feature — and under the rule a residential mortgage loan with an IO feature will not, by definition, be a QM. The short answer is that because the borrowers under the IO loans we acquire generally have favorable credit profiles, we currently don’t believe that this aspect of the QM rule should have much of an impact on our business. However, its actual short- and long-term impact on us will depend, in large part, on how the credit rating agencies and triple-A securitization investors assess the investment risks associated with IO loans that result from the new rule.
For background, under the Dodd-Frank Act, the Consumer Financial Protection Bureau (CFPB) is responsible for establishing rules that require mortgage lenders to verify, prior to origination, that a borrower will have the “ability to repay” his or her mortgage loan. Loans that meet certain criteria relating to the ability-to-repay requirements benefit from a legal presumption or safe harbor regarding the ability-to-repay requirements and are referred to as QMs. The intention of the QM rule is to incentivize the origination of QMs and, accordingly, for lenders to be exposed to lower legal risk with respect to the origination of QMs than with respect to the origination of non-QMs. Liability for an originator’s violation of the ability-to-repay verification requirements passes from the originator of a mortgage loan to any subsequent purchaser of that loan, including a securitization trust. In summary, the CFPB defined a QM to be a fully-amortizing mortgage that has a debt-to-income ratio (DTI) of 43% or less, points and fees that are no more than 3% of the loan amount, and regular periodic payments that are substantially equal (except for adjustable-rate mortgages). Loans that have negative amortization, IO, or balloon payment features are not considered QMs.
If a lender originates a QM, the lender has the benefit of procedural defenses to a delinquent borrower’s challenge that the mortgage loan violated the ability-to-repay verification requirements. If the loan has a rate less than the average prime offer rate plus 1.50%, and otherwise meets all the other QM criteria, the lender has a “safe harbor” defense against a future ability-to-repay claim. If the loan has a rate that is greater than the average prime offer rate plus 1.50%, and otherwise meets all other QM criteria, the lender is entitled to a “rebuttable presumption” that it verified the borrower’s ability to repay the loan (imposing the burden of proof for an ability-to-repay claim on the borrower). For non-QM loans, the lender has the burden of proof that it verified the borrower’s ability-to-repay.
Jumbo mortgage loans have commonly had IO features and those that do, by definition, are not QMs regardless of the financial and credit profile of the borrower.1 However, IOs have traditionally been sought after by prime jumbo loan borrowers who prefer the IO feature to a standard amortizing loan. In the hands of these borrowers, IO loans have been historically safer (based on Redwood’s experience in investing in prime jumbo IO loans between 1997 and 2007) than some of the so-called “toxic loans” they now, as a regulatory matter, appear to be lumped in with (e.g., IO loans that were extended to subprime borrowers as a way to increase purchasing power during the housing bubble).
1 Some jumbo borrowers with IO loans also have debt-to-income ratios in excess of 43%, which exceeds the maximum permissible under the QM definition.
| 40 | THE REDWOOD REVIEW | 4TH QUARTER 2012 |
|
|
| |
|
THE “QUALIFIED MORTGAGE” RULE AND OUR BUSINESS
|
Loans with IO features have been a relatively small and declining percentage of our recent Sequoia securitizations. Of the 11 Sequoia securitizations we have completed from April 2010 through January 2013, 11.2% by loan count and 14.3% by dollar amount, of the loans had an IO feature. Of the eight securitizations we completed from January 2012 through January 2013, 6.1% by loan count and 8.5% by dollar amount, of the loans had an IO feature, and in the two securitizations we completed in January 2013, 4.7% by loan count and 7.1% by dollar amount, of the loans had an IO feature.2 This declining trend could continue or, if competitors become less comfortable with IO loans than we are as the QM rule goes into effect (and assuming attractive financing is available through the securitization market), we could increase the percentage of IO loans we securitize and expand our share of this market. Over the past 15 years, we have acquired several billion dollars of loans with IO features that were originated by third parties for prime jumbo borrowers. Overall, these loans have performed relatively well and have generally been good investments for us. We remain comfortable with this type of loan product and we are working to keep ourselves positioned to continue to acquire, securitize, and invest in IO loans even after the QM rule goes into effect in January 2014. We don’t think we are alone in our thinking, as we have heard some lenders make similar comments about their comfort with jumbo borrowers using IO loan products. Our ability to continue to acquire and securitize IO loans, however, is dependent in large part on how the risks related to these non-QM loans are regarded by credit rating agencies (who establish subordination levels and credit ratings for our Sequoia securitization transactions) and by the triple-A investors that invest in the mortgage-backed securities issued in these transactions.
One challenge for us and others in the industry between now and when the QM rule becomes effective is to work with the rating agencies, triple-A investors, regulators, and other stakeholders in the housing and mortgage finance markets to establish further clarity and standards around the QM rule and ensure that the securitization market will continue to provide attractive financing for loans that are non-QMs due to an IO feature. Another challenge will be to determine whether jumbo loans that we believe present acceptable credit risk, but which are not QMs due to the borrower’s DTI being above 43%, will also continue to benefit from attractive financing from the securitization market. Our intention in future quarters will be to continue to comment in the Redwood Review on the QM rule and the potential impact it may have on our business.
2 Loans originated to borrowers with debt-to-income (DTI) ratios in excess of 43% are also, by definition, non-QMs. In our most recent 11 Sequoia securitizations, 8.2% by loan count and 7.9% by dollar amount, of the borrowers had DTIs of 43% or more. We are continuing to analyze the potential impact of this aspect of the QM rule on our business, however, we also do not currently believe that this aspect of the QM rule should have much of an impact on our business.
| THE REDWOOD REVIEW | 4TH QUARTER 2012 | 41 |
|
|
| |
|
ACCOUNTING DISCUSSION
|
Mark-to-Market Valuation Process
| u | Market values reflect an “exit price,” or the amount we believe we would realize if we sold an asset or would pay if we repurchased a liability in an orderly transaction, even though we generally have no intention — nor would we be required — to sell assets or repurchase liabilities. Establishing market values is inherently subjective and requires us to make a number of assumptions, including the future of interest rates, prepayment rates, discount rates, credit loss rates, and the timing of credit losses. The assumptions we apply are specific to each asset or liability. |
| u | We rely on our internal calculations to compute the fair value of our securities and we request and consider indications of value (marks) from third-party dealers to assist us in our mark-to-market valuation process. For December 31, 2012, we received dealer marks on 75% of our securities and 37% of our ABS issued. In the aggregate, our internal valuations of the securities on which we received dealer marks were within 1% of the aggregate dealer marks, and our internal valuations of our ABS issued on which we received dealer marks were 3% higher (i.e., more conservative) than the aggregate dealer marks. The decline in the percentage of dealer marks over the past two years primarily reflects staff and service reductions at the dealers. |
Determining Other-Than-Temporary Impairments
| u | The multi-step process for determining whether an investment security has other-than-temporary impairment is presented below. |
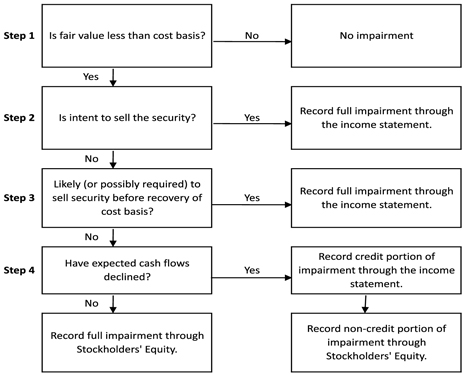
| 42 | THE REDWOOD REVIEW | 4TH QUARTER 2012 |
|
|

| |
|
GLOSSARY
|
ACACIA
Acacia is the brand name for the collateralized debt obligation (“CDO”) securitizations Redwood manages.
ADJUSTABLE-RATE MORTGAGES (ARM)
Adjustable-rate mortgages (“ARMs”) are loans that have coupons that adjust at least once per year. We make a distinction between ARMs (loans with a rate adjustment at least annually) and hybrids (loans that have a fixed-rate period of 2-10 years and then become adjustable-rate).
AGENCY
Agency refers to government-sponsored enterprises (“GSEs”), including Federal National Mortgage Association (“Fannie Mae”), Federal Home Loan Mortgage Corporation (“Freddie Mac”), and Government National Mortgage Association (“Ginnie Mae”).
ALT-A SECURITIES and ALT-A LOANS
Alt-A securities are residential mortgage-backed securities backed by loans that have higher credit quality than subprime and lower credit quality than prime. Alt-A originally represented loans with alternative documentation, but the definition has shifted over time to include loans with additional risk characteristics and in some cases investor loans. In an Alt-A loan, the borrower’s income may not be verified, and in some cases, may not be disclosed on the loan application. Alt-A loans may also have expanded criteria that allow for higher debt-to-income ratios with higher accompanying loan-to-value ratios than would otherwise be permissible for prime loans.
AMORTIZED COST
Amortized cost is the initial acquisition cost of an available-for-sale (“AFS”) security, minus principal repayments or principal reductions through credit losses, plus or minus premium or discount amortization. At the point in time an AFS security is deemed other-than-temporarily impaired, the amortized cost is adjusted (by changing the amount of unamortized premium or discount) by the amount of other-than temporary impairment taken through the income statement.
ASSET-BACKED SECURITIES (ABS)
Asset-backed securities (“ABS”) are securities backed by financial assets that generate cash flows. Each ABS issued from a securitization entity has a unique priority with respect to receiving principal and interest cash flows and absorbing any credit losses from the assets owned by the entity.
AVAILABLE-FOR-SALE (AFS)
An accounting method for debt and equity securities in which the securities are reported at their fair value. Positive changes in the fair value are accounted for as increases to stockholders’ equity and do not flow through the income statement. Negative changes in fair value may be recognized through the income statement or balance sheet, as further detailed in the Accounting Discussion section.
B-NOTES
B-Notes are subordinate interests in commercial mortgage debt which are either (i) evidenced by a subordinated promissory note secured by the same mortgage that also secures the senior debt relating to the same property or (ii) junior participation interests in mortgage debt that are subordinate to senior participation interests in the same mortgage debt. B-Notes typically provide the holder with certain rights to approve modifications to related lending agreements and to trigger foreclosure under the mortgage following an event of default. B-Notes also typically provide the holder certain limited rights to cure a borrower default under senior debt secured by the same mortgage in order to keep the senior debt current and avoid foreclosure.
| THE REDWOOD REVIEW | 4TH QUARTER 2012 | 43 |
|
|
| |
|
GLOSSARY
|
BOOK VALUE (GAAP)
Book value is the value of our common equity in accordance with GAAP.
COLLATERALIZED DEBT OBLIGATION (CDO) SECURITIZATIONS
The securitization of a diverse pool of assets.
COMMERCIAL MORTGAGE-BACKED SECURITIES (CMBS)
A type of mortgage-backed security that is secured by one or more loans on commercial properties.
CONSTANT (or CONDITIONAL) PREPAYMENT RATE (CPR)
Constant (or conditional) prepayment rate (“CPR”) is an industry-standard measure of the speed at which mortgage loans prepay. It approximates the annual percentage rate at which a pool of loans is paying down due to unscheduled principal prepayments.
CORE EQUITY
Core equity is not a measure calculated in accordance with GAAP. GAAP equity includes mark-to-market adjustments for some of our assets and interest rate agreements in “accumulated other comprehensive income (loss).” Core equity excludes accumulated other comprehensive income (loss). Core equity in some ways approximates what our equity value would be if we used historical amortized cost accounting exclusively. A reconciliation of core equity to GAAP appears in the Table 3 in the Financial Tables in this Review.
CREDIT SUPPORT
Credit support is the face amount of securities subordinate (or junior) to the applicable security that protects the security from credit losses and is generally expressed as a percentage of the securitization’s underlying pool balance.
DEBT
Debt is an obligation of Redwood. See Long-term debt and Short-term debt.
ECONOMIC VALUE (MANAGEMENT’S ESTIMATE OF ECONOMIC VALUE)
Economic value is calculated as of a particular point in time based on our existing assets and liabilities and does not incorporate other factors that may have a significant impact on that value, most notably the impact of future business activities. As a result, the values do not necessarily represent an estimate of our net realizable value, our liquidation value, or our market value as a whole. Amounts we ultimately realize from the disposition of assets or settlement of liabilities may vary significantly from these values. Because temporary changes in market conditions can substantially affect value, we do not believe that short-term fluctuations in the value of our assets and liabilities are necessarily representative of the effectiveness of our investment strategy or the long-term underlying value of our business. Economic value is calculated using bid-side asset marks (or estimated bid-side values) for our financial assets and offer-side marks (or estimated offered-side values) for our financial liabilities, when available, using the same valuation process used to estimate the fair values of our other financial assets and liabilities under GAAP. When quoted market prices or observable market data are not available to estimate fair value, we rely on unobservable inputs, which are generally more subjective and involve a high degree of management judgment and assumptions. These assumptions may have a significant effect on our estimates of value, and the use of different assumptions as well as changes in market conditions could have a material effect on our results of operations or financial condition.
Our economic value estimates are reconciled to GAAP book values in the Financial Insights section and in the Financial Tables of this Review.
| 44 | THE REDWOOD REVIEW | 4TH QUARTER 2012 |
|
|
| |
|
GLOSSARY
|
FASB
Financial Accounting Standards Board.
FHFA
The FHFA refers to the Federal Housing Finance Authority.
GAAP
Generally Accepted Accounting Principles in the United States.
GOVERNMENT SPONSORED ENTERPRISE (GSE)
A government sponsored enterprise is a financial services corporation created by the United States Congress to enhance the flow of credit to targeted sectors of the economy. Among the GSEs charted by Congress are Fannie Mae, Freddie Mac, and Ginnie Mae.
INTEREST-ONLY SECURITIES (IOs)
Interest-only securities (“IOs”) are specialized securities created by securitization entities where the projected cash flows generated by the underlying assets exceed the cash flows projected to be paid to the securities that are issued with principal balances. Typically, IOs do not have a principal balance and they will not receive principal payments. Interest payments to IOs usually equal an interest rate formula multiplied by a “notional” principal balance. The notional principal balances for IOs are typically reduced over time as the actual principal balance of the underlying pool of assets pays down, thus reducing the cash flows to the IOs over time. Cash flows on IOs are typically reduced more quickly when asset prepayments increase.
INVESTMENT CAPACITY
The amount of capacity we estimate that we have to invest in new assets. Our estimate of our investment capacity takes into account, among other things, cash on hand, cash we estimate we could raise by prudently increasing short-term borrowings, and cash needed to cover short-term operations, working capital, and a liquidity cushion.
JUMBO LOAN
A jumbo loan is a mortgage loan that generally conforms to the underwriting standards of Fannie Mae and Freddie Mac except that the dollar amount of the loan exceeds the maximum limit set by the two GSEs for loans salable to the two companies.
LEVERAGE RATIOS
When determining Redwood’s financial leverage, traditional leverage ratios may be misleading in some respects if consolidated ABS issued from securitization entities are included as part of Redwood’s obligations when calculating this or similar ratios. Because of the requirement to consolidate the independent securitization entities for GAAP accounting purposes, it appears that Redwood is highly leveraged, with total consolidated liabilities significantly greater than equity. The obligations of these securitization entities are not obligations of Redwood.
LONG-TERM DEBT
Long-term debt is debt that is an obligation of Redwood that is not payable within a year and includes junior subordinated notes and trust preferred securities. We generally treat long-term debt as part of our capital base when it is not payable in the near future.
MARK-TO-MARKET (MTM) ACCOUNTING
Mark-to-market (“MTM”) accounting uses estimated fair values of assets, liabilities, and hedges. Many assets on our consolidated balance sheet are carried at their fair value rather than amortized cost. Taxable income is generally not affected by market valuation adjustments.
| THE REDWOOD REVIEW | 4TH QUARTER 2012 | 45 |
|
|
| |
|
GLOSSARY
|
MARKET VALUATION ADJUSTMENTS (MVAs)
Market valuation adjustments (“MVAs”) are changes in market values for certain assets and liabilities that are reported through our GAAP income statement. They include all changes in market values for assets and liabilities accounted for at fair value, such as trading securities and derivatives. They also include the credit portion of other-than-temporary impairments on securities available-for-sale, as well as impairments of loans held-for-sale and REO properties.
MEZZANINE LOAN
A mezzanine loan is a loan secured by the membership interests, partnership interests, and/or stock in a single purpose entity formed to own a commercial property, for example. If the mezzanine borrower fails to make its payments or otherwise defaults under the mezzanine loan documents, the mezzanine lender may pursue its remedies, including taking control of the single purpose entity that owns the property.
MORTGAGE SERVICING RIGHT (MSR)
A mortgage servicing right (“MSR”) gives the holder the contractual right to service a mortgage loan. MSRs typically include the right to collect monthly mortgage principal and interest payments, as well as related tax and insurance payments, from borrowers, disburse funds to the mortgage debt holders and remit related insurance and tax payments, collect late payments, and process modifications and foreclosures. MSRs are created when mortgage loans are sold in a transaction in which the seller retains the right to service the loans. The holder of an MSR receives a monthly servicing fee (which generally ranges from 0.25% to 0.375% per annum of the outstanding principal balance of the related mortgage loan), which is deducted from the borrower’s monthly interest payments. For accounting purposes, MSRs are capitalized at the net present value of the servicing fee less the servicing cost. When Redwood holds MSRs relating to residential mortgage loans, it retains a sub-servicer to carry out actual servicing functions, as Redwood does not directly service residential mortgage loans.
NON-GAAP METRICS
Not all companies and analysts calculate non-GAAP metrics in the same manner. As a result, certain metrics as calculated by Redwood may not be comparable to similarly titled metrics reported by other companies. Redwood uses non-GAAP metrics such as management’s estimate of economic value and core equity to provide greater transparency for investors. Our non-GAAP metrics are reconciled to GAAP in the Financial Tables in this Review.
NON-PRIME SECURITIES
Non-prime securities are Alt-A, option ARM, and subprime securities. See definitions of Alt-A, option ARM, and subprime securities.
OPTION ARM LOAN
An option ARM loan is a residential mortgage loan that generally offers a borrower monthly payment options such as: 1) a minimum payment that results in negative amortization; 2) an interest-only payment; 3) a payment that would fully amortize the loan over an original 31-year amortization schedule; and, 4) a payment that would fully amortize the loan over a 15-year amortization schedule. To the extent the borrower has chosen an option that is not fully amortizing the loan (or negatively amortizing the loan), after a period — usually five years or once the negatively amortized loan balance reaches a certain level (generally 15% to 25% higher than the original balance) — the loan payments are recast. This recast provision resets the payment at a level that fully amortizes the loan over its remaining life and the new payment may be materially different than under the borrowers’ previous option.
| 46 | THE REDWOOD REVIEW | 4TH QUARTER 2012 |
|
|
| |
|
GLOSSARY
|
PREFERRED EQUITY
A preferred equity investment is an investment in preferred equity of a special purpose entity that directly or indirectly owns a commercial property. An investor in preferred equity is typically entitled to a preferred return (relative to a holder of common equity of the same entity) and has the right, if the preferred return is not paid, to take control of the entity (and thereby control the underlying commercial property).
PRIME RESIDENTIAL REAL ESTATE LOANS
Prime loans are residential loans with higher quality credit characteristics, such as borrowers with higher FICO credit scores, lower loan-to-value ratios, lower debt-to-income ratios, greater levels of other assets, and more documentation.
PRIME SECURITIES
Prime securities are residential mortgage-backed securities backed by prime loans, generally with balances greater than conforming loan limits. Prime securities are typically backed by loans that have relatively high weighted average FICO scores (e.g., 700 or higher at origination), low weighted average LTVs (e.g., 75% or less at origination), limited concentrations of investor properties, and low percentages of loans with low FICO scores or high loan-to-value ratios.
PROFITABILITY RATIOS
Many financial institution analysts use asset-based profitability ratios such as interest rate spread and interest rate margin when analyzing financial institutions. These are asset-based measures. Since we consolidate the assets and liabilities of securitization entities for GAAP purposes, our total GAAP assets and liabilities may vary over time, and may not be comparable to assets typically used in profitability calculations for other financial institutions. As a result, we believe equity-based profitability ratios may be more appropriate than asset-based measures for analyzing Redwood’s operations and results. We believe, for example, that net interest income as a percentage of equity is a useful measure of profitability. For operating expenses, we believe useful measures are operating efficiency ratio (operating expenses as a percentage of net interest income) and operating expenses as a percentage of equity. We provide various profitability ratios in Table 4 in the Financial Tables in this Review.
REAL ESTATE INVESTMENT TRUST (REIT)
A real estate investment trust (“REIT”) is an entity that makes a tax election to be taxed as a REIT, invests in real estate assets, and meets other REIT qualifications, including the distribution as dividends of at least 90% of REIT taxable income. A REIT’s profits are not taxed at the corporate level to the extent that these profits are distributed as dividends to stockholders, providing an operating cost savings. On the other hand, the requirement to pay out as dividends most of the REIT’s taxable profits means it can be harder for a REIT to grow using only internally-generated funds (as opposed to raising new capital).
REAL ESTATE OWNED (REO)
Real estate owned (“REO”) refers to real property owned by the lender or loan owner that has been acquired through foreclosure.
REIT SUBSIDIARY
A REIT subsidiary is a subsidiary of a REIT that is taxed as a REIT.
REIT TAXABLE INCOME
REIT taxable income is not a measure calculated in accordance with GAAP. REIT taxable income is
| THE REDWOOD REVIEW | 4TH QUARTER 2012 | 47 |
|
|
| |
|
GLOSSARY
|
pretax income calculated for tax purposes at Redwood including only its qualifying REIT subsidiaries (i.e., excluding its taxable subsidiaries). REIT taxable income is an important measure as it is the basis of our dividend distribution requirements. We must distribute at least 90% of REIT taxable income as dividends to shareholders over time. As a REIT, we are not subject to corporate income taxes on the REIT taxable income we distribute. We pay income tax on the REIT taxable income we retain, if any (and we are permitted to retain up to 10% of total REIT taxable income). A reconciliation of REIT taxable income to GAAP income appears in Table 2 in the Financial Tables in this Review.
REMIC
A real estate mortgage investment conduit (“REMIC”) is a special purpose vehicle used to pool real estate mortgages and issue mortgage-backed securities. REMICs are typically exempt from tax at the entity level. REMICs may invest only in qualified mortgages and permitted investments, including single family or multifamily mortgages, commercial mortgages, second mortgages, mortgage participations, and federal agency pass-through securities.
RE-REMIC SECURITY
A re-REMIC is a re-securitization of asset-backed securities. The cash flows from and any credit losses absorbed by the underlying assets can be redirected to the resulting re-REMIC securities in a variety of ways.
RESECURITIZATION
A resecuritization is a securitization of two or more mortgage-backed securities into a new mortgage-backed security.
RESIDENTIAL MORTGAGE-BACKED SECURITIES (RMBS)
A type of mortgage-backed security that is backed by a pool of mortgages on residential properties.
RETURN ON EQUITY (ROE) and ADJUSTED RETURN ON EQUITY
ROE is the amount of profit we generate each year per dollar of equity capital and equals GAAP income divided by GAAP equity. Adjusted ROE is not a measure calculated in accordance with GAAP — it is GAAP income divided by core equity.
SENIOR SECURITIES
Generally, senior securities have the least credit risk in a securitization transaction because they are generally the last securities to absorb credit losses. In addition, the senior securities have the highest claim on the principal and interest payments (after the fees to servicers and trustees are paid.) To further reduce credit risk, most if not all, principal collected from the underlying asset pool is used to pay down the senior securities until certain performance tests are satisfied. If certain performance tests are satisfied, principal payments are shared between the senior securities and the subordinate securities, generally on a pro rata basis. At issuance, senior securities are generally triple A-rated.
SEQUOIA
Sequoia is the brand name for securitizations of residential real estate loans Redwood sponsors. Sequoia entities are independent securitization entities that acquire residential mortgage loans and create and issue asset-backed securities (“ABS”) backed by these loans. Most of the loans that Sequoia entities acquire are prime-quality loans. Most of the senior ABS created by Sequoia are sold to third-party investors. Redwood usually acquires most of the subordinated ABS and occasionally acquires the
| 48 | THE REDWOOD REVIEW | 4TH QUARTER 2012 |
|
|
| |
|
GLOSSARY
|
interest-only securities (“IOs”).
SHORT-TERM DEBT
Short-term debt is debt that is an obligation of Redwood and payable within a year. We may obtain this debt from a variety of Wall Street firms, banks, and other institutions. We may issue these or other forms of short term debt in the future. We may use short-term debt to finance the accumulation of assets prior to sale to a securitization entity and to finance investments in loans and securities.
SUBORDINATE DEBT INVESTMENTS
Subordinate Debt Investments mean Mezzanine Loans, Preferred Equity, and B-Notes.
SUBORDINATE SECURITIES (JUNIOR SECURITIES or NON-SENIOR SECURITIES)
Subordinate securities absorb the initial credit losses from a securitization structure, thus protecting the senior securities. Subordinate securities have a lower priority to receive principal and interest payments than the senior securities. Subordinate securities receive little, if any, principal payments until certain performance tests are satisfied. If certain performance tests are satisfied, principal payments are shared between the senior securities and the subordinate securities, generally on a pro rata basis. Subordinate securities generally receive interest payments even if they do not receive principal payments. At issuance, subordinate securities are generally rated double-A or below.
SUBPRIME SECURITIES
Subprime securities are residential mortgage-backed securities backed by loans to borrowers who typically have lower credit scores and/or other credit deficiencies that prevent them from qualifying for prime or Alt-A mortgages and may have experienced credit problems in the past, such as late payments or bankruptcies. To compensate for the greater risks and higher costs to service the loans, subprime borrowers pay higher interest rates, points, and origination fees.
TAXABLE INCOME
Taxable income is not a measure calculated in accordance with GAAP. Taxable income is pre-tax income for Redwood and all its subsidiaries as calculated for tax purposes. Taxable income calculations differ significantly from GAAP income calculations. A reconciliation of taxable income to GAAP income appears in Table 2 in the Financial Tables in this Review.
TAXABLE SUBSIDIARY
A taxable subsidiary is a subsidiary of a REIT that is not taxed as a REIT and thus pays taxes on its income. A taxable subsidiary is not limited to investing in real estate and it can choose to retain all of its after-tax profits.
| THE REDWOOD REVIEW | 4TH QUARTER 2012 | 49 |
This Page Intentionally Left Blank
| 50 |


|
Table 1: GAAP Earnings ($ in thousands, except per share data) | 52
| ||
| 2012 Q4 |
2012 Q3 |
2012 Q2 |
2012 Q1 |
2011 Q4 |
2011 Q3 |
2011 Q2 |
2011 Q1 |
2010 Q4 |
Twelve Months 2012 |
Twelve Months 2011 |
||||||||||||||||||||||||||||||||||
| Interest income |
$ | 48,025 | $ | 54,001 | $ | 52,630 | $ | 51,354 | $ | 48,512 | $ | 45,096 | $ | 44,126 | $ | 44,025 | $ | 44,956 | $ | 206,010 | $ | 181,759 | ||||||||||||||||||||||
| Discount amortization on securities, net |
7,103 | 7,317 | 8,318 | 8,258 | 9,339 | 10,179 | 10,513 | 12,104 | 12,671 | 30,996 | 42,135 | |||||||||||||||||||||||||||||||||
| Premium amortization expense on loans |
(1,731 | ) | (1,595 | ) | (1,424 | ) | (872 | ) | (1,356 | ) | (1,879 | ) | (1,684 | ) | (1,796 | ) | (1,874 | ) | (5,622 | ) | (6,715 | ) | ||||||||||||||||||||||
| Total interest income |
53,397 | 59,723 | 59,524 | 58,740 | 56,495 | 53,396 | 52,955 | 54,333 | 55,753 | 231,384 | 217,179 | |||||||||||||||||||||||||||||||||
| Interest expense on short-term debt |
(2,526 | ) | (2,737 | ) | (2,299 | ) | (1,828 | ) | (764 | ) | (78 | ) | (7 | ) | (182 | ) | (43 | ) | (9,390 | ) | (1,031 | ) | ||||||||||||||||||||||
| Interest expense on ABS |
(15,106 | ) | (21,379 | ) | (22,350 | ) | (24,565 | ) | (24,030 | ) | (19,907 | ) | (19,509 | ) | (17,822 | ) | (17,800 | ) | (83,400 | ) | (81,268 | ) | ||||||||||||||||||||||
| ABS issuance expense amortization |
(915 | ) | (552 | ) | (602 | ) | (569 | ) | (630 | ) | (545 | ) | (568 | ) | (559 | ) | (370 | ) | (2,638 | ) | (2,302 | ) | ||||||||||||||||||||||
| ABS interest rate agreement expense |
(11,561 | ) | (1,127 | ) | (1,136 | ) | (1,204 | ) | (1,171 | ) | (1,233 | ) | (1,252 | ) | (1,134 | ) | (1,189 | ) | (15,028 | ) | (4,790 | ) | ||||||||||||||||||||||
| ABS issuance premium amortization (expense) income |
(412 | ) | (113 | ) | (115 | ) | (115 | ) | (136 | ) | (170 | ) | 78 | 96 | 168 | (755 | ) | (132 | ) | |||||||||||||||||||||||||
| Total ABS expense consolidated from trusts (1) |
(27,994 | ) | (23,171 | ) | (24,203 | ) | (26,453 | ) | (25,967 | ) | (21,855 | ) | (21,251 | ) | (19,419 | ) | (19,191 | ) | (101,821 | ) | (88,492 | ) | ||||||||||||||||||||||
| Interest expense on long-term debt |
(2,451 | ) | (2,377 | ) | (2,379 | ) | (2,376 | ) | (2,384 | ) | (2,384 | ) | (2,375 | ) | (2,371 | ) | (2,390 | ) | (9,583 | ) | (9,514 | ) | ||||||||||||||||||||||
| Net interest income |
20,426 | 31,438 | 30,643 | 28,083 | 27,380 | 29,079 | 29,322 | 32,361 | 34,129 | 110,590 | 118,142 | |||||||||||||||||||||||||||||||||
| (Provision for) reversal of provision for loan losses |
(3,394 | ) | (1,319 | ) | 1,340 | (275 | ) | (7,784 | ) | (3,978 | ) | (1,581 | ) | (2,808 | ) | (7,902 | ) | (3,648 | ) | (16,151 | ) | |||||||||||||||||||||||
| Other market valuation adjustments, net |
(660 | ) | (3,470 | ) | (5,465 | ) | (568 | ) | (9,682 | ) | (13,448 | ) | (11,147 | ) | (5,740 | ) | 380 | (10,163 | ) | (40,017 | ) | |||||||||||||||||||||||
| Net interest income after provision and other market valuation adjustments |
16,372 | 26,649 | 26,518 | 27,240 | 9,914 | 11,653 | 16,594 | 23,813 | 26,607 | 96,779 | 61,974 | |||||||||||||||||||||||||||||||||
| Mortgage banking activities, net |
23,887 | 16,730 | 1,771 | 4,242 | - | - | - | - | - | 46,630 | - | |||||||||||||||||||||||||||||||||
| Fixed compensation expense |
(4,275 | ) | (4,412 | ) | (4,373 | ) | (5,035 | ) | (3,799 | ) | (3,702 | ) | (3,797 | ) | (4,144 | ) | (3,402 | ) | (18,095 | ) | (15,442 | ) | ||||||||||||||||||||||
| Variable compensation expense |
(5,465 | ) | (5,593 | ) | (3,024 | ) | (2,594 | ) | (721 | ) | (863 | ) | (646 | ) | (601 | ) | (2,152 | ) | (16,676 | ) | (2,831 | ) | ||||||||||||||||||||||
| Equity compensation expense |
(2,499 | ) | (2,151 | ) | (2,958 | ) | (2,176 | ) | (2,371 | ) | (1,929 | ) | (2,707 | ) | (2,060 | ) | (1,710 | ) | (9,784 | ) | (9,067 | ) | ||||||||||||||||||||||
| Other operating expense |
(6,131 | ) | (4,946 | ) | (4,809 | ) | (4,829 | ) | (5,683 | ) | (5,013 | ) | (4,937 | ) | (4,709 | ) | (5,673 | ) | (20,715 | ) | (20,342 | ) | ||||||||||||||||||||||
| Total operating expenses |
(18,370 | ) | (17,102 | ) | (15,164 | ) | (14,634 | ) | (12,574 | ) | (11,507 | ) | (12,087 | ) | (11,514 | ) | (12,937 | ) | (65,270 | ) | (47,682 | ) | ||||||||||||||||||||||
| Realized gains on sales, net (2) |
20,336 | 13,940 | 6,995 | 13,508 | - | 313 | 5,433 | 3,956 | 786 | 54,779 | 9,702 | |||||||||||||||||||||||||||||||||
| Realized gains (losses) on calls, net |
29 | - | - | 113 | 102 | 832 | 401 | (91 | ) | 726 | 142 | 1,244 | ||||||||||||||||||||||||||||||||
| Realized gains, net |
20,365 | 13,940 | 6,995 | 13,621 | 102 | 1,145 | 5,834 | 3,865 | 1,512 | 54,921 | 10,946 | |||||||||||||||||||||||||||||||||
| Noncontrolling interest |
- | - | - | - | - | 20 | (888 | ) | 2,015 | (447 | ) | - | 1,147 | |||||||||||||||||||||||||||||||
| Provision for income taxes |
(176 | ) | (516 | ) | (592 | ) | (7 | ) | - | (14 | ) | (14 | ) | (14 | ) | (26 | ) | (1,291 | ) | (42 | ) | |||||||||||||||||||||||
| Net income (loss) |
$ | 42,078 | $ | 39,701 | $ | 19,528 | $ | 30,462 | $ | (2,558 | ) | $ | 1,297 | $ | 9,439 | $ | 18,165 | $ | 14,709 | $ | 131,769 | $ | 26,343 | |||||||||||||||||||||
| Diluted average shares |
82,498 | 80,764 | 78,815 | 79,892 | 78,370 | 78,471 | 79,478 | 79,372 | 78,944 | 80,674 | 78,300 | |||||||||||||||||||||||||||||||||
| Net income (loss) per share |
$ | 0.50 | $ | 0.48 | $ | 0.24 | $ | 0.37 | $ | (0.03 | ) | $ | 0.01 | $ | 0.11 | $ | 0.22 | $ | 0.18 | $ | 1.59 | $ | 0.31 | |||||||||||||||||||||
(1) Interest expense on ABS issued for the fourth quarter of 2012 includes accelerated recognition of $11 million of deferred hedging costs relating to Acacia entities upon deconsolidation of these entities.
(2) Realized gains on sales, net includes $15 million of gains related to the deconsolidation of certain Sequoia and Acacia entities during the fourth quarter of 2012.
| THE REDWOOD REVIEW 4TH QUARTER 2012
|
Table 1: GAAP Earnings | |||
|
|
Table 2: Taxable and GAAP Income (Loss)1 Differences and Dividends ($ in thousands, except per share data) | |||
| Estimated Twelve Months 2012 (2) | Actual Twelve Months 2011 | Actual Twelve Months 2010 | ||||||||||||||||||||||||||||||||||
| Taxable Income |
GAAP Income |
Differences | Taxable Income |
GAAP Income |
Differences | Taxable (Loss) Income |
GAAP Income |
Differences | ||||||||||||||||||||||||||||
| Taxable and GAAP Income (Loss) Differences |
||||||||||||||||||||||||||||||||||||
| Interest income |
$ | 161,976 | $ | 231,384 | $ | (69,408 | ) | $ | 128,334 | $ | 217,179 | $ | (88,845 | ) | $ | 136,750 | $ | 230,054 | $ | (93,304 | ) | |||||||||||||||
| Interest expense |
(25,168 | ) | (120,794 | ) | 95,626 | (15,804 | ) | (99,037 | ) | 83,233 | (8,545 | ) | (84,664 | ) | 76,119 | |||||||||||||||||||||
| Net interest income |
136,808 | 110,590 | 26,218 | 112,530 | 118,142 | (5,612 | ) | 128,205 | 145,390 | (17,185 | ) | |||||||||||||||||||||||||
| Provision for loan losses |
- | (3,648 | ) | 3,648 | - | (16,151 | ) | 16,151 | - | (24,135 | ) | 24,135 | ||||||||||||||||||||||||
| Realized credit losses |
(25,609 | ) | - | (25,609 | ) | (57,526 | ) | - | (57,526 | ) | (99,586 | ) | - | (99,586 | ) | |||||||||||||||||||||
| Other market valuation adjustments, net |
- | (10,163 | ) | 10,163 | - | (40,017 | ) | 40,017 | - | (19,554 | ) | 19,554 | ||||||||||||||||||||||||
| Mortgage banking activities, net |
222 | 46,630 | (46,408 | ) | - | - | - | - | - | - | ||||||||||||||||||||||||||
| Operating expenses |
(56,174 | ) | (65,270 | ) | 9,096 | (45,166 | ) | (47,682 | ) | 2,516 | (44,804 | ) | (53,715 | ) | 8,911 | |||||||||||||||||||||
| Realized gains, net |
- | 54,921 | (54,921 | ) | - | 10,946 | (10,946 | ) | 230 | 63,496 | (63,266 | ) | ||||||||||||||||||||||||
| Provision for income taxes |
(90 | ) | (1,291 | ) | 1,201 | (16 | ) | (42 | ) | 26 | (8 | ) | (280 | ) | 272 | |||||||||||||||||||||
| Less: Net (loss) income attributable to noncontrolling interest |
- | - | - | - | (1,147 | ) | 1,147 | - | 1,150 | (1,150 | ) | |||||||||||||||||||||||||
| Income (Loss) |
$ | 55,157 | $ | 131,769 | $ | (76,612 | ) | $ | 9,822 | $ | 26,343 | $ | (16,521 | ) | $ | (15,963 | ) | $ | 110,052 | $ | (126,015 | ) | ||||||||||||||
| REIT taxable income |
$ | 61,742 | $ | 19,543 | $ | 3,383 | ||||||||||||||||||||||||||||||
| Taxable loss at taxable subsidiaries |
(6,585 | ) | (9,721 | ) | (19,346 | ) | ||||||||||||||||||||||||||||||
| Taxable income (loss) |
$ | 55,157 | $ | 9,822 | $ | (15,963 | ) | |||||||||||||||||||||||||||||
| Shares used for taxable EPS calculation |
81,716 | 78,556 | 78,041 | |||||||||||||||||||||||||||||||||
| REIT taxable income per share (3) |
$ | 0.77 | $ | 0.24 | $ | 0.05 | ||||||||||||||||||||||||||||||
| Taxable loss at taxable subsidiaries per share |
$ | (0.08 | ) | $ | (0.12 | ) | $ | (0.25 | ) | |||||||||||||||||||||||||||
| Taxable income (loss) per share (3) |
$ | 0.69 | $ | 0.12 | $ | (0.20 | ) | |||||||||||||||||||||||||||||
| Dividends |
||||||||||||||||||||||||||||||||||||
| Dividends declared |
$ | 80,134 | $ | 78,382 | $ | 77,942 | ||||||||||||||||||||||||||||||
| Regular dividend per share (4) |
$ | 1.00 | $ | 1.00 | $ | 1.00 | ||||||||||||||||||||||||||||||
(1) Taxable income (loss) for 2012 is an estimate until we file our tax returns.
(2) Reconciliation of GAAP income to taxable income (loss) for prior quarters is provided in the respective Redwood Reviews for those quarters.
(3) REIT taxable income per share and taxable income (loss) per share are based on the number of shares outstanding at the end of each quarter. The annual REIT taxable income per share and taxable income (loss) per share are the sum of the four quarterly per share estimates.
(4) Dividends in 2012 are expected to be characterized as 77% ordinary income, or $62 million, and 23% return of capital, or $18 million. Dividends in 2011 were characterized as 25% ordinary income, or $19 million, and 75% return of capital, or $59 million. Dividends in 2010 were characterized as 62% ordinary income, or $48 million, and 38% return of capital, or $30 million. The portion of Redwood’s dividends characterized as a return of capital is not taxable to a shareholder and reduces a shareholder’s basis for shares held at each quarterly distribution date, but not to below $0.
| THE REDWOOD REVIEW 4TH QUARTER 2012
|
Table 2: Taxable and GAAP Income (Loss) Differences and Dividends |
53
| ||
|
|
Table 3: Book Value and Financial Ratios ($ in millions, except per share data) | 54
| ||
| 2012 Q4 |
2012 Q3 |
2012 Q2 |
2012 Q1 |
2011 Q4 |
2011 Q3 |
2011 Q2 |
2011 Q1 |
2010 Q4 |
||||||||||||||||||||||||||||
| Short-term debt |
$ | 552 | $ | 522 | $ | 455 | $ | 441 | $ | 428 | $ | - | $ | 41 | $ | - | $ | 44 | ||||||||||||||||||
| Long-term debt |
140 | 140 | 140 | 140 | 140 | 140 | 140 | 140 | 140 | |||||||||||||||||||||||||||
| Redwood debt (1) |
$ | 692 | $ | 662 | $ | 595 | $ | 581 | $ | 568 | $ | 140 | $ | 181 | $ | 140 | $ | 184 | ||||||||||||||||||
| ABS obligations of consolidated securitization entities (including the Residential Resecuritization and Commercial Securitization) |
2,530 | 3,429 | 3,564 | 3,704 | 4,139 | 4,293 | 3,839 | 3,957 | 3,943 | |||||||||||||||||||||||||||
| Consolidated GAAP Debt |
$ | 3,222 | $ | 4,091 | $ | 4,159 | $ | 4,285 | $ | 4,707 | $ | 4,433 | $ | 4,020 | $ | 4,097 | $ | 4,127 | ||||||||||||||||||
| GAAP stockholders’ equity |
$ | 1,140 | $ | 1,050 | $ | 951 | $ | 962 | $ | 893 | $ | 959 | $ | 1,025 | $ | 1,075 | $ | 1,065 | ||||||||||||||||||
| Redwood debt to equity |
0.6x | 0.6x | 0.6x | 0.6x | 0.6x | 0.1x | 0.2x | 0.1x | 0.2x | |||||||||||||||||||||||||||
| Redwood debt to (equity + debt) |
38% | 39% | 38% | 38% | 39% | 13% | 15% | 12% | 15% | |||||||||||||||||||||||||||
| Consolidated GAAP Debt to equity |
2.8x | 3.9x | 4.4x | 4.5x | 5.3x | 4.6x | 3.9x | 3.8x | 3.7x | |||||||||||||||||||||||||||
| Consolidated GAAP Debt to (equity + GAAP debt) |
74% | 80% | 81% | 82% | 84% | 82% | 80% | 79% | 79% | |||||||||||||||||||||||||||
| GAAP stockholders’ equity |
$ | 1,140 | $ | 1,050 | $ | 951 | $ | 962 | $ | 893 | $ | 959 | $ | 1,025 | $ | 1,075 | $ | 1,065 | ||||||||||||||||||
| Balance sheet mark-to-market adjustments |
138 | 74 | 28 | 42 | (13 | ) | 32 | 81 | 122 | 112 | ||||||||||||||||||||||||||
| Core equity (non-GAAP) |
$ | 1,002 | $ | 976 | $ | 923 | $ | 920 | $ | 906 | $ | 927 | $ | 944 | $ | 953 | $ | 953 | ||||||||||||||||||
| Shares outstanding at period end (in thousands) |
81,716 | 81,526 | 79,263 | 78,756 | 78,556 | 78,495 | 78,555 | 78,139 | 78,125 | |||||||||||||||||||||||||||
| GAAP equity per share |
$ | 13.95 | $ | 12.88 | $ | 12.00 | $ | 12.22 | $ | 11.36 | $ | 12.22 | $ | 13.04 | $ | 13.76 | $ | 13.63 | ||||||||||||||||||
| Adjustments: GAAP equity to estimated economic value (2) |
||||||||||||||||||||||||||||||||||||
| Investments in Consolidated Entities |
0.01 | 0.08 | 0.09 | 0.10 | 0.07 | 0.06 | (0.01 | ) | (0.06 | ) | (0.16 | ) | ||||||||||||||||||||||||
| Long-term debt |
0.60 | 0.72 | 0.85 | 0.93 | 1.06 | 1.06 | 0.78 | 0.75 | 0.84 | |||||||||||||||||||||||||||
| ABS issued - Residential Resecuritization |
(0.09 | ) | (0.06 | ) | (0.07 | ) | (0.07 | ) | (0.04 | ) | (0.01 | ) | - | - | - | |||||||||||||||||||||
| ABS issued - Commercial Securitization |
0.01 | - | - | - | - | - | - | - | - | |||||||||||||||||||||||||||
| Estimate of economic value per share (non-GAAP) | $ | 14.48 | $ | 13.62 | $ | 12.87 | $ | 13.18 | $ | 12.45 | $ | 13.33 | $ | 13.81 | $ | 14.45 | $ | 14.31 | ||||||||||||||||||
(1) Excludes obligations of consolidated securitization entities, the residential resecuritization we engaged in during the third quarter of 2011, and the commercial securitization we engaged in during the fourth quarter of 2012.
(2) Differences between GAAP and economic value per share reflect our estimate of the economic value of investments in Consolidated Entities, our long-term debt, ABS issued - Residential Resecuritization. and ABS issued - Commercial Securitization. See pages 16 and 18 for an explanation of these adjustments. In reviewing the components of book value and economic value, there are a number of important factors and limitations to consider. Book value and economic value are calculated as of particular points in time based on our existing assets and liabilities and do not incorporate other factors that may have a significant impact on that value, most notably the impact of future business activities. As a result, these values do not necessarily represent an estimate of our net realizable value, liquidation value, or our market value as a whole. Amounts we ultimately realize from the disposition of assets or settlement of liabilities may vary significantly from these values. Because temporary changes in market conditions can substantially affect value, we do not believe that short-term fluctuations in the value of our assets and liabilities are necessarily representative of the effectiveness of our investment strategy or the long-term underlying value of our business. When quoted market prices or observable market data are not available to estimate fair value, we rely on unobservable inputs, which are generally more subjective and involve a high degree of management judgment and assumptions. These assumptions may have a significant effect on our estimates of value, and the use of different assumptions as well as changes in market conditions could have a material effect on our results of operations or financial condition.
| THE REDWOOD REVIEW 4TH QUARTER 2012
|
Table 3: Book Value and Financial Ratios | |||

|
Table 4: Yields and Profitability Ratios1 ($ in thousands) | |||
| 2012 Q4 (2) |
2012 Q3 |
2012 Q2 |
2012 Q1 |
2011 Q4 |
2011 Q3 |
2011 Q2 |
2011 Q1 |
2010 Q4 |
Twelve 2012 |
Twelve 2011 |
||||||||||||||||||||||||||||||||||
| Interest income |
$ | 53,397 | $ | 59,723 | $ | 59,524 | $ | 58,740 | $ | 56,495 | $ | 53,396 | $ | 52,955 | $ | 54,333 | $ | 55,753 | $ | 231,384 | $ | 217,179 | ||||||||||||||||||||||
| Average consolidated earning assets |
$ | 4,851,672 | $ | 5,176,791 | $ | 5,144,382 | $ | 5,351,918 | $ | 5,419,721 | $ | 5,143,814 | $ | 5,080,343 | $ | 5,107,979 | $ | 4,980,935 | $ | 5,130,551 | $ | 5,181,515 | ||||||||||||||||||||||
| Asset yield |
4.40% | 4.61% | 4.63% | 4.39% | 4.17% | 4.15% | 4.17% | 4.25% | 4.48% | 4.51% | 4.19% | |||||||||||||||||||||||||||||||||
| Interest expense |
$ | (32,971 | ) | $ | (28,285 | ) | $ | (28,881 | ) | $ | (30,657 | ) | $ | (29,115 | ) | $ | (24,317 | ) | $ | (23,633 | ) | $ | (21,972 | ) | $ | (21,624 | ) | $ | (120,794 | ) | $ | (99,037 | ) | |||||||||||
| Average consolidated interest-bearing liabilities |
$ | 3,727,576 | $ | 4,166,828 | $ | 4,207,316 | $ | 4,423,167 | $ | 4,481,303 | $ | 4,105,088 | $ | 4,025,216 | $ | 3,977,010 | $ | 3,937,895 | $ | 4,130,217 | $ | 4,148,421 | ||||||||||||||||||||||
| Cost of funds |
3.54% | 2.72% | 2.75% | 2.77% | 2.60% | 2.37% | 2.35% | 2.21% | 2.20% | 2.92% | 2.39% | |||||||||||||||||||||||||||||||||
| Asset yield |
4.40% | 4.61% | 4.63% | 4.39% | 4.17% | 4.15% | 4.17% | 4.25% | 4.48% | 4.51% | 4.19% | |||||||||||||||||||||||||||||||||
| Cost of funds |
(3.54% | ) | (2.72% | ) | (2.75% | ) | (2.77% | ) | (2.60% | ) | (2.37% | ) | (2.35% | ) | (2.21% | ) | (2.20% | ) | (2.92% | ) | (2.39% | ) | ||||||||||||||||||||||
| Interest rate spread |
0.86% | 1.90% | 1.88% | 1.62% | 1.57% | 1.78% | 1.82% | 2.04% | 2.28% | 1.59% | 1.80% | |||||||||||||||||||||||||||||||||
| Net interest income |
$ | 20,426 | $ | 31,438 | $ | 30,643 | $ | 28,083 | $ | 27,380 | $ | 29,079 | $ | 29,322 | $ | 32,361 | $ | 34,129 | $ | 110,590 | $ | 118,142 | ||||||||||||||||||||||
| Average consolidated earning assets |
$ | 4,851,672 | $ | 5,176,791 | $ | 5,144,382 | $ | 5,351,918 | $ | 5,419,721 | $ | 5,143,814 | $ | 5,080,343 | $ | 5,107,979 | $ | 4,980,935 | $ | 5,130,551 | $ | 5,181,515 | ||||||||||||||||||||||
| Net interest margin |
1.68% | 2.43% | 2.38% | 2.10% | 2.02% | 2.26% | 2.31% | 2.53% | 2.74% | 2.16% | 2.28% | |||||||||||||||||||||||||||||||||
| Net interest income |
$ | 20,426 | $ | 31,438 | $ | 30,643 | $ | 28,083 | $ | 27,380 | $ | 29,079 | $ | 29,322 | $ | 32,361 | $ | 34,129 | $ | 110,590 | $ | 118,142 | ||||||||||||||||||||||
| Net interest income / average core equity |
8.26% | 13.34% | 13.30% | 12.29% | 12.05% | 12.63% | 12.55% | 13.42% | 14.25% | 11.74% | 12.68% | |||||||||||||||||||||||||||||||||
| Operating expenses |
$ | (18,370 | ) | $ | (17,102 | ) | $ | (15,164 | ) | $ | (14,634 | ) | $ | (12,574 | ) | $ | (11,507 | ) | $ | (12,087 | ) | $ | (11,514 | ) | $ | (12,937 | ) | $ | (65,270 | ) | $ | (47,682 | ) | |||||||||||
| Average total assets |
$ | 5,090,254 | $ | 5,371,679 | $ | 5,307,961 | $ | 5,505,797 | $ | 5,577,206 | $ | 5,303,614 | $ | 5,263,529 | $ | 5,310,376 | $ | 5,141,550 | $ | 5,318,441 | $ | 5,357,065 | ||||||||||||||||||||||
| Average total equity |
$ | 1,088,565 | $ | 987,692 | $ | 945,805 | $ | 926,138 | $ | 912,051 | $ | 976,676 | $ | 1,035,063 | $ | 1,092,580 | $ | 1,038,045 | $ | 987,329 | $ | 1,003,523 | ||||||||||||||||||||||
| Operating expenses / net interest income |
89.93% | 54.40% | 49.49% | 52.11% | 45.92% | 39.57% | 41.22% | 35.58% | 37.91% | 59.02% | 40.36% | |||||||||||||||||||||||||||||||||
| Operating expenses / average total assets |
1.44% | 1.27% | 1.14% | 1.06% | 0.90% | 0.87% | 0.92% | 0.87% | 1.01% | 1.23% | 0.89% | |||||||||||||||||||||||||||||||||
| Operating expenses / average total equity |
6.75% | 6.93% | 6.41% | 6.32% | 5.51% | 4.71% | 4.67% | 4.22% | 4.99% | 6.61% | 4.75% | |||||||||||||||||||||||||||||||||
| GAAP net income (loss) |
$ | 42,078 | $ | 39,701 | $ | 19,528 | $ | 30,462 | $ | (2,558 | ) | $ | 1,297 | $ | 9,439 | $ | 18,165 | $ | 14,709 | $ | 131,769 | $ | 26,343 | |||||||||||||||||||||
| GAAP net income (loss) / average total assets |
3.31% | 2.96% | 1.47% | 2.21% | (0.18% | ) | 0.10% | 0.72% | 1.37% | 1.14% | 2.48% | 0.49% | ||||||||||||||||||||||||||||||||
| GAAP net income (loss) / average equity (GAAP ROE) |
15.46% | 16.08% | 8.26% | 13.16% | (1.12% | ) | 0.53% | 3.65% | 6.65% | 5.67% | 13.35% | 2.63% | ||||||||||||||||||||||||||||||||
| GAAP net income (loss) / average core equity (adjusted ROE) (2) |
17.03% | 16.84% | 8.48% | 13.33% | (1.13% | ) | 0.56% | 4.04% | 7.53% | 6.14% | 13.99% | 2.83% | ||||||||||||||||||||||||||||||||
| Average core equity (3) |
$ | 988,564 | $ | 942,846 | $ | 921,663 | $ | 914,052 | $ | 908,915 | $ | 921,048 | $ | 934,205 | $ | 964,554 | $ | 958,194 | $ | 941,912 | $ | 931,998 | ||||||||||||||||||||||
(1) All percentages in this table are shown on an annualized basis.
(2) Included in the net income for fourth quarter of 2012 is a net $4 million gain related to the deconsolidation of certain Acacia and Sequoia entities. Interest expense for the fourth quarter of 2012 includes accelerated recognition of $11 million of deferred hedging costs relating the Acacia entities upon the deconsolidation of these entities. Realized gains, net, includes $15 million of gains related to the deconsolidation of the certain Acacia and Sequoia entities.
(3) Core equity is a non-GAAP metric and is equal to GAAP equity excluding accumulated other comprehensive income (loss).
| THE REDWOOD REVIEW 4TH QUARTER 2012
|
Table 4: Yields and Profitability Ratios |
55
| ||
|
|
Table 5: Average Balance Sheet ($ in thousands) | 56
| ||
| 2012 Q4 |
2012 Q3 |
2012 Q2 |
2012 Q1 |
2011 Q4 |
2011 Q3 |
2011 Q2 |
2011 Q1 |
2010 Q4 |
Twelve 2012 |
Twelve 2011 |
||||||||||||||||||||||||||||||||||
| Real estate assets at Redwood |
||||||||||||||||||||||||||||||||||||||||||||
| Commercial loans |
$ | 296,990 | $ | 267,032 | $ | 199,440 | $ | 169,432 | $ | 123,367 | $ | 79,445 | $ | 59,545 | $ | 36,434 | $ | 14,095 | $ | 233,490 | $ | 74,949 | ||||||||||||||||||||||
| Commercial loans - HFS |
6,886 | - | - | - | - | - | - | - | - | 1,731 | - | |||||||||||||||||||||||||||||||||
| Residential loans |
418,722 | 466,246 | 363,882 | 319,353 | 306,869 | 313,763 | 123,914 | 204,847 | 169,691 | 392,326 | 237,837 | |||||||||||||||||||||||||||||||||
| Senior residential securities |
||||||||||||||||||||||||||||||||||||||||||||
| Prime |
427,149 | 447,994 | 457,549 | 325,619 | 248,211 | 244,502 | 246,957 | 255,884 | 262,048 | 414,703 | 248,856 | |||||||||||||||||||||||||||||||||
| Non-prime |
243,336 | 236,006 | 262,084 | 280,970 | 280,066 | 283,043 | 283,784 | 307,253 | 321,655 | 255,512 | 288,447 | |||||||||||||||||||||||||||||||||
| Total senior residential securities |
670,485 | 684,000 | 719,633 | 606,589 | 528,277 | 527,545 | 530,741 | 563,137 | 583,703 | 670,215 | 537,303 | |||||||||||||||||||||||||||||||||
| Residential Re-REMIC securities |
99,088 | 99,890 | 105,281 | 87,001 | 74,560 | 41,598 | 30,447 | 32,648 | 32,917 | 97,824 | 44,919 | |||||||||||||||||||||||||||||||||
| Subordinate residential securities |
||||||||||||||||||||||||||||||||||||||||||||
| Prime |
153,223 | 118,549 | 104,078 | 81,253 | 69,477 | 72,199 | 63,141 | 53,046 | 45,914 | 114,394 | 64,532 | |||||||||||||||||||||||||||||||||
| Non-prime |
3,783 | 6,669 | 8,325 | 9,721 | 11,433 | 10,885 | 11,183 | 12,140 | 11,890 | 7,114 | 11,407 | |||||||||||||||||||||||||||||||||
| Total subordinate residential securities |
157,006 | 125,218 | 112,403 | 90,974 | 80,910 | 83,084 | 74,324 | 65,186 | 57,804 | 121,508 | 75,939 | |||||||||||||||||||||||||||||||||
| Commercial subordinate securities |
2,154 | 4,047 | 3,980 | 3,946 | 4,272 | 4,720 | 5,200 | 6,288 | 6,948 | 3,529 | 5,114 | |||||||||||||||||||||||||||||||||
| CDO |
4 | 14 | 14 | 762 | 960 | 1,247 | 1,297 | 1,252 | 973 | 198 | 1,188 | |||||||||||||||||||||||||||||||||
| Total real estate assets at Redwood |
1,651,335 | 1,646,447 | 1,504,633 | 1,278,057 | 1,119,215 | 1,051,402 | 825,468 | 909,792 | 866,131 | 1,520,821 | 977,249 | |||||||||||||||||||||||||||||||||
| Earning assets at Acacia |
171,651 | 270,891 | 262,959 | 252,907 | 255,801 | 285,985 | 315,039 | 347,786 | 311,949 | 239,502 | 293,677 | |||||||||||||||||||||||||||||||||
| Earning assets at Consolidated Sequoia |
2,751,130 | 3,128,076 | 3,258,137 | 3,597,081 | 3,838,327 | 3,600,122 | 3,684,680 | 3,576,778 | 3,587,904 | 3,182,273 | 3,675,488 | |||||||||||||||||||||||||||||||||
| Earning assets at the Fund (1) |
- | - | - | - | - | - | 4,948 | 22,280 | 33,001 | - | 6,727 | |||||||||||||||||||||||||||||||||
| Total earning assets at Other Consolidated Entities |
2,922,781 | 3,398,967 | 3,521,096 | 3,849,988 | 4,094,128 | 3,886,107 | 4,004,667 | 3,946,844 | 3,932,854 | 3,421,775 | 3,975,892 | |||||||||||||||||||||||||||||||||
| Cash and cash equivalents |
177,555 | 86,531 | 94,511 | 211,786 | 203,242 | 150,677 | 149,350 | 123,317 | 102,099 | 142,538 | 156,849 | |||||||||||||||||||||||||||||||||
| Earning assets |
4,751,671 | 5,131,945 | 5,120,240 | 5,339,831 | 5,416,585 | 5,088,186 | 4,979,485 | 4,979,953 | 4,901,084 | 5,085,134 | 5,109,990 | |||||||||||||||||||||||||||||||||
| Balance sheet mark-to-market adjustments |
100,001 | 44,846 | 24,142 | 12,087 | 3,136 | 55,628 | 100,858 | 128,026 | 79,851 | 45,417 | 71,525 | |||||||||||||||||||||||||||||||||
| Earning assets - reported value |
4,851,672 | 5,176,791 | 5,144,382 | 5,351,918 | 5,419,721 | 5,143,814 | 5,080,343 | 5,107,979 | 4,980,935 | 5,130,551 | 5,181,515 | |||||||||||||||||||||||||||||||||
| Other assets |
238,582 | 194,888 | 163,579 | 153,879 | 157,485 | 159,800 | 183,186 | 202,397 | 160,615 | 187,890 | 175,550 | |||||||||||||||||||||||||||||||||
| Total assets |
$ | 5,090,254 | $ | 5,371,679 | $ | 5,307,961 | $ | 5,505,797 | $ | 5,577,206 | $ | 5,303,614 | $ | 5,263,529 | $ | 5,310,376 | $ | 5,141,550 | $ | 5,318,441 | $ | 5,357,065 | ||||||||||||||||||||||
| Short-term debt |
$ | 539,579 | $ | 570,775 | $ | 474,053 | $ | 362,107 | $ | 157,992 | $ | 18,116 | $ | 1,797 | $ | 47,976 | $ | 11,265 | $ | 487,003 | $ | 56,667 | ||||||||||||||||||||||
| Secured borrowings |
3,052 | - | - | - | - | - | - | - | - | 767 | - | |||||||||||||||||||||||||||||||||
| Consolidated Sequoia ABS issued |
2,661,564 | 3,039,273 | 3,166,476 | 3,504,155 | 3,738,132 | 3,510,089 | 3,589,286 | 3,487,214 | 3,513,293 | 3,091,543 | 3,581,673 | |||||||||||||||||||||||||||||||||
| Resecuritization ABS issued -Residential |
168,634 | 182,702 | 196,837 | 210,360 | 222,652 | 180,769 | - | - | - | 189,557 | 101,684 | |||||||||||||||||||||||||||||||||
| Securitization ABS issued -Commercial |
61,830 | - | - | - | - | - | - | - | - | 15,542 | - | |||||||||||||||||||||||||||||||||
| Acacia ABS issued |
154,617 | 235,789 | 231,673 | 208,281 | 224,273 | 257,872 | 295,902 | 303,601 | 274,630 | 207,522 | 270,160 | |||||||||||||||||||||||||||||||||
| Other liabilities |
274,112 | 217,159 | 154,840 | 156,492 | 183,852 | 221,592 | 200,708 | 232,062 | 151,332 | 200,897 | 202,272 | |||||||||||||||||||||||||||||||||
| Long-term debt |
138,300 | 138,289 | 138,277 | 138,264 | 138,254 | 138,242 | 138,231 | 138,219 | 138,707 | 138,283 | 138,237 | |||||||||||||||||||||||||||||||||
| Total liabilities |
4,001,688 | 4,383,987 | 4,362,156 | 4,579,659 | 4,665,155 | 4,326,680 | 4,225,924 | 4,209,072 | 4,089,227 | 4,331,114 | 4,350,693 | |||||||||||||||||||||||||||||||||
| Noncontrolling interest |
- | - | - | - | - | 258 | 2,542 | 8,724 | 14,278 | - | 2,849 | |||||||||||||||||||||||||||||||||
| Core equity (2) |
988,564 | 942,846 | 921,663 | 914,052 | 908,915 | 921,048 | 934,205 | 964,554 | 958,194 | 941,912 | 931,998 | |||||||||||||||||||||||||||||||||
| Accumulated other comprehensive income |
100,001 | 44,846 | 24,142 | 12,086 | 3,136 | 55,628 | 100,858 | 128,026 | 79,851 | 45,417 | 71,525 | |||||||||||||||||||||||||||||||||
| Total equity
|
1,088,565 | 987,692 | 945,805 | 926,138 | 912,051 | 976,676 | 1,035,063 | 1,092,580 | 1,038,045 | 987,329 | 1,003,523 | |||||||||||||||||||||||||||||||||
| Total liabilities and equity |
$ | 5,090,253 | $ | 5,371,679 | $ | 5,307,961 | $ | 5,505,797 | $ | 5,577,206 | $ | 5,303,614 | $ | 5,263,529 | $ | 5,310,376 | $ | 5,141,550 | $ | 5,318,443 | $ | 5,357,065 | ||||||||||||||||||||||
(1) Refers to the Redwood Opportunity Fund, which liquidated in the third quarter of 2011.
(2) Core equity is a non-GAAP metric and is equal to GAAP equity excluding accumulated other comprehensive income.
| THE REDWOOD REVIEW 4TH QUARTER 2012
|
Table 5: Average Balance Sheet | |||
|
|
Table 6: Balances & Yields by Securities Portfolio at Redwood1 ($ in thousands) | |||
|
2012 Q4 |
2012 Q3 |
2012 Q2 |
2012 Q1 |
2011 Q4 |
2011 Q3 |
2012 Q4 |
2012 Q3 |
2012 Q2 |
2012 Q1 |
2011 Q4 |
2011 Q3 |
|||||||||||||||||||||||||||||||||||||||||
| Residential Prime Senior |
|
Residential Non-Prime Subordinate |
|
|||||||||||||||||||||||||||||||||||||||||||||||||
| Principal balance |
$ | 485,033 | $ | 517,737 | $ | 540,032 | $ | 490,141 | $ | 341,780 | $ | 329,466 | Principal balance |
$ | 20,194 | $ | 30,221 | $ | 33,194 | $ | 34,432 | $ | 41,978 | $ | 38,187 | |||||||||||||||||||||||||||
| Unamortized discount |
(43,192 | ) | (53,531 | ) | (36,385 | ) | (35,328 | ) | (58,424 | ) | (59,415 | ) | Unamortized discount |
(15,666 | ) | (19,309 | ) | (19,650 | ) | (19,406 | ) | (21,479 | ) | (19,752 | ) | |||||||||||||||||||||||||||
| Credit reserve |
(26,100 | ) | (22,657 | ) | (34,990 | ) | (31,011 | ) | (27,806 | ) | (28,330 | ) | Credit reserve |
(2,433 | ) | (4,582 | ) | (5,299 | ) | (6,566 | ) | (8,477 | ) | (7,639 | ) | |||||||||||||||||||||||||||
| Unrealized gains, net |
61,191 | 55,161 | 38,446 | 34,846 | 22,690 | 35,204 | Unrealized (losses) gains, net |
226 | 225 | (275 | ) | (231 | ) | (739 | ) | (180 | ) | |||||||||||||||||||||||||||||||||||
| Fair value |
$ | 476,932 | $ | 496,710 | $ | 507,103 | $ | 458,648 | $ | 278,240 | $ | 276,925 | Fair value |
$ | 2,321 | $ | 6,555 | $ | 7,970 | $ | 8,229 | $ | 11,283 | $ | 10,616 | |||||||||||||||||||||||||||
| Average amortized cost |
$ | 427,149 | $ | 447,994 | $ | 457,550 | $ | 325,619 | $ | 248,211 | $ | 244,502 | Average amortized cost |
$ | 3,783 | $ | 6,669 | $ | 8,325 | $ | 9,722 | $ | 11,432 | $ | 10,885 | |||||||||||||||||||||||||||
| Interest income |
$ | 9,113 | $ | 9,620 | $ | 10,180 | $ | 7,897 | $ | 6,651 | $ | 6,894 | Interest income |
$ | 266 | $ | 446 | $ | 426 | $ | 500 | $ | 519 | $ | 522 | |||||||||||||||||||||||||||
| Annualized yield |
8.53% | 8.59% | 8.90% | 9.70% | 10.72% | 11.28% | Annualized yield |
28.13% | 26.75% | 20.47% | 20.57% | 18.16% | 19.19% | |||||||||||||||||||||||||||||||||||||||
| Residential Non-Prime Senior |
|
Commercial Subordinate |
|
|||||||||||||||||||||||||||||||||||||||||||||||||
| Principal balance |
$ | 278,229 | $ | 287,877 | $ | 312,897 | $ | 329,181 | $ | 349,385 | $ | 357,809 | Principal balance |
$ | 29,331 | $ | 40,342 | $ | 42,602 | $ | 43,226 | $ | 50,499 | $ | 54,061 | |||||||||||||||||||||||||||
| Unamortized discount |
(20,708 | ) | (23,389 | ) | (37,378 | ) | (48,425 | ) | (55,053 | ) | (50,609 | ) | Unamortized discount |
(3,362 | ) | (3,509 | ) | (5,532 | ) | (5,651 | ) | (3,554 | ) | (2,551 | ) | |||||||||||||||||||||||||||
| Credit reserve |
(18,104 | ) | (17,046 | ) | (18,891 | ) | (15,829 | ) | (16,536 | ) | (24,663 | ) | Credit reserve |
(23,916 | ) | (33,206 | ) | (33,013 | ) | (33,668 | ) | (43,012 | ) | (47,197 | ) | |||||||||||||||||||||||||||
| Unrealized (losses) gains, net |
27,983 | 15,370 | 8,342 | 10,027 | (1,464 | ) | 16,380 | Unrealized gains, net |
12,016 | 3,992 | 1,704 | 1,931 | 1,512 | 1,574 | ||||||||||||||||||||||||||||||||||||||
| Fair value |
$ | 267,400 | $ | 262,812 | $ | 264,970 | $ | 274,954 | $ | 276,332 | $ | 298,917 | Fair value |
$ | 14,069 | $ | 7,619 | $ | 5,761 | $ | 5,838 | $ | 5,445 | $ | 5,887 | |||||||||||||||||||||||||||
| Average amortized cost |
$ | 243,336 | $ | 236,006 | $ | 262,084 | $ | 280,970 | $ | 280,066 | $ | 283,043 | Average amortized cost |
$ | 2,154 | $ | 4,047 | $ | 3,980 | $ | 3,946 | $ | 4,272 | $ | 4,720 | |||||||||||||||||||||||||||
| Interest income |
$ | 6,248 | $ | 6,286 | $ | 7,264 | $ | 7,693 | $ | 8,224 | $ | 9,118 | Interest income |
$ | 230 | $ | 643 | $ | 605 | $ | 480 | $ | 377 | $ | 553 | |||||||||||||||||||||||||||
| Annualized yield |
10.27% | 10.65% | 11.09% | 10.95% | 11.75% | 12.89% | Annualized yield |
42.71% | 63.55% | 60.80% | 48.65% | 35.33% | 46.87% | |||||||||||||||||||||||||||||||||||||||
| Residential Re-REMIC |
|
CDO Subordinate |
|
|||||||||||||||||||||||||||||||||||||||||||||||||
| Principal balance |
$ | 215,863 | $ | 216,159 | $ | 236,470 | $ | 252,941 | $ | 220,697 | $ | 194,245 | Principal balance |
$ | - | $ | 10,778 | $ | 10,750 | $ | 10,719 | $ | 31,378 | $ | 31,351 | |||||||||||||||||||||||||||
| Unamortized discount |
(69,310 | ) | (61,123 | ) | (73,438 | ) | (81,817 | ) | (78,226 | ) | (68,861 | ) | Unamortized discount |
- | (3,461 | ) | (3,461 | ) | (3,461 | ) | (19,701 | ) | (20,784 | ) | ||||||||||||||||||||||||||||
| Credit reserve |
(47,235 | ) | (56,158 | ) | (58,618 | ) | (63,702 | ) | (60,563 | ) | (58,106 | ) | Credit reserve |
- | (7,303 | ) | (7,275 | ) | (7,244 | ) | (10,717 | ) | (9,607 | ) | ||||||||||||||||||||||||||||
| Unrealized gains, net |
63,717 | 51,095 | 43,023 | 47,239 | 37,458 | 45,822 | Unrealized gains, net |
- | 50 | 50 | 50 | 50 | 50 | |||||||||||||||||||||||||||||||||||||||
| Fair value |
$ | 163,035 | $ | 149,973 | $ | 147,437 | $ | 154,661 | $ | 119,366 | $ | 113,100 | Fair value |
$ | - | $ | 64 | $ | 64 | $ | 64 | $ | 1,010 | $ | 1,010 | |||||||||||||||||||||||||||
| Average amortized cost |
$ | 99,088 | $ | 99,890 | $ | 105,281 | $ | 87,001 | $ | 74,560 | $ | 41,598 | Average amortized cost |
$ | 4 | $ | 14 | $ | 14 | $ | 762 | $ | 959 | $ | 1,247 | |||||||||||||||||||||||||||
| Interest income |
$ | 3,385 | $ | 3,282 | $ | 3,184 | $ | 2,823 | $ | 2,473 | $ | 1,675 | Interest income |
$ | - | $ | 4 | $ | 4 | $ | 34 | $ | 42 | $ | 41 | |||||||||||||||||||||||||||
| Annualized yield |
13.66% | 13.14% | 12.10% | 12.98% | 13.27% | 16.11% | Annualized yield |
N/A | 114.29% | 114.29% | 17.85% | 17.52% | 13.15% | |||||||||||||||||||||||||||||||||||||||
| Residential Prime Subordinate |
|
|||||||||||||||||||||||||||||||||||||||||||||||||||
| Principal balance |
$ | 290,276 | $ | 259,124 | $ | 252,372 | $ | 247,667 | $ | 207,444 | $ | 227,784 | ||||||||||||||||||||||||||||||||||||||||
| Unamortized discount |
(33,567 | ) | (27,061 | ) | (30,375 | ) | (23,787 | ) | (13,902 | ) | (21,991 | ) | ||||||||||||||||||||||||||||||||||||||||
| Credit reserve |
(93,160 | ) | (99,209 | ) | (103,628 | ) | (118,510 | ) | (128,879 | ) | (134,116 | ) | ||||||||||||||||||||||||||||||||||||||||
| Unrealized (losses) gains, net |
21,447 | 12,688 | 5,103 | 819 | (5,603 | ) | (1,071 | ) | ||||||||||||||||||||||||||||||||||||||||||||
| Fair value |
$ | 184,996 | $ | 145,542 | $ | 123,472 | $ | 106,189 | $ | 59,060 | $ | 70,606 | ||||||||||||||||||||||||||||||||||||||||
| Average amortized cost |
$ | 153,224 | $ | 118,549 | $ | 104,078 | $ | 81,253 | $ | 69,477 | $ | 72,199 | ||||||||||||||||||||||||||||||||||||||||
| Interest income |
$ | 4,562 | $ | 4,443 | $ | 4,158 | $ | 3,753 | $ | 3,752 | $ | 3,670 | ||||||||||||||||||||||||||||||||||||||||
| Annualized yield |
11.91% | 14.99% | 15.98% | 18.48% | 21.60% | 20.33% | ||||||||||||||||||||||||||||||||||||||||||||||
(1) Annualized yields for AFS portfolios are based on average amortized cost. Cash flows from many of our subordinate securities can be volatile and in certain cases (e.g., when the fair value of certain securities are close to zero) any interest income earned can result in unusually high reported yields that are not sustainable and not necessarily meaningful.
| THE REDWOOD REVIEW 4TH QUARTER 2012
|
Table 6: Balances & Yields by Securities Portfolio at Redwood |
57
| ||
|
|
Table 7: Securities and Loans Portfolio Activity at Redwood ($ in thousands) | 58
| ||
| 2012 Q4 |
2012 Q3 |
2012 Q2 |
2012 Q1 |
2011 Q4 |
2011 Q3 |
2011 Q2 |
2012 Q4 |
2012 Q3 |
2012 Q2 |
2012 Q1 |
2011 Q4 |
2011 Q3 |
2011 Q2 |
|||||||||||||||||||||||||||||||||||||||||||||||
| Residential Prime Senior |
|
Commercial Subordinate |
|
|||||||||||||||||||||||||||||||||||||||||||||||||||||||||
| Beginning fair value |
$ | 496,710 | $ | 507,103 | $ | 458,648 | $ | 278,240 | $ | 276,925 | $ | 285,946 | $ | 306,192 | Beginning fair value |
$ | 7,619 | $ | 5,761 | $ | 5,838 | $ | 5,445 | $ | 5,887 | $ | 5,865 | $ | 6,362 | |||||||||||||||||||||||||||||||
| Acquisitions |
6,708 | 16,913 | 94,702 | 193,837 | 20,373 | 2,433 | 8,844 | Acquisitions |
- | - | - | - | - | - | - | |||||||||||||||||||||||||||||||||||||||||||||
| Sales |
(9,285 | ) | (18,160 | ) | (24,775 | ) | (20,954 | ) | - | - | (8,554 | ) | Sales |
(1,484 | ) | - | - | - | - | - | - | |||||||||||||||||||||||||||||||||||||||
| Effect of principal payments |
(22,102 | ) | (21,983 | ) | (20,623 | ) | (10,550 | ) | (8,411 | ) | (9,235 | ) | (11,019 | ) | Effect of principal payments |
- | - | - | - | - | - | - | ||||||||||||||||||||||||||||||||||||||
| Change in fair value, net |
4,901 | 12,837 | (849 | ) | 18,075 | (10,647 | ) | (2,219 | ) | (9,517 | ) | Change in fair value, net |
7,934 | 1,858 | (77 | ) | 393 | (442 | ) | 22 | (497 | ) | ||||||||||||||||||||||||||||||||||||||
| Ending fair value |
$ | 476,932 | $ | 496,710 | $ | 507,103 | $ | 458,648 | $ | 278,240 | $ | 276,925 | $ | 285,946 | Ending fair value |
$ | 14,069 | $ | 7,619 | $ | 5,761 | $ | 5,838 | $ | 5,445 | $ | 5,887 | $ | 5,865 | |||||||||||||||||||||||||||||||
| Residential Non-Prime Senior |
|
CDO Subordinate |
|
|||||||||||||||||||||||||||||||||||||||||||||||||||||||||
| Beginning fair value |
$ | 262,812 | $ | 264,970 | $ | 274,954 | $ | 276,332 | $ | 298,917 | $ | 307,404 | $ | 316,626 | Beginning fair value |
$ | 64 | $ | 64 | $ | 64 | $ | 1,010 | $ | 1,010 | $ | 1,403 | $ | 1,296 | |||||||||||||||||||||||||||||||
| Acquisitions |
(188 | ) | 20,850 | 13,783 | 19,521 | 1,299 | 1,202 | 3,154 | Acquisitions |
- | - | - | - | - | - | - | ||||||||||||||||||||||||||||||||||||||||||||
| Sales |
- | (23,004 | ) | (14,018 | ) | (25,408 | ) | - | - | - | Sales |
(259 | ) | - | - | (859 | ) | - | - | - | ||||||||||||||||||||||||||||||||||||||||
| Effect of principal payments |
(7,797 | ) | (7,505 | ) | (8,607 | ) | (7,164 | ) | (7,880 | ) | (8,509 | ) | (7,613 | ) | Effect of principal payments |
- | - | - | - | - | - | - | ||||||||||||||||||||||||||||||||||||||
| Change in fair value, net |
12,573 | 7,501 | (1,142 | ) | 11,673 | (16,004 | ) | (1,180 | ) | (4,763 | ) | Change in fair value, net |
195 | - | - | (87 | ) | - | (393 | ) | 107 | |||||||||||||||||||||||||||||||||||||||
| Ending fair value |
$ | 267,400 | $ | 262,812 | $ | 264,970 | $ | 274,954 | $ | 276,332 | $ | 298,917 | $ | 307,404 | Ending fair value |
$ | - | $ | 64 | $ | 64 | $ | 64 | $ | 1,010 | $ | 1,010 | $ | 1,403 | |||||||||||||||||||||||||||||||
| Residential Re-REMIC |
|
Residential Loans |
|
|||||||||||||||||||||||||||||||||||||||||||||||||||||||||
| Beginning fair value |
$ | 149,973 | $ | 147,437 | $ | 154,661 | $ | 119,366 | $ | 113,100 | $ | 77,575 | $ | 85,497 | Beginning carrying value |
$ | 417,982 | $ | 256,077 | $ | 303,106 | $ | 395,237 | $ | 228,906 | $ | 205,301 | $ | 54,870 | |||||||||||||||||||||||||||||||
| Acquisitions |
- | - | - | 26,135 | 14,800 | 36,888 | - | Acquisitions |
789,416 | 524,043 | 338,898 | 660,008 | 174,767 | 404,597 | 152,042 | |||||||||||||||||||||||||||||||||||||||||||||
| Sales |
- | (5,376 | ) | (2,983 | ) | (2,527 | ) | - | - | - | Sales |
(665,078 | ) | (372,362 | ) | (381,808 | ) | (745,262 | ) | (235 | ) | - | - | |||||||||||||||||||||||||||||||||||||
| Effect of principal payments |
- | - | - | - | - | - | - | Transfers to Securitization Entities |
- | - | - | - | - | (376,226 | ) | - | ||||||||||||||||||||||||||||||||||||||||||||
| Change in fair value, net |
13,062 | 7,912 | (4,241 | ) | 11,687 | (8,534 | ) | (1,363 | ) | (7,922 | ) | Principal repayments |
(2,483 | ) | (4,842 | ) | (4,524 | ) | (6,970 | ) | (8,189 | ) | (5,115 | ) | (1,616 | ) | ||||||||||||||||||||||||||||||||||
| Ending fair value |
$ | 163,035 | $ | 149,973 | $ | 147,437 | $ | 154,661 | $ | 119,366 | $ | 113,100 | $ | 77,575 | Transfers to REO |
- | - | - | - | - | - | - | ||||||||||||||||||||||||||||||||||||||
| Changes in fair value, net |
22,821 | 15,066 | 405 | 93 | (12 | ) | 349 | 5 | ||||||||||||||||||||||||||||||||||||||||||||||||||||
| Residential Prime Subordinate |
|
Ending carrying value |
$ | 562,658 | $ | 417,982 | $ | 256,077 | $ | 303,106 | $ | 395,237 | $ | 228,906 | $ | 205,301 | ||||||||||||||||||||||||||||||||||||||||||||
| Beginning fair value |
$ | 145,542 | $ | 123,472 | $ | 106,189 | $ | 59,060 | $ | 70,606 | $ | 71,845 | $ | 59,239 | ||||||||||||||||||||||||||||||||||||||||||||||
| Acquisitions |
35,097 | 18,576 | 17,267 | 44,543 | - | 3,491 | 21,277 | Commercial Loans |
|
|||||||||||||||||||||||||||||||||||||||||||||||||||
| Sales |
- | - | - | - | - | - | - | Beginning carrying value |
$ | 286,070 | $ | 246,783 | $ | 178,415 | $ | 157,726 | $ | 98,060 | $ | 71,168 | $ | 42,483 | ||||||||||||||||||||||||||||||||||||||
| Effect of principal payments |
(3,394 | ) | (3,072 | ) | (3,211 | ) | (2,386 | ) | (2,301 | ) | (1,995 | ) | (1,743 | ) | Originations |
44,182 | 40,154 | 68,620 | 26,888 | 60,297 | 26,908 | 28,660 | ||||||||||||||||||||||||||||||||||||||
| Change in fair value, net |
7,751 | 6,566 | 3,227 | 4,972 | (9,245 | ) | (2,735 | ) | (6,928 | ) | Sales |
(15,000 | ) | - | - | - | - | - | - | |||||||||||||||||||||||||||||||||||||||||
| Ending fair value |
$ | 184,996 | $ | 145,542 | $ | 123,472 | $ | 106,189 | $ | 59,060 | $ | 70,606 | $ | 71,845 | Principal repayments |
(95 | ) | (491 | ) | (87 | ) | (6,091 | ) | (59 | ) | (25 | ) | (2 | ) | |||||||||||||||||||||||||||||||
| Provision for loan losses |
(2,320 | ) | (506 | ) | (376 | ) | (274 | ) | (608 | ) | - | - | ||||||||||||||||||||||||||||||||||||||||||||||||
| Residential Non-Prime Subordinate |
|
Discount/fee amortization |
173 | 130 | 211 | 166 | 36 | 9 | 27 | |||||||||||||||||||||||||||||||||||||||||||||||||||
| Beginning fair value |
$ | 6,555 | $ | 7,970 | $ | 8,229 | $ | 11,283 | $ | 10,616 | $ | 11,036 | $ | 12,196 | Ending carrying value |
$ | 313,010 | $ | 286,070 | $ | 246,783 | $ | 178,415 | $ | 157,726 | $ | 98,060 | $ | 71,168 | |||||||||||||||||||||||||||||||
| Acquisitions |
- | - | - | - | 1,582 | - | - | |||||||||||||||||||||||||||||||||||||||||||||||||||||
| Sales |
(4,193 | ) | (1,868 | ) | - | (3,149 | ) | - | - | - | ||||||||||||||||||||||||||||||||||||||||||||||||||
| Effect of principal payments |
(75 | ) | (143 | ) | (260 | ) | (229 | ) | (364 | ) | (287 | ) | (336 | ) | ||||||||||||||||||||||||||||||||||||||||||||||
| Change in fair value, net |
34 | 596 | 1 | 324 | (551 | ) | (133 | ) | (824 | ) | ||||||||||||||||||||||||||||||||||||||||||||||||||
| Ending fair value |
$ | 2,321 | $ | 6,555 | $ | 7,970 | $ | 8,229 | $ | 11,283 | $ | 10,616 | $ | 11,036 | ||||||||||||||||||||||||||||||||||||||||||||||
| THE REDWOOD REVIEW 4TH QUARTER 2012
|
Table 7: Securities and Loans Portfolio Activity at Redwood | |||
|
|
Table 8A: Residential Prime Securities at Redwood and Underlying Loan Characteristics1 ($ in thousands) | |||
|
2012 Q4 |
2012 Q3 |
2012 Q2 |
2012 Q1 |
2011 Q4 |
2011 Q3 |
2011 Q2 |
2011 Q1 |
|||||||||||||||||||||||||
| Senior AFS |
$ | 466,523 | $ | 490,409 | $ | 490,802 | $ | 436,783 | $ | 278,240 | $ | 276,925 | $ | 285,946 | $ | 306,192 | ||||||||||||||||
| Subordinate AFS |
184,528 | 145,096 | 123,005 | 105,788 | 58,717 | 70,278 | 71,543 | 58,870 | ||||||||||||||||||||||||
| Fair value |
10,877 | 6,747 | 16,768 | 22,266 | 343 | 328 | 302 | 369 | ||||||||||||||||||||||||
| Total Residential Prime Securities |
$ | 661,928 | $ | 642,252 | $ | 630,575 | $ | 564,837 | $ | 337,300 | $ | 347,531 | $ | 357,791 | $ | 365,431 | ||||||||||||||||
| Number of loans |
60,441 | 60,584 | 63,986 | 81,085 | 85,702 | 92,071 | 101,149 | 109,221 | ||||||||||||||||||||||||
| Total loan face |
$ | 26,856,580 | $ | 26,183,495 | $ | 27,988,787 | $ | 30,222,071 | $ | 31,848,071 | $ | 34,816,750 | $ | 39,160,316 | $ | 43,242,656 | ||||||||||||||||
| Average loan size |
$ | 444 | $ | 432 | $ | 437 | $ | 373 | $ | 372 | $ | 378 | $ | 387 | $ | 396 | ||||||||||||||||
| Year 2012 origination |
4% | 1% | 1% | 0% | 0% | 0% | 0% | 0% | ||||||||||||||||||||||||
| Year 2011 origination |
2% | 2% | 2% | 2% | 0% | 0% | 0% | 0% | ||||||||||||||||||||||||
| Year 2010 origination |
0% | 0% | 0% | 0% | 0% | 0% | 0% | 0% | ||||||||||||||||||||||||
| Year 2009 origination |
0% | 0% | 0% | 0% | 0% | 0% | 0% | 0% | ||||||||||||||||||||||||
| Year 2008 origination |
0% | 0% | 0% | 0% | 0% | 0% | 0% | 0% | ||||||||||||||||||||||||
| Year 2007 origination |
18% | 12% | 12% | 11% | 10% | 10% | 9% | 10% | ||||||||||||||||||||||||
| Year 2006 origination |
4% | 3% | 3% | 3% | 1% | 1% | 1% | 11% | ||||||||||||||||||||||||
| Year 2005 origination |
18% | 17% | 17% | 17% | 19% | 19% | 18% | 17% | ||||||||||||||||||||||||
| Year 2004 origination and earlier |
54% | 65% | 65% | 67% | 70% | 70% | 72% | 62% | ||||||||||||||||||||||||
| Geographic concentration |
||||||||||||||||||||||||||||||||
| Southern CA |
23% | 23% | 23% | 23% | 23% | 23% | 24% | 24% | ||||||||||||||||||||||||
| Northern CA |
21% | 21% | 21% | 21% | 21% | 21% | 21% | 22% | ||||||||||||||||||||||||
| New York |
7% | 7% | 7% | 7% | 6% | 6% | 6% | 6% | ||||||||||||||||||||||||
| Florida |
6% | 6% | 6% | 6% | 6% | 6% | 6% | 6% | ||||||||||||||||||||||||
| Virginia |
3% | 3% | 3% | 3% | 4% | 4% | 4% | 4% | ||||||||||||||||||||||||
| New Jersey |
3% | 3% | 3% | 3% | 3% | 3% | 3% | 3% | ||||||||||||||||||||||||
| Illinois |
3% | 3% | 3% | 3% | 3% | 3% | 3% | 3% | ||||||||||||||||||||||||
| Other states |
34% | 34% | 34% | 34% | 34% | 34% | 33% | 32% | ||||||||||||||||||||||||
| Wtd Avg Original LTV |
69% | 69% | 69% | 68% | 68% | 68% | 68% | 68% | ||||||||||||||||||||||||
| Original LTV: 0 - 50 |
10% | 11% | 11% | 12% | 12% | 12% | 13% | 12% | ||||||||||||||||||||||||
| Original LTV: 50.01 - 60 |
11% | 11% | 11% | 11% | 11% | 11% | 12% | 11% | ||||||||||||||||||||||||
| Original LTV: 60.01 - 70 |
22% | 23% | 23% | 23% | 23% | 23% | 23% | 22% | ||||||||||||||||||||||||
| Original LTV: 70.01 - 80 |
53% | 51% | 51% | 50% | 49% | 49% | 48% | 50% | ||||||||||||||||||||||||
| Original LTV: 80.01 - 90 |
3% | 3% | 3% | 3% | 3% | 3% | 3% | 3% | ||||||||||||||||||||||||
| Original LTV: 90.01 - 100 |
1% | 1% | 1% | 1% | 2% | 2% | 1% | 2% | ||||||||||||||||||||||||
| Unknown |
0% | 0% | 0% | 0% | 0% | 0% | 0% | 0% | ||||||||||||||||||||||||
| Wtd Avg Original FICO |
729 | 735 | 735 | 735 | 735 | 735 | 735 | 736 | ||||||||||||||||||||||||
| Original FICO: <= 680 |
11% | 11% | 11% | 11% | 11% | 11% | 11% | 10% | ||||||||||||||||||||||||
| Original FICO: 681 - 700 |
10% | 11% | 11% | 10% | 10% | 10% | 10% | 10% | ||||||||||||||||||||||||
| Original FICO: 701 - 720 |
14% | 14% | 14% | 14% | 14% | 14% | 14% | 14% | ||||||||||||||||||||||||
| Original FICO: 721 - 740 |
15% | 15% | 15% | 15% | 15% | 15% | 15% | 14% | ||||||||||||||||||||||||
| Original FICO: 741 - 760 |
16% | 16% | 16% | 16% | 16% | 16% | 16% | 16% | ||||||||||||||||||||||||
| Original FICO: 761 - 780 |
17% | 17% | 17% | 17% | 17% | 17% | 17% | 18% | ||||||||||||||||||||||||
| Original FICO: 781 - 800 |
13% | 12% | 12% | 12% | 12% | 12% | 12% | 13% | ||||||||||||||||||||||||
| Original FICO: >= 801 |
3% | 3% | 3% | 3% | 3% | 3% | 3% | 3% | ||||||||||||||||||||||||
| Original Unknown |
1% | 1% | 1% | 2% | 2% | 2% | 2% | 2% | ||||||||||||||||||||||||
| Conforming balance % (2) |
50% | 53% | 52% | 54% | 55% | 54% | 60% | 59% | ||||||||||||||||||||||||
| > $1 MM % |
10% | 9% | 9% | 9% | 8% | 8% | 8% | 8% | ||||||||||||||||||||||||
| 2nd Home % |
7% | 7% | 7% | 7% | 7% | 7% | 7% | 7% | ||||||||||||||||||||||||
| Investment Home % |
2% | 2% | 2% | 2% | 2% | 2% | 2% | 2% | ||||||||||||||||||||||||
| Purchase |
43% | 41% | 41% | 40% | 40% | 39% | 39% | 42% | ||||||||||||||||||||||||
| Cash Out Refi |
23% | 23% | 23% | 23% | 23% | 23% | 23% | 23% | ||||||||||||||||||||||||
| Rate-Term Refi |
34% | 36% | 36% | 36% | 36% | 37% | 37% | 34% | ||||||||||||||||||||||||
| Other |
0% | 0% | 0% | 1% | 1% | 1% | 1% | 1% | ||||||||||||||||||||||||
| Full Doc |
56% | 55% | 55% | 53% | 51% | 51% | 51% | 50% | ||||||||||||||||||||||||
| No Doc |
5% | 4% | 4% | 6% | 6% | 6% | 6% | 5% | ||||||||||||||||||||||||
| Other Doc (Lim, Red, Stated, etc) |
37% | 38% | 38% | 38% | 40% | 40% | 40% | 42% | ||||||||||||||||||||||||
| Unknown/Not Categorized |
2% | 3% | 3% | 3% | 3% | 3% | 3% | 3% | ||||||||||||||||||||||||
| Single Family |
88% | 88% | 88% | 88% | 89% | 89% | 89% | 88% | ||||||||||||||||||||||||
| Condo |
9% | 9% | 9% | 9% | 9% | 9% | 9% | 10% | ||||||||||||||||||||||||
| 2-4 Family |
2% | 2% | 2% | 2% | 1% | 1% | 1% | 1% | ||||||||||||||||||||||||
| Other
|
1% | 1% | 1% | 1% | 1% | 1% | 1% | 1% | ||||||||||||||||||||||||
(1) Only the loan groups providing direct cash flow to securities we own are included.
(2) The definition of a conforming loan has significantly changed over time. For Q3 2011 and subsequent periods, the conforming balance definition that went into effect on October 1, 2011 was used (which had a maximum loan balance of $625,500). For all periods prior to Q3 2011, the conforming balance definition available in June 2011 was used (which had a maximum loan balance of $729,750).
| THE REDWOOD REVIEW 4TH QUARTER 2012
|
Table 8A: Residential Prime Securities at Redwood and Underlying Loan Characteristics | 59
| ||
|
|
Table 8B: Residential Non-Prime Securities at Redwood and Underlying Loan Characteristics1 ($ in thousands) | 60
| ||
| 2012 Q4 |
2012 Q3 |
2012 Q2 |
2012 Q1 |
2011 Q4 |
2011 Q3 |
2011 Q2 |
2011 Q1 |
|||||||||||||||||||||||||
| Senior AFS |
$ | 245,266 | $ | 239,871 | $ | 242,007 | $ | 255,279 | $ | 255,724 | $ | 278,161 | $ | 288,718 | $ | 297,758 | ||||||||||||||||
| Subordinate AFS |
2,160 | 6,404 | 7,867 | 8,142 | 11,153 | 10,461 | 10,877 | 12,028 | ||||||||||||||||||||||||
| Fair value |
22,295 | 23,092 | 23,066 | 19,762 | 20,738 | 20,911 | 18,845 | 19,036 | ||||||||||||||||||||||||
| Total Residential Non-prime Securities |
$ | 269,721 | $ | 269,367 | $ | 272,940 | $ | 283,183 | $ | 287,615 | $ | 309,533 | $ | 318,440 | $ | 328,822 | ||||||||||||||||
| Number of loans |
26,514 | 33,775 | 34,815 | 35,452 | 54,717 | 54,538 | 55,830 | 57,542 | ||||||||||||||||||||||||
| Total loan face |
$ | 5,112,513 | $ | 6,760,747 | $ | 7,019,443 | $ | 7,241,685 | $ | 11,730,410 | $ | 11,878,085 | $ | 12,250,760 | $ | 12,723,531 | ||||||||||||||||
| Average loan size |
$ | 193 | $ | 200 | $ | 202 | $ | 204 | $ | 214 | $ | 218 | $ | 219 | $ | 221 | ||||||||||||||||
| Year 2008 origination |
0% | 0% | 0% | 0% | 0% | 0% | 0% | 0% | ||||||||||||||||||||||||
| Year 2007 origination |
0% | 0% | 0% | 0% | 0% | 0% | 0% | 0% | ||||||||||||||||||||||||
| Year 2006 origination |
1% | 1% | 1% | 1% | 14% | 14% | 15% | 15% | ||||||||||||||||||||||||
| Year 2005 origination |
61% | 54% | 54% | 54% | 50% | 51% | 50% | 50% | ||||||||||||||||||||||||
| Year 2004 origination and earlier |
38% | 45% | 45% | 45% | 36% | 35% | 35% | 35% | ||||||||||||||||||||||||
| Geographic concentration |
||||||||||||||||||||||||||||||||
| Southern CA |
23% | 22% | 22% | 22% | 21% | 21% | 21% | 21% | ||||||||||||||||||||||||
| Northern CA |
15% | 16% | 16% | 16% | 15% | 15% | 15% | 14% | ||||||||||||||||||||||||
| Florida |
7% | 8% | 8% | 9% | 9% | 9% | 9% | 9% | ||||||||||||||||||||||||
| New York |
5% | 6% | 6% | 5% | 5% | 5% | 5% | 5% | ||||||||||||||||||||||||
| Virginia |
2% | 2% | 2% | 2% | 3% | 3% | 3% | 3% | ||||||||||||||||||||||||
| New Jersey |
3% | 3% | 3% | 3% | 3% | 3% | 3% | 3% | ||||||||||||||||||||||||
| Illinois |
3% | 3% | 3% | 3% | 3% | 3% | 3% | 3% | ||||||||||||||||||||||||
| Other states |
42% | 40% | 40% | 40% | 41% | 41% | 41% | 42% | ||||||||||||||||||||||||
| Wtd Avg Original LTV |
72% | 73% | 72% | 72% | 73% | 73% | 73% | 73% | ||||||||||||||||||||||||
| Original LTV: 0 - 50 |
7% | 7% | 7% | 7% | 6% | 7% | 7% | 6% | ||||||||||||||||||||||||
| Original LTV: 50.01 - 60 |
9% | 9% | 9% | 9% | 8% | 8% | 8% | 8% | ||||||||||||||||||||||||
| Original LTV: 60.01 - 70 |
19% | 19% | 19% | 19% | 18% | 18% | 18% | 18% | ||||||||||||||||||||||||
| Original LTV: 70.01 - 80 |
57% | 57% | 57% | 57% | 58% | 58% | 58% | 58% | ||||||||||||||||||||||||
| Original LTV: 80.01 - 90 |
6% | 6% | 6% | 6% | 7% | 6% | 6% | 7% | ||||||||||||||||||||||||
| Original LTV: 90.01 - 100 |
2% | 2% | 2% | 2% | 3% | 3% | 3% | 3% | ||||||||||||||||||||||||
| Unknown |
0% | 0% | 0% | 0% | 0% | 0% | 0% | 0% | ||||||||||||||||||||||||
| Wtd Avg Original FICO |
693 | 713 | 713 | 714 | 710 | 710 | 710 | 711 | ||||||||||||||||||||||||
| Original FICO: < = 680 |
24% | 25% | 25% | 25% | 27% | 27% | 27% | 27% | ||||||||||||||||||||||||
| Original FICO: 681 - 700 |
13% | 14% | 14% | 14% | 14% | 14% | 14% | 14% | ||||||||||||||||||||||||
| Original FICO: 701 - 720 |
15% | 15% | 15% | 15% | 14% | 14% | 14% | 14% | ||||||||||||||||||||||||
| Original FICO: 721 - 740 |
13% | 12% | 12% | 12% | 12% | 12% | 12% | 12% | ||||||||||||||||||||||||
| Original FICO: 741 - 760 |
12% | 12% | 12% | 12% | 12% | 12% | 12% | 12% | ||||||||||||||||||||||||
| Original FICO: 761 - 780 |
11% | 10% | 10% | 10% | 10% | 10% | 10% | 10% | ||||||||||||||||||||||||
| Original FICO: 781 - 800 |
7% | 7% | 7% | 7% | 7% | 7% | 7% | 7% | ||||||||||||||||||||||||
| Original FICO: > = 801 |
2% | 2% | 2% | 2% | 2% | 2% | 2% | 2% | ||||||||||||||||||||||||
| Original Unknown |
3% | 3% | 3% | 3% | 2% | 2% | 2% | 2% | ||||||||||||||||||||||||
| Conforming balance % (2) |
89% | 86% | 86% | 86% | 83% | 82% | 86% | 86% | ||||||||||||||||||||||||
| > $1 MM % |
2% | 2% | 2% | 3% | 3% | 3% | 3% | 3% | ||||||||||||||||||||||||
| 2nd Home % |
3% | 4% | 4% | 4% | 4% | 4% | 4% | 4% | ||||||||||||||||||||||||
| Investment Home % |
16% | 15% | 15% | 15% | 14% | 14% | 13% | 13% | ||||||||||||||||||||||||
| Purchase |
40% | 41% | 42% | 41% | 41% | 41% | 41% | 42% | ||||||||||||||||||||||||
| Cash Out Refi |
44% | 43% | 42% | 42% | 42% | 42% | 42% | 41% | ||||||||||||||||||||||||
| Rate-Term Refi |
15% | 15% | 15% | 16% | 16% | 16% | 16% | 16% | ||||||||||||||||||||||||
| Other |
1% | 1% | 1% | 1% | 1% | 1% | 1% | 1% | ||||||||||||||||||||||||
| Full Doc |
39% | 39% | 39% | 38% | 38% | 39% | 38% | 39% | ||||||||||||||||||||||||
| No Doc |
6% | 6% | 6% | 6% | 5% | 4% | 4% | 4% | ||||||||||||||||||||||||
| Other Doc (Lim, Red, Stated, etc) |
53% | 53% | 53% | 54% | 56% | 56% | 56% | 56% | ||||||||||||||||||||||||
| Unknown/Not Categorized |
2% | 2% | 2% | 2% | 1% | 1% | 2% | 1% | ||||||||||||||||||||||||
| Single Family |
84% | 84% | 84% | 84% | 84% | 84% | 84% | 84% | ||||||||||||||||||||||||
| 2-4 Family |
9% | 8% | 8% | 8% | 8% | 8% | 8% | 8% | ||||||||||||||||||||||||
| Condo |
7% | 8% | 8% | 8% | 8% | 8% | 8% | 8% | ||||||||||||||||||||||||
| Other
|
0% | 0% | 0% | 0% | 0% | 0% | 0% | 0% | ||||||||||||||||||||||||
(1) Only the loan groups providing direct cash flow to securities we own are included.
(2) The definition of a conforming loan has significantly changed over time. For Q3 2011 and subsequent periods, the conforming balance definition that went into effect on October 1, 2011 was used (which had a maximum loan balance of $625,500). For all periods prior to Q3 2011, the conforming balance definition available in June 2011 was used (which had a maximum loan balance of $729,750).
| THE REDWOOD REVIEW 4TH QUARTER 2012
|
||||
|
|
Table 9: Residential Real Estate Loan Characteristics1 ($ in thousands) |
|||
| 2012 Q4 |
2012 Q3 |
2012 Q2 |
2012 Q1 |
2011 Q4 |
2011 Q3 |
2011 Q2 |
2011 Q1 |
|||||||||||||||||||||||||
| Residential loans principal balance |
$ | 2,820,885 | $ | 3,502,775 | $ | 3,493,755 | $ | 3,682,379 | $ | 4,231,324 | $ | 4,190,773 | $ | 3,892,161 | $ | 3,819,692 | ||||||||||||||||
| Number of loans |
8,223 | 10,697 | 10,773 | 11,079 | 12,490 | 12,526 | 12,258 | 12,301 | ||||||||||||||||||||||||
| Average loan balance |
$ | 343 | $ | 327 | $ | 324 | $ | 332 | $ | 339 | $ | 335 | $ | 318 | $ | 311 | ||||||||||||||||
| Adjustable % |
66% | 73% | 75% | 73% | 72% | 74% | 81% | 84% | ||||||||||||||||||||||||
| Hybrid % |
5% | 6% | 8% | 9% | 9% | 10% | 10% | 11% | ||||||||||||||||||||||||
| Fixed % |
29% | 21% | 18% | 18% | 19% | 16% | 9% | 5% | ||||||||||||||||||||||||
| Amortizing % |
32% | 23% | 20% | 21% | 22% | 19% | 11% | 8% | ||||||||||||||||||||||||
| Interest-only % |
68% | 77% | 80% | 79% | 78% | 81% | 89% | 92% | ||||||||||||||||||||||||
| Northern California |
14% | 15% | 15% | 16% | 14% | 14% | 12% | 11% | ||||||||||||||||||||||||
| Florida |
10% | 11% | 12% | 11% | 11% | 12% | 12% | 13% | ||||||||||||||||||||||||
| Southern California |
12% | 11% | 11% | 12% | 12% | 12% | 12% | 11% | ||||||||||||||||||||||||
| New York |
8% | 7% | 7% | 7% | 7% | 8% | 8% | 8% | ||||||||||||||||||||||||
| Texas |
5% | 6% | 5% | 5% | 6% | 5% | 5% | 5% | ||||||||||||||||||||||||
| Georgia |
4% | 5% | 4% | 4% | 4% | 5% | 5% | 5% | ||||||||||||||||||||||||
| New Jersey |
3% | 4% | 4% | 4% | 4% | 4% | 4% | 4% | ||||||||||||||||||||||||
| Colorado |
4% | 4% | 3% | 3% | 3% | 3% | 3% | 4% | ||||||||||||||||||||||||
| Virginia |
3% | 3% | 3% | 3% | 3% | 2% | 3% | 3% | ||||||||||||||||||||||||
| Arizona |
2% | 2% | 2% | 2% | 2% | 2% | 2% | 2% | ||||||||||||||||||||||||
| Illinois |
3% | 2% | 2% | 2% | 3% | 2% | 2% | 2% | ||||||||||||||||||||||||
| Other states |
33% | 30% | 30% | 31% | 31% | 31% | 32% | 32% | ||||||||||||||||||||||||
| Year 2012 origination |
19% | 11% | 6% | 4% | 0% | 0% | 0% | 0% | ||||||||||||||||||||||||
| Year 2011 origination |
4% | 4% | 5% | 9% | 13% | 9% | 3% | 0% | ||||||||||||||||||||||||
| Year 2010 origination |
7% | 7% | 8% | 8% | 9% | 10% | 8% | 7% | ||||||||||||||||||||||||
| Year 2009 origination |
2% | 2% | 3% | 3% | 3% | 4% | 4% | 5% | ||||||||||||||||||||||||
| Year 2008 origination |
0% | 0% | 0% | 0% | 0% | 0% | 0% | 0% | ||||||||||||||||||||||||
| Year 2007 origination |
<1% | 2% | 2% | 2% | 2% | 2% | 2% | 2% | ||||||||||||||||||||||||
| Year 2006 origination |
6% | 5% | 5% | 5% | 4% | 4% | 5% | 5% | ||||||||||||||||||||||||
| Year 2005 origination |
3% | 4% | 4% | 3% | 3% | 3% | 3% | 4% | ||||||||||||||||||||||||
| Year 2004 origination or earlier |
59% | 65% | 68% | 66% | 66% | 68% | 75% | 77% | ||||||||||||||||||||||||
| Wtd Avg Original LTV |
65% | 66% | 66% | 66% | 66% | 66% | 66% | 66% | ||||||||||||||||||||||||
| Original LTV: 0 - 50 |
20% | 18% | 19% | 19% | 19% | 20% | 19% | 19% | ||||||||||||||||||||||||
| Original LTV: 50.01 - 60 |
14% | 12% | 13% | 13% | 13% | 13% | 13% | 13% | ||||||||||||||||||||||||
| Original LTV: 60.01 - 70 |
22% | 22% | 22% | 22% | 22% | 21% | 21% | 21% | ||||||||||||||||||||||||
| Original LTV: 70.01 - 80 |
38% | 42% | 41% | 41% | 40% | 40% | 40% | 40% | ||||||||||||||||||||||||
| Original LTV: 80.01 - 90 |
2% | 2% | 2% | 2% | 2% | 2% | 2% | 2% | ||||||||||||||||||||||||
| Original LTV: 90.01 - 100 |
4% | 4% | 4% | 4% | 4% | 4% | 5% | 5% | ||||||||||||||||||||||||
| Wtd Avg FICO |
744 | 740 | 739 | 740 | 740 | 739 | 736 | 735 | ||||||||||||||||||||||||
| FICO: < = 600 |
<1% | <1% | <1% | <1% | <1% | 1% | 1% | 1% | ||||||||||||||||||||||||
| FICO: 601 - 620 |
<1% | <1% | 1% | 1% | 1% | 1% | 1% | 1% | ||||||||||||||||||||||||
| FICO: 621 - 640 |
1% | 1% | 1% | 1% | 1% | 2% | 2% | 2% | ||||||||||||||||||||||||
| FICO: 641 - 660 |
3% | 3% | 3% | 3% | 3% | 3% | 3% | 3% | ||||||||||||||||||||||||
| FICO: 661 - 680 |
5% | 6% | 6% | 6% | 6% | 6% | 7% | 7% | ||||||||||||||||||||||||
| FICO: 681 - 700 |
8% | 9% | 10% | 9% | 9% | 9% | 10% | 10% | ||||||||||||||||||||||||
| FICO: 701 - 720 |
10% | 12% | 12% | 12% | 12% | 12% | 12% | 13% | ||||||||||||||||||||||||
| FICO: 721 - 740 |
12% | 12% | 13% | 12% | 12% | 12% | 13% | 13% | ||||||||||||||||||||||||
| FICO: 741 - 760 |
14% | 14% | 14% | 14% | 14% | 14% | 14% | 14% | ||||||||||||||||||||||||
| FICO: 761 - 780 |
19% | 18% | 18% | 18% | 19% | 18% | 18% | 17% | ||||||||||||||||||||||||
| FICO: 781 - 800 |
20% | 18% | 17% | 17% | 18% | 17% | 15% | 15% | ||||||||||||||||||||||||
| FICO: > = 801 |
6% | 5% | 5% | 6% | 5% | 5% | 4% | 4% | ||||||||||||||||||||||||
| Conforming balance % (2) |
37% | 42% | 43% | 42% | 41% | 42% | 49% | 50% | ||||||||||||||||||||||||
| % balance in loans > $1mm per loan |
20% | 19% | 20% | 22% | 22% | 22% | 20% | 20% | ||||||||||||||||||||||||
| 2nd home % |
10% | 10% | 11% | 10% | 11% | 11% | 11% | 11% | ||||||||||||||||||||||||
| Investment home % |
3% | 3% | 3% | 3% | 3% | 3% | 3% | 3% | ||||||||||||||||||||||||
| Purchase |
30% | 34% | 33% | 33% | 33% | 33% | 32% | 31% | ||||||||||||||||||||||||
| Cash out refinance |
26% | 28% | 28% | 28% | 28% | 29% | 31% | 33% | ||||||||||||||||||||||||
| Rate-term refinance |
42% | 37% | 37% | 38% | 38% | 37% | 36% | 35% | ||||||||||||||||||||||||
| Other
|
2% | 1% | 1% | 1% | 1% | 1% | 1% | 1% | ||||||||||||||||||||||||
(1) This table presents characteristics of residential loans held by consolidated Sequoia entities and residential loans held by Redwood and intended to be securitized by future Sequoia entities or sold to third parties.
(2) The definition of a conforming loan has significantly changed over time. For Q3 2011 and subsequent periods, the conforming balance definition that went into effect on October 1, 2011 was used (which had a maximum loan balance of $625,500). For all periods prior to Q3 2011, the conforming balance definition available in June 2011 was used (which had a maximum loan balance of $729,750).
| THE REDWOOD REVIEW 4TH QUARTER 2012
|
Table 9: Residential Real Estate Loan Characteristics |
61
| ||
|
|
Table 10: Commercial Loan Characteristics 1 ($ in thousands) | 62
| ||
| 2012 Q4 |
2012 Q3 |
2012 Q2 |
2012 Q1 |
2011 Q4 |
2011 Q3 |
2011 Q2 |
2011 Q1 |
2010 Q4 |
||||||||||||||||||||||||||||
| Commercial loans principal balance |
$ | 320,901 | $ | 291,595 | $ | 251,686 | $ | 182,803 | $ | 158,847 | $ | 158,846 | $ | 98,600 | $ | 71,651 | $ | 42,953 | ||||||||||||||||||
| Number of loans |
36 | 31 | 27 | 19 | 15 | 16 | 12 | 9 | 6 | |||||||||||||||||||||||||||
| Average loan balance |
$ | 8,914 | $ | 9,406 | $ | 9,322 | $ | 9,621 | $ | 9,928 | $ | 9,928 | $ | 8,217 | $ | 7,961 | $ | 7,159 | ||||||||||||||||||
| Fixed % |
88% | 87% | 94% | 92% | 91% | 91% | 100% | 100% | 100% | |||||||||||||||||||||||||||
| Hybrid % |
12% | 13% | 6% | 8% | 9% | 9% | 0% | 0% | 0% | |||||||||||||||||||||||||||
| Amortizing % |
12% | 10% | 16% | 16% | 19% | 19% | 14% | 1% | 1% | |||||||||||||||||||||||||||
| Interest-only % |
88% | 90% | 84% | 84% | 81% | 81% | 86% | 99% | 99% | |||||||||||||||||||||||||||
| New York |
21% | 24% | 25% | 17% | 16% | 16% | 19% | 26% | 43% | |||||||||||||||||||||||||||
| California |
20% | 22% | 18% | 20% | 21% | 21% | 18% | 10% | 1% | |||||||||||||||||||||||||||
| Illinois |
10% | 11% | 13% | 18% | 21% | 21% | 12% | 17% | 28% | |||||||||||||||||||||||||||
| Florida |
13% | 11% | 12% | 13% | 4% | 4% | 6% | 8% | 14% | |||||||||||||||||||||||||||
| Michigan |
6% | 6% | 7% | 7% | 8% | 8% | 13% | 0% | 0% | |||||||||||||||||||||||||||
| Texas |
5% | 5% | 6% | 5% | 2% | 2% | 4% | 0% | 0% | |||||||||||||||||||||||||||
| North Carolina |
3% | 4% | 4% | 0% | 0% | 0% | 0% | 0% | 0% | |||||||||||||||||||||||||||
| Delaware |
3% | 3% | 4% | 0% | 0% | 0% | 0% | 0% | 0% | |||||||||||||||||||||||||||
| Washington |
3% | 3% | 0% | 0% | 0% | 0% | 0% | 0% | 0% | |||||||||||||||||||||||||||
| Other states |
16% | 11% | 11% | 20% | 28% | 28% | 28% | 39% | 14% | |||||||||||||||||||||||||||
| Year 2012 origination |
53% | 48% | 38% | 15% | 0% | 0% | 0% | 0% | 0% | |||||||||||||||||||||||||||
| Year 2011 origination |
38% | 42% | 50% | 68% | 81% | 81% | 69% | 57% | 28% | |||||||||||||||||||||||||||
| Year 2010 origination |
10% | 10% | 12% | 17% | 19% | 19% | 31% | 43% | 71% | |||||||||||||||||||||||||||
| Year 2004 origination |
<1% | <1% | <1% | <1% | <1% | <1% | <1% | <1% | 1% | |||||||||||||||||||||||||||
| Office |
28% | 30% | 32% | 32% | 37% | 37% | 38% | 51% | 86% | |||||||||||||||||||||||||||
| Multi-family |
28% | 28% | 22% | 23% | 14% | 14% | 14% | 14% | 14% | |||||||||||||||||||||||||||
| Hospitality |
20% | 20% | 21% | 18% | 20% | 20% | 18% | 25% | 0% | |||||||||||||||||||||||||||
| Retail |
18% | 16% | 18% | 25% | 29% | 29% | 30% | 10% | 0% | |||||||||||||||||||||||||||
|
Self-storage
|
6% | 6% | 7% | 2% | 0% | 0% | 0% | 0% | 0% | |||||||||||||||||||||||||||
(1) This table presents characteristics of commercial loans held-for-investment by Redwood and commercial loans held by Redwood intended to be sold to third parties.
| THE REDWOOD REVIEW 4TH QUARTER 2012
|
Table 10: Commercial Loan Characteristics | |||
REDWOOD TRUST CORPORATE INFORMATION
For more information about Redwood Trust, please visit our website at: www.redwoodtrust.com