Attached files
| file | filename |
|---|---|
| 8-K - FROM 8-K - PACIFIC GAS & ELECTRIC Co | form8k2012ye.htm |
| EX-99.1 - PRESS RELEASE - PACIFIC GAS & ELECTRIC Co | ex9901.htm |

Exhibit 99.21
PG&E Corporation
This presentation is not complete without the accompanying statements made by management during
the webcast conference call held on February 21, 2013.
the webcast conference call held on February 21, 2013.
This presentation, including Exhibits, and the accompanying press release, were attached to PG&E
Corporation’s Current Report on Form 8-K that was furnished to the Securities and Exchange
Commission on February 21, 2013 and, along with the replay of the conference call, are also available
on PG&E Corporation’s website at www.pge-corp.com.
Corporation’s Current Report on Form 8-K that was furnished to the Securities and Exchange
Commission on February 21, 2013 and, along with the replay of the conference call, are also available
on PG&E Corporation’s website at www.pge-corp.com.
Fourth Quarter Earnings Call
February 21, 2013

2
Key Focus Areas
Position company
for success
Rebuild relationships and
partner effectively
partner effectively
Resolve gas issues
• Execute critical gas
work
work
• Complete regulatory
proceedings as soon
as possible
proceedings as soon
as possible
• Rigorous multi-year
planning
planning
• Drive continuous
improvement
improvement
• Strengthen local
presence
presence
• Engage in public
policy
development
policy
development

3
Regulatory and Operational Updates
Executing
on Operations
2012 Results
•Strength tested 175 miles and replaced 40 miles of pipe
•Installed 46 automatic or remote shutoff valves
•Enhanced electric reliability with smart distribution circuits
•Improved Customer Satisfaction Survey scores
Regulatory
Update
• Cost of capital - 10.4% ROE, 52% equity ratio
• Oakley plant approved - rate base no earlier than 2016
• Pipeline Safety Enhancement Plan - through 2014
• Filed 2014 GRC request - schedule issued by ALJ
• Transmission Owner case - 9.1% ROE compliance filing

4
Q4 and Full Year 2012: Earnings Results
See Exhibit 3 in the Appendix for additional detail.

5
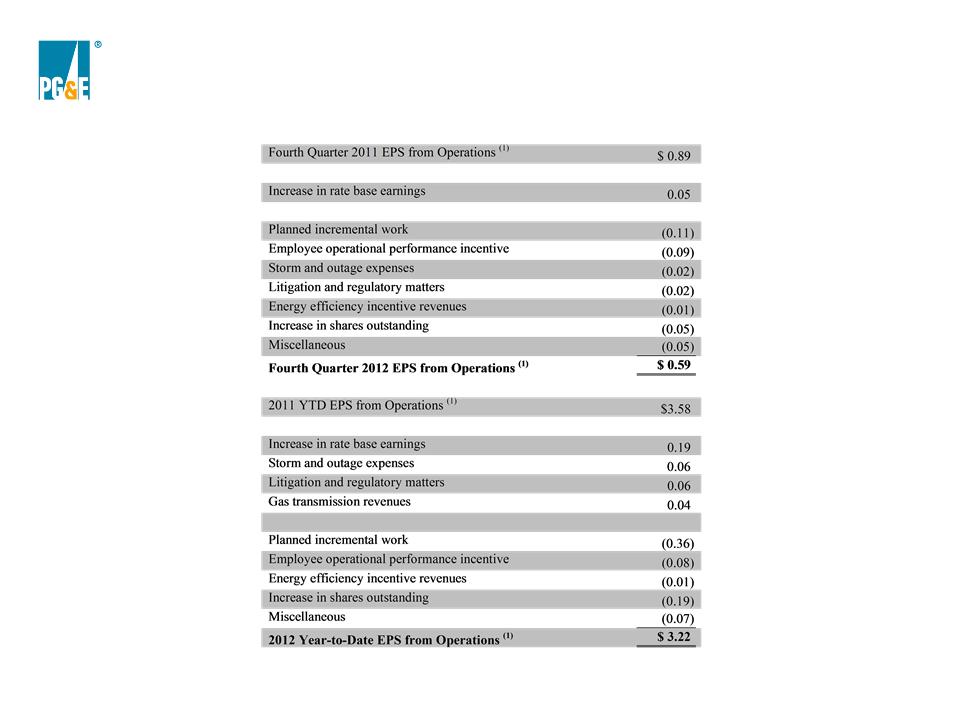
(1) Other items reflect energy efficiency incentive revenues and miscellaneous items. See Exhibit 5 in the Appendix for additional detail.
(1)
Q4 2012: Q over Q Comparison
EPS from Operations
EPS from Operations is not calculated in accordance with GAAP and excludes items impacting comparability. See Exhibit 3 in the Appendix for a
reconciliation of EPS from Operations to EPS on a GAAP basis.
reconciliation of EPS from Operations to EPS on a GAAP basis.
.

6
Authorized ROE: 10.4% CPUC
9.1% FERC
Cost of Capital
Authorized Rate Base (weighted average)
($ billions)
Assumptions for 2013 Guidance
EPS Factors
- Incremental O&M spending ($250 M)
- Financing and depreciation costs for incremental capex (~$1B)
- CWIP earnings 100% offset
- Lower gas storage revenues
+ Energy efficiency incentive revenues
Equity Ratio: 52%
Capital Expenditures Forecast
($ millions)
*Electric Transmission rate base reflects full TO14 request

7
2012 EPS from Operations
Earnings from Ops Comparison
- ROE reductions
- Higher shares
- CWIP earnings 100% offset by below-the-line costs
- Capital expenditures exceeding authorized
+ Rate base growth
$3.22
$2.55 - 2.75
2013 EPS from Operations
Earnings from Operations is not calculated in accordance with GAAP and excludes items impacting comparability.
See Exhibits 3 and 8 in the Appendix for additional detail.

8
2013 Natural Gas Matters
(1) Unrecovered PSEP Expense includes what was previously called “PSEP” and “PSEP - Not Requested.” Assumes no additional disallowed
capital.
capital.
(2) For 2013 and 2014, right-of-way expense is expected to represent more than half of Emerging Work costs.

9
2012
2013(1)
~$775M
$1B - 1.2B
|
|
|
|
|
|
|
|
|
|
|
|
|
|
|
|
|
|
|
|
+ Lower earnings from operations
+ Higher capital expenditures
+ Q4 2012 PSEP capital charge
2013 Equity Issuance
(1) The guidance range for 2013 does not include potential penalties (other than those already accrued).
See Exhibit 1 in the Appendix for factors that could cause actual results to differ materially from the guidance presented and underlying
assumptions.
assumptions.

10
(1) The guidance range for 2013 does not include future insurance recoveries or potential penalties (other than those already accrued) or any potential
punitive damages.
punitive damages.
2013 EPS Guidance
See Exhibit 1 in the Appendix for factors that could cause actual results to differ materially from the guidance presented and underlying
assumptions.
assumptions.

11
Looking Ahead: Capital Expenditures
Capital Expenditures 2014 - 2016
$4.5B - 5.5B
$4.5B - 6B
$4.5B - 6B
2014
2015
2016*
The high end of the range reflects capex at GRC request levels, including attrition amounts for 2015
and 2016, and current views of other future gas and electric proceedings.
and 2016, and current views of other future gas and electric proceedings.
The low end reflects capex consistent with 2013 spending levels, adjusted for completion of the
Cornerstone and Utility-owned Solar PV programs.
Cornerstone and Utility-owned Solar PV programs.
*Excludes Oakley Plant

12
$28.5B - 29B
$32B - 35B
CAGR*: 6 - 10%
2014
2016*
Looking Ahead: Rate Base Growth
Rate Base Growth 2014 - 2016
*Excludes Oakley Plant
The high end of the range reflects capex at GRC request levels, including attrition amounts for 2015
and 2016, and current views of other future gas and electric proceedings.
and 2016, and current views of other future gas and electric proceedings.
The low end reflects capex consistent with 2013 spending levels, adjusted for completion of the
Cornerstone and Utility-owned Solar PV programs.
Cornerstone and Utility-owned Solar PV programs.

13
Looking Ahead: Natural Gas Matters

14
Appendix

Exhibit 8: EPS Guidance
Page
24
Page
24
Exhibit 9: General Earnings Sensitivities
Page 25
Page 25
Exhibit 10: Summary of Selected Regulatory Cases
Page
26-27
Page
26-27

16
Exhibit 1: Safe Harbor Statement
Management's statements regarding guidance for PG&E Corporation’s future financial results and earnings from operations per common
share, general earnings sensitivities, and the underlying assumptions about the future levels of capital expenditures, rate base, costs, and
equity issuances, constitute forward-looking statements that are necessarily subject to various risks and uncertainties. These statements
reflect management’s judgment and opinions, which are based on current expectations and various forecasts, estimates, and projections, the
realization or resolution of which may be outside of management’s control. PG&E Corporation and the Utility are not able to predict all the
factors that may affect future results. Some of the factors that could cause actual results to differ materially include:
•the outcome of pending investigations related to the Utility’s natural gas system operating practices and the San Bruno accident, including the ultimate amount of
penalties (including criminal penalties, if any) and third-party liability the Utility incurs;
penalties (including criminal penalties, if any) and third-party liability the Utility incurs;
•the outcomes of ratemaking proceedings, such as the 2014 General Rate Case, the Transmission Owner rate case, and the 2015 Gas Transmission and Storage rate
case;
case;
•the ultimate costs the Utility incurs in the future that are not recovered through rates, including costs to perform work under the Pipeline Safety Enhancement Plan, to
identify and remove encroachments from transmission pipeline easements, and to perform incremental work to improve the safety and reliability of electric and natural gas
operations;
identify and remove encroachments from transmission pipeline easements, and to perform incremental work to improve the safety and reliability of electric and natural gas
operations;
•the outcome of future investigations or enforcement proceedings relating to the Utility’s compliance with laws, rules, regulations, or orders applicable to the operation,
inspection, and maintenance of its electric and gas facilities;
inspection, and maintenance of its electric and gas facilities;
•whether PG&E Corporation and the Utility are able to repair the reputational harm that they have suffered, and may suffer in the future, due to the negative publicity
surrounding the San Bruno accident, the related civil litigation, and the pending investigations, including any charge or finding of criminal liability;
surrounding the San Bruno accident, the related civil litigation, and the pending investigations, including any charge or finding of criminal liability;
•the level of equity contributions that PG&E Corporation must make to the Utility to enable the Utility to maintain its authorized capital structure as the Utility incurs charges
and costs, including costs associated with natural gas matters and penalties imposed in connection with the pending investigations, that are not recoverable through rates
or insurance;
and costs, including costs associated with natural gas matters and penalties imposed in connection with the pending investigations, that are not recoverable through rates
or insurance;
•the impact of environmental remediation laws, regulations, and orders; the ultimate amount of environmental remediation costs; the extent to which the Utility is able to
recover such costs from third parties or through rates or insurance; and the ultimate amount of environmental remediation costs the Utility incurs in connection with
environmental remediation liabilities that are not recoverable through rates or insurance, such as the remediation costs associated with the Utility’s natural gas compressor
station site located near Hinkley, California;
•the impact of new legislation, regulations, recommendations, policies, decisions, or orders relating to the operations, seismic design, security, safety, or decommissioning
of nuclear generation facilities, the storage of spent nuclear fuel or cooling water intake;
of nuclear generation facilities, the storage of spent nuclear fuel or cooling water intake;
•the occurrence of events, including cyber-attacks, that can cause unplanned outages, reduce generating output, disrupt the Utility’s service to customers, or damage or
disrupt the facilities, operations, or information technology and systems owned by the Utility, its customers, or third parties on which the Utility relies; and whether the
occurrence of such events subject the Utility to third-party liability for property damage or personal injury, or result in the imposition of civil, criminal, or regulatory penalties
on the Utility; and
•the other factors and risks discussed in PG&E Corporation and the Utility’s 2012 Annual Report on Form 10-K and other reports filed with the Securities and Exchange
Commission.
Commission.

17
3/11: Concurrent opening briefs
12/5: Concurrent reply briefs
Exhibit 2: Regulatory Calendar
2/25: Hearing on safety assessment
12/20: Final Decision
Recordkeeping
OII
OII
I. 11-02-016
Gas Pipeline
Safety OIR
Safety OIR
R. 11-02-019
Class Location
OII
OII
I. 11-11-009
1/7-1/18: Evidentiary hearings
Gas Pipeline
OII
OII
I. 12-01-007
11/20: Concurrent opening briefs
4/19: Concurrent reply briefs
1/7-1/18: Evidentiary hearings
3/25: Concurrent opening briefs
4/12: Concurrent reply briefs
5/14: PG&E coordinated reply
briefs on fines & remedies
5/24: Rebuttal briefs
on fines & remedies
1/11: PG&E financial analysis
testimony
testimony
2/8: CPSD
rebuttal testimony
3/4-3/5:
Evidentiary
hearings
Evidentiary
hearings
4/26: Briefs on
fines & remedies
5/14: PG&E coordinated reply
briefs on fines & remedies
5/24: Rebuttal briefs
on fines & remedies
1/11: PG&E financial analysis
testimony
testimony
2/8: CPSD
rebuttal testimony
3/4-3/5:
Evidentiary
hearings
Evidentiary
hearings
4/26: Briefs on
fines & remedies
5/14: PG&E coordinated reply
briefs on fines & remedies
5/24: Rebuttal briefs
on fines & remedies
1/11: PG&E financial analysis
testimony
testimony
2/8: CPSD
rebuttal testimony
3/4-3/5:
Evidentiary
hearings
Evidentiary
hearings
4/26: Briefs on
fines & remedies
2/21: Replies to requests for rehearing
1/28: Intervenor requests for rehearing

Exhibit 3: Reconciliation of PG&E Corporation Earnings from Operations to
Consolidated Income Available for Common Shareholders in Accordance with
Generally Accepted Accounting Principles (“GAAP”)
Consolidated Income Available for Common Shareholders in Accordance with
Generally Accepted Accounting Principles (“GAAP”)
(4) The Utility recorded charges of $11 million and $106 million, pre-tax, during the three and twelve months ended December 31, 2012, respectively, for environmental remediation
costs associated with the Hinkley natural gas compressor site.
costs associated with the Hinkley natural gas compressor site.
(2) Items impacting comparability reconcile earnings from operations with Consolidated Income Available for Common Shareholders as reported in accordance with GAAP.
(3) PG&E Corporation’s subsidiary, Pacific Gas and Electric Company (“Utility”) incurred net costs of $426 million and $812 million, pre-tax, during the three and twelve months
ended December 31, 2012, respectively, in connection with natural gas matters. These amounts included pipeline-related expenses that will not be recoverable through rates to
validate safe operating pressures, conduct strength testing, and perform other activities associated with safety improvements to the Utility’s natural gas pipeline system, as well as
legal and regulatory costs. In addition, a charge was recorded for disallowed capital expenditures related to the Utility’s pipeline safety enhancement plan that are forecasted to
exceed the California Public Utilities Commission’s (“CPUC”) authorized levels or that were specifically disallowed. These amounts also included an additional provision for
penalties deemed probable of being imposed on the Utility in connection with pending CPUC investigations and other potential enforcement matters regarding the Utility’s natural
gas operating practices. Costs incurred for the twelve months ended December 31, 2012 also included an increase in the accrual for third-party claims related to the San Bruno
accident and a contribution to the City of San Bruno. These costs were partially offset by insurance recoveries.

19
Exhibit 4: Reconciliation of Pacific Gas and Electric Company Earnings from Operations
to Consolidated Income Available for Common Stock in Accordance with GAAP
to Consolidated Income Available for Common Stock in Accordance with GAAP
See Exhibit 3 for accompanying footnotes.
Fourth Quarter and Year-to-Date, 2012 vs. 2011
(in millions)
20
Exhibit 5: Key Drivers of PG&E Corporation Earnings per Common Share (“EPS”) from
Operations
Operations
(1) See Exhibit 3 for a reconciliation of EPS from Operations to EPS on a GAAP basis.
Fourth Quarter and Year-to-Date, 2012 vs. 2011
($/Share, Diluted)
($/Share, Diluted)
21
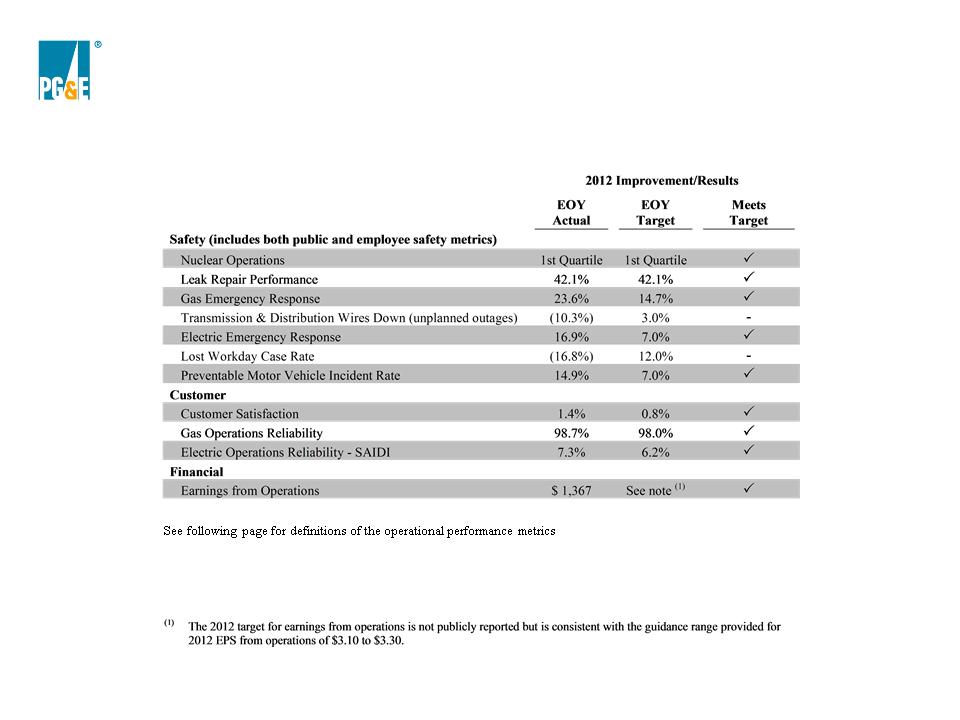
Exhibit 6: Operational Performance Metrics
Fourth Quarter 2012 Performance

22
Definitions of 2012 Operational Performance Metrics from Exhibit 6
The Operational Performance Metrics focus on three areas: safety (public and employee), customer service, and financial performance. The EOY targets for each metric
except for nuclear performance are stated relative to percentage improvement in prior year performance. The EOY actual column provides actual percentage
improvement (or decline) through the entire year. The column titled “Meets Target” shows illustratively whether or not the metric has met the EOY target.
Safety
Public safety metrics focus on Utility operations in three areas:
1.The safety of the Utility’s nuclear power operations is represented by 12 performance indicators for nuclear power generation reported to the Institute of Nuclear
Power Operations (“INPO”) and compared to industry benchmarks.
Power Operations (“INPO”) and compared to industry benchmarks.
2.The safety of the Utility’s natural gas operations is represented by (a) the percentage improvement in number of completed grade 2 leak repairs, and (b) the percentage
improvement in emergency response times of when utility gas personnel are on-site within one hour, and within 30 minutes of receiving an immediate response gas
emergency order.
improvement in emergency response times of when utility gas personnel are on-site within one hour, and within 30 minutes of receiving an immediate response gas
emergency order.
3.The safety of the Utility’s electric operations is represented by (a) the percentage improvement in the number of wire down events with resulting sustained unplanned
outages, and (b) the percentage improvement in emergency response times of when utility electric personnel relieve 911 personnel at the site of a potential PG&E
electric hazard within 60 minutes.
outages, and (b) the percentage improvement in emergency response times of when utility electric personnel relieve 911 personnel at the site of a potential PG&E
electric hazard within 60 minutes.
Employee safety metrics focus on two areas:
1.The percentage improvement in the number of Lost Workday Cases incurred per 200,000 hours worked. A lost workday case is a current year OSHA recordable
incident that has resulted in at least one lost workday.
incident that has resulted in at least one lost workday.
2.The percentage improvement in the Preventable MVI Rate, which measures the number of chargeable motor vehicle incidents per one million miles driven. A
chargeable incident is one where the employee-driver could have prevented an incident, but failed to take reasonable steps to do so.
chargeable incident is one where the employee-driver could have prevented an incident, but failed to take reasonable steps to do so.
Customer
Customer satisfaction and service reliability are measured in three areas.
1.The percentage improvement in the Customer Satisfaction Score, which measures overall satisfaction with the Utility’s performance in delivering reliable service,
pricing of services, and customer service experience. The score is weighted 60 percent for residential customers and 40 percent for small and medium business
customers, based on a quarterly survey performed by an independent third-party research firm.
pricing of services, and customer service experience. The score is weighted 60 percent for residential customers and 40 percent for small and medium business
customers, based on a quarterly survey performed by an independent third-party research firm.
2.Gas Operations Reliability is measured by the percentage improvement in the timeliness of jobs entered into the gas mapping system.
3.Electric Operations Reliability is measured by the percentage improvement in the System Average Interruption Duration Index (“SAIDI”), which reflects the total time
the average customer is without electric power, measured in minutes.
the average customer is without electric power, measured in minutes.
Financial
Earnings from operations measures PG&E Corporation’s earnings power from ongoing core operations. It allows investors to compare the underlying financial
performance of the business from one period to another, exclusive of items that management believes do not reflect the normal course of operations (items impacting
comparability). The measurement is not in accordance with GAAP. For a reconciliation of earnings from operations to earnings in accordance with GAAP, see Exhibit
3 PG&E Corporation Earnings from Operations and GAAP Income.

23
Exhibit 7: Pacific Gas and Electric Company Sales and Sources Summary
Fourth Quarter and Year-to-Date, 2012 vs. 2011
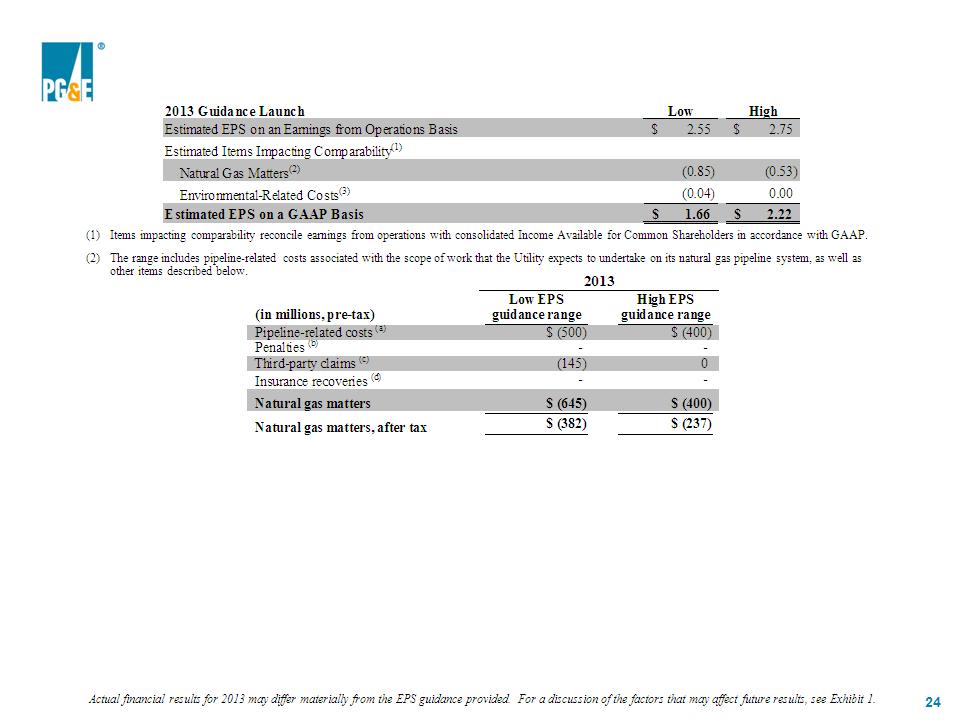
(a) The range of $400 million to $500 million reflects pipeline-related expenses that are not recoverable through rates, including to perform work associated
with the Utility’s pipeline safety enhancement plan and work related to the Utility’s multi-year effort to identify and remove encroachments from
transmission pipeline rights-of-way, the integrity management of transmission pipelines and other gas-related work, and legal and regulatory expenses.
with the Utility’s pipeline safety enhancement plan and work related to the Utility’s multi-year effort to identify and remove encroachments from
transmission pipeline rights-of-way, the integrity management of transmission pipelines and other gas-related work, and legal and regulatory expenses.
(b) Although the Utility believes the ultimate amount of penalties could be materially higher than the $200 million accrued at December 31, 2012, losses for
penalties are recognized only when deemed probable and reasonably estimable under applicable accounting standards.
penalties are recognized only when deemed probable and reasonably estimable under applicable accounting standards.
(c) Based on the cumulative charges recorded through 2012 of $455 million, the cumulative range for third-party claims is $455 million to $600 million.
(d) Although the Utility believes that a significant portion of the costs it incurs for third-party claims will be recovered through its insurance, insurance
recoveries are recognized only when deemed probable under applicable accounting standards. The guidance provided does not include any potential
future insurance recoveries or penalties (other than those already accrued) or any potential punitive damages.
recoveries are recognized only when deemed probable under applicable accounting standards. The guidance provided does not include any potential
future insurance recoveries or penalties (other than those already accrued) or any potential punitive damages.
(3) The environmental-related cost range of $0 to $30 million primarily reflects additional potential costs related to the Utility’s whole house water replacement
program and other remedial measures associated with the Hinkley natural gas compressor site. This range assumes the final groundwater remediation plan is
adopted as proposed.
program and other remedial measures associated with the Hinkley natural gas compressor site. This range assumes the final groundwater remediation plan is
adopted as proposed.
Exhibit 8: PG&E Corporation EPS Guidance
25
Actual financial results for 2013 may differ materially from the guidance provided. For a discussion of the factors that may affect future results, see Exhibit 1.
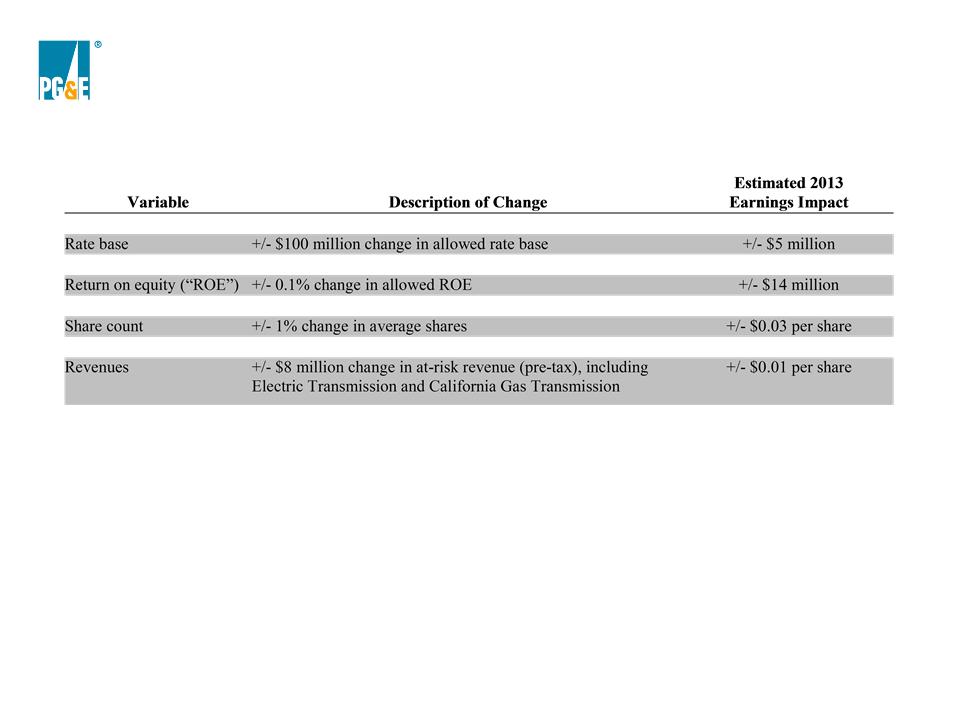
Exhibit 9: General Earnings Sensitivities
PG&E Corporation and Pacific Gas and Electric Company
PG&E Corporation and Pacific Gas and Electric Company

26
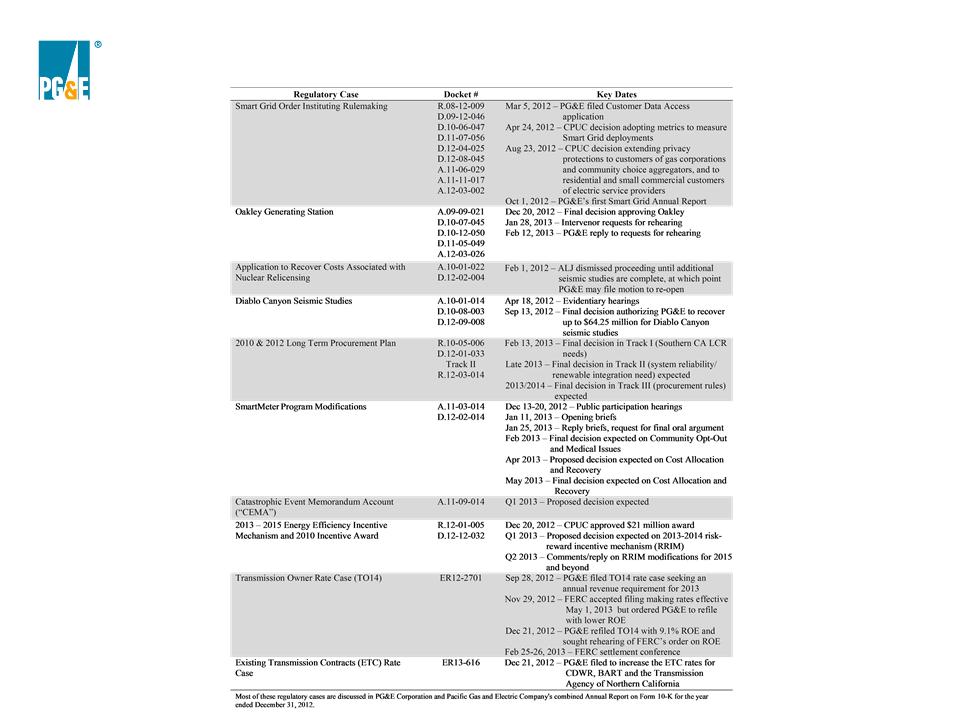
Exhibit 10: Pacific Gas and Electric Company
Summary of Selected Regulatory Cases
Summary of Selected Regulatory Cases
27
Exhibit 10: Pacific Gas and Electric Company
Summary of Selected Regulatory Cases (continued)
Summary of Selected Regulatory Cases (continued)