Attached files
| file | filename |
|---|---|
| 8-K - FORM 8-K - SONIC AUTOMOTIVE INC | d489055d8k.htm |
| EX-99.3 - EX-99.3 - SONIC AUTOMOTIVE INC | d489055dex993.htm |
| EX-99.1 - EX-99.1 - SONIC AUTOMOTIVE INC | d489055dex991.htm |
 Sonic Automotive, Inc.
1
Q4 2012 Earnings Review
February 20, 2013
Exhibit 99.2 |
 Sonic Automotive, Inc.
These forward-looking statements, risks, uncertainties and additional factors speak only as of the
date of this presentation. We undertake no obligation to update any such statements.
You are cautioned that these forward-looking statements are not guarantees of future performance,
involve risks and uncertainties and actual results may differ materially from those projected
in the forward-looking statements as a result of various factors. These risks and
uncertainties include, among other things, (a) economic conditions in the markets in which we
operate, (b) the success of our operational strategies, (c) our relationships with the
automobile manufacturers and (d) new and pre-owned vehicle sales volume. These risks and
uncertainties, as well as additional factors that could affect our forward-looking
statements, are described in our Form 10-K for the year ending December 31, 2011 and our
Form 10-Q for the quarter ended September 30, 2012. 2
Forward-Looking Statements
This presentation contains “forward-looking statements” within the meaning of the
Private Securities Litigation Reform Act of 1995. These statements relate to future
events, are not historical facts and are based on our current expectations and assumptions
regarding our business, the economy and other future conditions. These statements can
generally be identified by lead-in words such as “believe”, “expect”,
“anticipate”, “intend”, “plan”, “foresee”, “may” ,”will” and other similar words.
Statements that describe our Company’s objectives, plans or goals are also forward-looking
statements. Examples of such forward-looking information we may be discussing in this
presentation include, without limitation, further implementation of our operational strategies
and playbooks, future debt retirement, capital expenditures, operating margins and revenues,
inventory levels and new vehicle industry sales volume. |
 Sonic Automotive, Inc.
3
Sonic Automotive Q4 2012
o
Quarter in Review
o
Financial Results
o
Operations Recap
o
Summary and Outlook |
 Sonic Automotive, Inc.
4
Overall Results
Revenue Growth –
up 10.4%
New
retail
vehicle
revenue
up
15.7%
-
volume
up
14.5%
-
exceeds industry retail volume growth
Pre-owned unit volume up 6.3%
F&I revenue up 19.0%
Fixed Operations revenue up 3.0%
SG&A
at
75.4%
for
quarter
and
76.8%
for
the
year
–
beating
our
target of 78.0%
Income from continuing operations of $28.8 million, up 13.2% from
an adjusted balance in the prior year quarter*
Q4 2012 diluted EPS from continuing operations was $0.52 per
share
vs.
$0.43*
in
prior
year
period
–
up
21%
* -
Q4 2011 adjusted amounts exclude a pretax charge of $6.8M (after-tax of $4.2M),
or $0.07 per diluted share related to debt repurchase activity. See
Appendix for reconciliation to GAAP amounts. |
 Sonic Automotive, Inc.
Results (1)
B/(W) than Q4
2011
B/(W) than
FY 2011
(amounts in millions, except per share data)
Q4 2012
$
%
FY 2012
$
%
Revenue
$ 2,189
$ 205
10%
$ 8,365
$ 845
11%
Gross Profit
$ 314
$ 20
7%
$ 1,235
$ 77
7%
Operating Profit
$ 65
$ 3
5%
$ 240
$ 14
6%
Interest & Other
($ 20)
$ 2
8%
($ 78)
$ 8
9%
Continuing Ops:
Profit (after tax)
$ 29
$ 3
13%
$ 100
$ 15
17%
Diluted EPS
$ 0.52
$ 0.09
21%
$ 1.71
$ 0.28
20%
SG&A as % of Gross
75.4%
(10) bps
76.8%
20 bps
5
(1)
–
See
appendix
for
reconciliation
of
Q4
2011
adjusted
amounts
and
FY
2012
and
FY
2011
adjusted
amounts
to
GAAP
amounts.
Q4 2012 contained no adjusted amounts. |
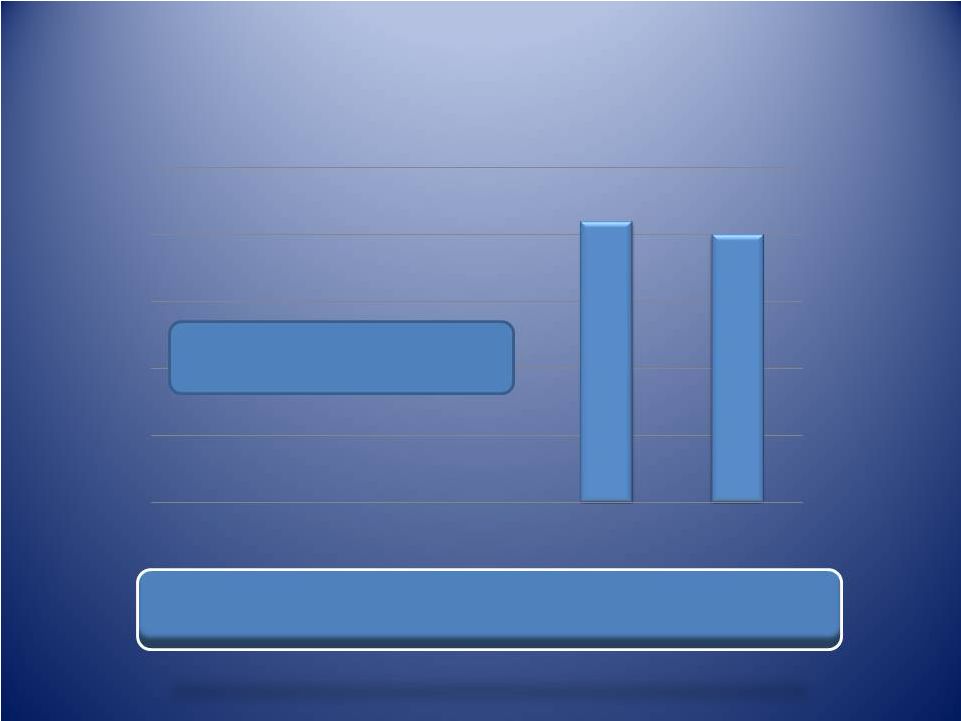
 Better than Full Year Target of 78%
(1) –
See appendix for reconciliation to GAAP amounts.
Sonic Automotive, Inc.
Q4 2011
Q4 2012
FY 2011
FY 2012
75.3%
75.4%
77.0%
76.8%
SG&A to Gross (1) |
 7
(amounts in millions)
YTD 2012
Estimated
2013
Real Estate Acquisitions
$ 14.6
$ 59.7
All Other Cap Ex
80.8
102.6
Subtotal
$ 95.4
$ 162.3
Less: Mortgage Funding
(25.7)
(65.6)
Total Cash Used –
Cap Ex
$ 69.7
$ 96.6
Capital Spending
Sonic Automotive, Inc. |
 8
Debt Covenants
Compliant with all Covenants
Covenant
Actual Q4
2012
Liquidity Ratio
>= 1.05
1.15
Fixed Charge Coverage Ratio
>= 1.20
1.69
Total Lease Adjusted Leverage
Ratio
<= 5.50
3.94
Sonic Automotive, Inc. |
 9
Public Debt Maturities
(amounts in millions)
9%
Notes
Sonic Automotive, Inc.
No Near Term Maturities
7%
Notes
$210
$200
2013
2014
2015
2018
2022
$0
$0
$0
The Converts are Gone! |
 Sonic Automotive, Inc.
Stock Repurchases
10
(shares in thousands)
Shares
Average
Price
Q4 2012 Activity
3,454
$19.27
Total 2012 Activity
4,364
$19.00
•
Approximately $50 million repurchase authorization remaining at
12/31/2012
•
Approval granted for an additional $100 million subsequent to year-end
for total unused authorization of approximately $144 million today
|
 Sonic Automotive, Inc.
Share Count
11
(amounts in thousands)
YTD
2011
YTD
2012
Expected
2013
Fully Diluted Share
Count
65,464
60,406
54,000
Decline of
17.5% |
 Sonic Automotive, Inc.
New Retail Vehicles
Q4 2012
Q4 2011
B/(W)
Volume
33,767
29,482
15%
Selling Price
$ 37,312
$ 36,946
1.0%
Gross Margin %
6.1%
6.3%
(20 bps)
GPU
$2,260
$ 2,327
($67)
Gross Profit
$76 million
$69
million
11.2%
SAAR (includes fleet)
15.0 million
13.5
million
11.1%
12 |
 Sonic Automotive, Inc.
Used Retail Vehicles
Q4 2012
Q4 2011
B/(W)
Retail Volume
23,943
22,520
6%
Used Retail GPU
$ 1,369
$ 1,461
($ 92)
Used Related Retail Gross*
$ 73
million
$ 70
million
$ 3 million
Used to New
0.71 : 1
0.76 : 1
(0.05)
Vehicles / store / month
80
75
5
13
* - Includes front-end gross plus F&I related gross and fixed operations related gross
|
 Sonic Automotive, Inc.
Fixed Operations
14
QTD YOY Gross Profit Change Breakdown:
B/(W) than Q4
2011
(amounts in millions)
Q4 2012
$
%
Revenue
$ 287
$ 8.4
3.0%
Gross Profit
$ 141
$ 3.7
2.7%
•
Customer Pay Up 1.0%
•
Whsl. Parts Down 1.0%
•
Internal & Sublet Up 8.8%
•
Warranty Up 3.9% |
 Sonic Automotive, Inc.
15
Summary
Record Q4 income from continuing operations
Record full year 2012 retail units of 231,192
Revenue growth continues at double digit rates
Continued investment in the base business while beating
our cost target for SG&A as a percent of gross for full year
Inventory levels back to normal
Effects of the elimination of the 5% Converts beginning to
show through
Poised to opportunistically repurchase shares with
additional Board authorization |
 Sonic Automotive, Inc.
16
2013 Outlook
•
Expect New Vehicle SAAR of 15.0 to 15.5 Million
•
Pre-Owned Vehicle Growth in Mid-Single Digits
•
Property Purchases to Continue
•
Expect SG&A to be Below 77%
•
Targeting 2013 Diluted EPS from Continuing
Operations
of
$1.93
-
$2.03 |
 Sonic Automotive, Inc.
17 |
 Sonic Automotive, Inc.
Predictable
Repeatable
Sustainable
•
Grow the Base Business
-
Developing
Predictable
-
Repeatable
-
Sustainable
Business
Model
•
Playbooks -
Uniform Best Practices
•
People
-
Culture
of
Customer-Centric
Organization
•
Systems -
Stable, Flexible and Secure Delivery Systems
•
Data -
Use to Drive Business Decisions Throughout the Organization
-
Grow Through Knowledge in Core Competencies
•
Own Our Properties
-
Create Value on the Balance Sheet
-
Lower Cost Option
•
Opportunistically Grow through Acquisitions
–
Tuck in acquisitions
–
Open points
•
Improve Capital Structure
-
Buy Back Stock Opportunistically
-
Manage Debt Levels
-
Offer Dividend to Reward Shareholders
Strategic Focus
18 |
 Sonic Automotive, Inc.
Reconciliation of Non-GAAP Financial Information
19
Fourth Quarter Ended December 31,
Adjusted 2012 B/(W)
2012
2011
than Adjusted 2011
($ in millions, shares in
thousands, except per share data)
As
Reported
Adjustments
As
Adjusted
As
Reported
Adjustments
As
Adjusted
$
%
Revenues
2,188.7
$
-
$
2,188.7
$
1,983.4
$
-
$
1,983.4
$
205.3
$
10.4%
Gross profit
314.1
-
314.1
293.7
-
293.7
20.4
7.0%
Gross margin
14.4%
14.4%
14.8%
14.8%
(40) bps
SG&A
(236.8)
-
(236.8)
(227.9)
6.8
(1)
(221.1)
(15.7)
(7.1%)
SG&A as % of gross profit
75.4%
75.4%
77.6%
75.3%
(10) bps
Impairment charges
(0.4)
-
(0.4)
(0.0)
-
(0.0)
(0.3)
(857.5%)
Depreciation and amortization
(11.9)
-
(11.9)
(10.3)
-
(10.3)
(1.6)
(15.9%)
Operating income
65.1
-
65.1
55.5
6.8
62.3
2.8
4.5%
Operating margin
3.0%
3.0%
2.8%
3.1%
(10) bps
Interest expense, floor plan
(5.5)
-
(5.5)
(4.6)
-
(4.6)
(0.9)
(20.6%)
Interest expense, other, net
(14.2)
-
(14.2)
(16.3)
-
(16.3)
2.1
12.9%
Other income (expense), net
0.2
-
0.2
(0.3)
-
(0.3)
0.4
169.1%
Income (loss) from continuing operations
28.8
-
28.8
21.2
4.2
25.4
3.4
13.2%
Income (loss) from discontinued operations
1.6
-
1.6
(0.7)
(0.4)
(2)
(1.1)
2.7
245.9%
Net income (loss)
30.4
$
-
$
30.4
$
20.5
$
3.8
$
24.4
$
6.0
$
24.8%
Diluted earnings (loss) per common share:
Earnings (loss) per share
from continuing operations
0.52
$
-
$
0.52
$
0.36
$
0.07
$
0.43
$
0.09
$
20.9%
Earnings (loss) per share from
discontinued operations
0.03
-
0.03
(0.01)
(0.01)
(0.02)
0.05
250.0%
Earnings (loss) per common share
0.55
$
-
$
0.55
$
0.35
$
0.06
$
0.41
$
0.14
$
34.1%
Weighted average shares outstanding
54,763
54,763
64,467
64,467
(1) Represents lease exit adjustments and legal settlement charges.
(2) Represents tax-effected amounts related to lease exit
adjustments. This
release
contains
certain
non-GAAP
financial
measures
(the
"Adjusted"
columns)
as
defined
under
SEC
rules,
such
as,
but
not
limited
to,
adjusted
income
from
continuing
operations
and
related
earnings
per
share
data.
The
Company
has
reconciled
these
measures
to
the
most
directly
comparable
GAAP
measures
(the
"Reported"
columns)
in
the
release.
The
Company
believes
that
these
non-GAAP
financial
measures
improve
the
transparency
of
the
Company’s
disclosure
by
providing
period-to-period
comparability
of
the
Company’s
results
from
operations. |
 Sonic Automotive, Inc.
Reconciliation of Non-GAAP Financial Information
20
Year Ended December 31,
Adjusted 2012 B/(W)
2012
2011
than Adjusted 2011
($ in millions, shares in
thousands, except per share data)
As
Reported
Adjustments
As
Adjusted
As
Reported
Adjustments
As
Adjusted
$
%
Revenues
8,365.5
$
-
$
8,365.5
$
7,520.8
$
-
$
7,520.8
$
844.7
$
11.2%
Gross profit
1,235.2
-
1,235.2
1,158.6
-
1,158.6
76.5
6.6%
Gross margin
14.8%
14.8%
15.4%
15.4%
(60) bps
SG&A
(949.0)
-
(949.0)
(899.4)
6.8
(3)
(892.6)
(56.4)
(6.3%)
SG&A as % of gross profit
76.8%
76.8%
77.6%
77.0%
20
bps
Impairment charges
(0.4)
-
(0.4)
(0.2)
-
(0.2)
(0.2)
(120.0%)
Depreciation and amortization
(45.3)
-
(45.3)
(39.4)
-
(39.4)
(5.8)
(14.8%)
Operating income
240.4
-
240.4
219.5
6.8
226.4
14.0
6.2%
Operating margin
2.9%
2.9%
2.9%
3.0%
(10) bps
Interest expense, floor plan
(19.5)
-
(19.5)
(18.4)
-
(18.4)
(1.0)
(5.7%)
Interest expense, other, net
(60.1)
1.2
(1)
(58.9)
(66.9)
-
(66.9)
7.9
11.9%
Other income (expense), net
(19.6)
19.7
(2)
0.1
(1.0)
-
(1.0)
1.1
108.7%
Income (loss) from continuing operations
91.3
9.2
100.4
81.5
4.2
85.7
14.7
17.1%
Income (loss) from discontinued operations
(2.2)
-
(2.2)
(5.3)
(0.4)
(4)
(5.7)
3.5
61.9%
Net income (loss)
89.1
$
9.2
$
98.3
$
76.3
$
3.8
$
80.1
$
18.2
$
22.7%
Diluted earnings (loss) per common share:
Earnings (loss) per share
from continuing operations
1.56
$
0.15
$
1.71
$
1.37
$
0.06
$
1.43
$
0.28
$
19.6%
Earnings (loss) per share from
discontinued operations
(0.03)
-
(0.03)
(0.08)
-
(0.08)
0.05
62.5%
Earnings (loss) per common share
1.53
$
0.15
$
1.68
$
1.29
$
0.06
$
1.35
$
0.33
$
24.4%
Weighted average shares outstanding
60,406
60,406
65,464
65,464
(1) Represents double-carry interest in July 2012.
(2) Represents debt extinguishment charges related to the 5% Convertible
Notes. (3) Represents lease exit adjustments and legal settlement
charges. (4) Represents tax-effected amounts related to lease
exit adjustments. This release contains certain non-GAAP
financial measures (the "Adjusted" columns) as defined under SEC rules, such as, but not limited to, adjusted income from continuing operations and related earnings
per
share
data.
The
Company
has
reconciled
these
measures
to
the
most
directly
comparable
GAAP
measures
(the
"Reported"
columns)
in
the
release.
The
Company
believes
that
these
non-GAAP
financial
measures improve the transparency of the Company’s disclosure by
providing period-to-period comparability of the Company’s results from operations. |
 Sonic Automotive, Inc.
Reconciliation of Non-GAAP Financial Information
21
Fourth Quarter Ended December 31, 2012
Continuing Operations
Discontinued Operations
Total Operations
($ in millions, shares in
thousands, except per share data)
Net Income
(Loss):
Numerator
Share
Count:
Denominator
Diluted
EPS
Net Income
(Loss):
Numerator
Share
Count:
Denominator
Diluted
EPS
Net Income
(Loss):
Numerator
Share
Count:
Denominator
Diluted
EPS
Reported basic
28.8
$
54,289
1.6
$
54,289
30.4
$
54,289
Effect of dilutive securities:
Two class method
(0.4)
-
-
-
(0.4)
-
Stock compensation plans
-
474
-
474
-
474
Reported
diluted 28.4
54,763
0.52
$
1.6
54,763
0.03
$
30.0
54,763
0.55
$
Adjusted diluted
28.4
$
54,763
0.52
$
1.6
$
54,763
0.03
$
30.0
$
54,763
0.55
$
Fourth Quarter Ended December 31, 2011
Continuing Operations
Discontinued Operations
Total Operations
($ in millions, shares in
thousands, except per share data)
Net Income
(Loss):
Numerator
Share
Count:
Denominator
Diluted
EPS
Net Income
(Loss):
Numerator
Share
Count:
Denominator
Diluted
EPS
Net Income
(Loss):
Numerator
Share
Count:
Denominator
Diluted
EPS
Reported basic
21.2
$
52,194
(0.7)
$
52,194
20.5
$
52,194
Effect of dilutive securities:
Two class method
(0.2)
-
-
-
(0.2)
-
Contingently convertible debt
2.3
11,713
-
11,713
2.3
11,713
Stock compensation plans
-
560
-
560
-
560
Reported
diluted 23.3
64,467
0.36
$
(0.7)
64,467
(0.01)
$
22.6
64,467
0.35
$
Adjustments (tax-effected):
Lease exit adjustments
0.7
-
(0.4)
-
0.3
-
Legal settlement charges
3.5
-
-
-
3.5
-
Adjusted diluted
27.5
$
64,467
0.43
$
(1.1)
$
64,467
(0.02)
$
26.4
$
64,467
0.41
$ |
 Sonic Automotive, Inc.
Reconciliation of Non-GAAP Financial Information
22
Year Ended December 31, 2012
Continuing Operations
Discontinued Operations
Total Operations
($ in millions, shares in
thousands, except per share data)
Net Income
(Loss):
Numerator
Share
Count:
Denominator
Diluted
EPS
Net Income
(Loss):
Numerator
Share
Count:
Denominator
Diluted
EPS
Net Income
(Loss):
Numerator
Share
Count:
Denominator
Diluted
EPS
Reported basic
91.3
$
53,550
(2.2)
$
53,550
89.1
$
53,550
Effect of dilutive securities:
Two class method
(1.4)
-
-
-
(1.4)
-
Contingently convertible debt
4.6
6,411
0.1
6,411
4.7
6,411
Stock compensation plans
-
445
-
445
-
445
Reported
diluted 94.5
60,406
1.56
$
(2.1)
60,406
(0.03)
$
92.4
60,406
1.53
$
Adjustments (tax-effected):
Double-carry interest
0.7
-
-
-
0.7
-
Debt extinguishment charges
12.1
-
-
-
12.1
-
Settlement of state tax examination
(3.6)
-
-
-
(3.6)
-
Adjusted diluted
103.7
$
60,406
1.71
$
(2.1)
$
60,406
(0.03)
$
101.6
$
60,406
1.68
$
Year Ended December 31, 2011
Continuing Operations
Discontinued Operations
Total Operations
($ in millions, shares in
thousands, except per share data)
Net Income
(Loss):
Numerator
Share
Count:
Denominator
Diluted
EPS
Net Income
(Loss):
Numerator
Share
Count:
Denominator
Diluted
EPS
Net Income
(Loss):
Numerator
Share
Count:
Denominator
Diluted
EPS
Reported basic
81.5
$
52,358
(5.2)
$
52,358
76.3
$
52,358
Effect of dilutive securities:
Two class method
(1.0)
-
-
-
(1.0)
-
Contingently convertible debt
9.1
12,517
0.2
12,517
9.3
12,517
Stock compensation plans
-
589
-
589
-
589
Reported
diluted 89.6
65,464
1.37
$
(5.0)
65,464
(0.08)
$
84.6
65,464
1.29
$
Adjustments (tax-effected):
Lease exit adjustments
0.7
-
(0.4)
-
0.3
-
Legal settlement charges
3.5
-
-
-
3.5
-
Adjusted diluted
93.8
$
65,464
1.43
$
(5.4)
$
65,464
(0.08)
$
88.4
$
65,464
1.35
$ |