Attached files
| file | filename |
|---|---|
| 8-K - 8-K - Polypore International, Inc. | a13-5581_28k.htm |
Exhibit 99.1
|
|
(NYSE Listed: PPO) Fourth Quarter 2012 Supplemental Financial Information |
|
|
These materials include "forward-looking statements." All statements other than statements of historical facts included in these materials that address activities, events or developments that we expect, believe or anticipate will or may occur in the future are forward-looking statements including, in particular, the statements about Polypore International's plans, objectives, strategies and prospects regarding, among other things, the financial condition, results of operations and business of Polypore International and its subsidiaries. We have identified some of these forward-looking statements with words like "believe," "may," "will," "should," "expect," "intend," "plan," "predict," "anticipate," "estimate" or "continue" and other words and terms of similar meaning. These forward-looking statements are based on current expectations about future events affecting us and are subject to uncertainties and factors relating to our operations and business environment, all of which are difficult to predict and many of which are beyond our control. Many factors mentioned in our discussion in these materials will be important in determining future results. Although we believe that the expectations reflected in our forward-looking statements are reasonable, we do not know whether our expectations will prove correct. They can be affected by inaccurate assumptions we might make or by known or unknown risks and uncertainties, including with respect to Polypore International, the following, among other things: the highly competitive nature of the markets in which we sell our products; the failure to continue to develop innovative products; the loss of our customers; the vertical integration by our customers of the production of our products into their own manufacturing process; increases in prices for raw materials or the loss of key supplier contracts; our substantial indebtedness; interest rate risk related to our variable rate indebtedness; our inability to generate cash; restrictions related to the senior secured credit agreement; employee slowdowns, strikes or similar actions; product liability claims exposure; risks in connection with our operations outside the United States, including compliance with applicable anti-corruption laws; the incurrence of substantial costs to comply with, or as a result of violations of, or liabilities under environmental laws; the failure to protect our intellectual property; the loss of senior management; the incurrence of additional debt, contingent liabilities and expenses in connection with future acquisitions; the failure to effectively integrate newly acquired operations; lithium market demand does not materialize as anticipated; the absence of expected returns from the intangible assets we have recorded; the adverse impact from legal proceedings on our financial condition; and natural disasters, epidemics, terrorist acts and other events beyond our control. Because our actual results, performance or achievements could differ materially from those expressed in, or implied by, the forward-looking statements, we cannot give any assurance that any of the events anticipated by the forward-looking statements will occur or, if any of them do, what impact they will have on Polypore International's results of operations and financial condition. You are cautioned not to place undue reliance on these forward-looking statements, which speak only as of the date of these materials. We do not undertake any obligation to update these forward-looking statements in these materials to reflect new information, future events or otherwise, except as may be required under federal securities laws. Safe Harbor Statement 2 |
|
|
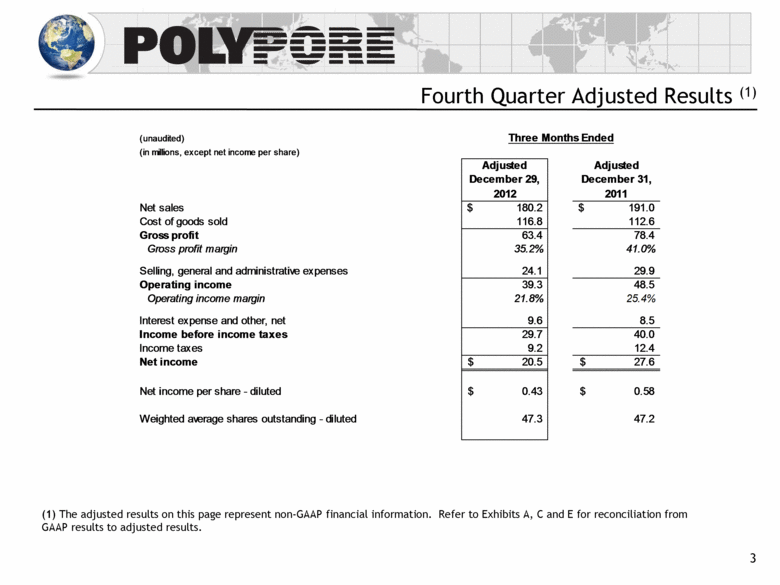
3 Fourth Quarter Adjusted Results (1) Three Months Ended (unaudited) (in millions, except net income per share) Adjusted Adjusted December 29, December 31, 2012 2011 Net sales 180.2 $ 191.0 $ Cost of goods sold 116.8 112.6 Gross profit 63.4 78.4 Gross profit margin 35.2% 41.0% Selling, general and administrative expenses 24.1 29.9 Operating income 39.3 48.5 Operating income margin 21.8% 25.4% Interest expense and other, net 9.6 8.5 Income before income taxes 29.7 40.0 Income taxes 9.2 12.4 Net income 20.5 $ 27.6 $ Net income per share - diluted 0.43 $ 0.58 $ Weighted average shares outstanding - diluted 47.3 47.2 (1) The adjusted results on this page represent non-GAAP financial information. Refer to Exhibits A, C and E for reconciliation from GAAP results to adjusted results. |
|
|
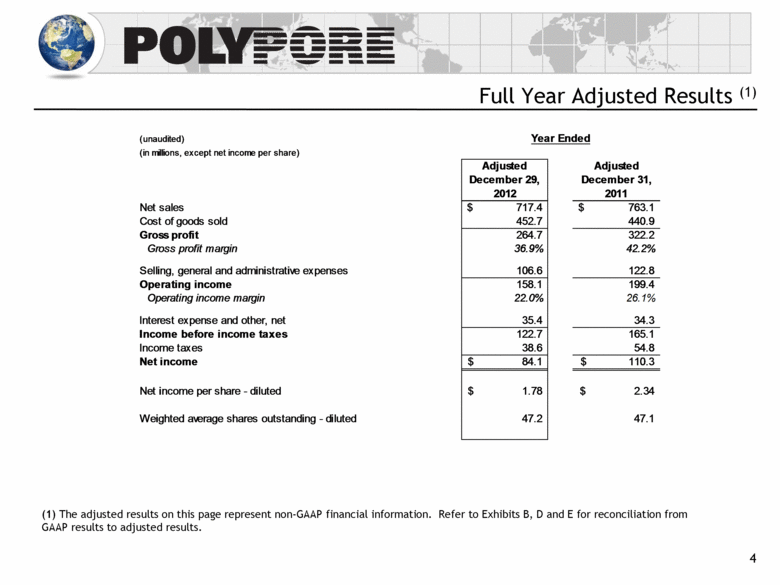
4 Full Year Adjusted Results (1) Year Ended (unaudited) (in millions, except net income per share) Adjusted Adjusted December 29, December 31, 2012 2011 Net sales 717.4 $ 763.1 $ Cost of goods sold 452.7 440.9 Gross profit 264.7 322.2 Gross profit margin 36.9% 42.2% Selling, general and administrative expenses 106.6 122.8 Operating income 158.1 199.4 Operating income margin 22.0% 26.1% Interest expense and other, net 35.4 34.3 Income before income taxes 122.7 165.1 Income taxes 38.6 54.8 Net income 84.1 $ 110.3 $ Net income per share - diluted 1.78 $ 2.34 $ Weighted average shares outstanding - diluted 47.2 47.1 (1) The adjusted results on this page represent non-GAAP financial information. Refer to Exhibits B, D and E for reconciliation from GAAP results to adjusted results. |
|
|
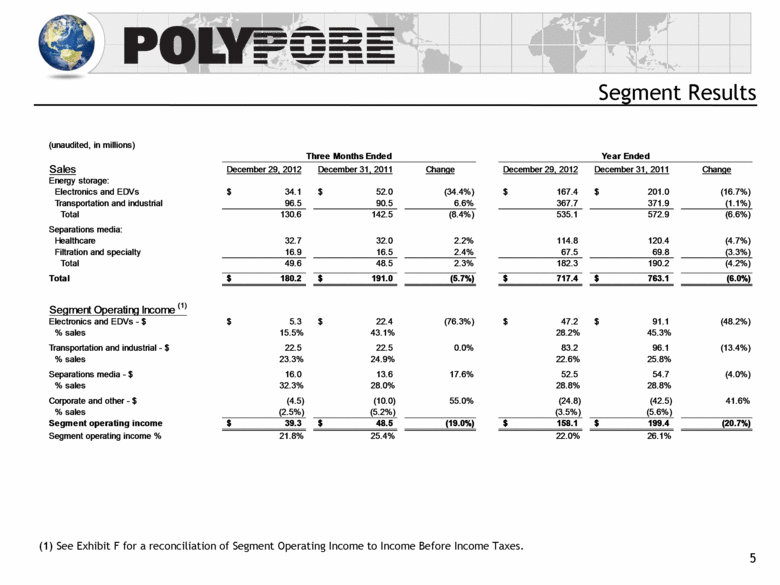
5 Segment Results Three Months Ended Year Ended (unaudited, in millions) Sales December 29, 2012 December 31, 2011 Change December 29, 2012 December 31, 2011 Change Energy storage: Electronics and EDVs 34.1 $ 52.0 $ (34.4%) 167.4 $ 201.0 $ (16.7%) Transportation and industrial 96.5 90.5 6.6% 367.7 371.9 (1.1%) Total 130.6 142.5 (8.4%) 535.1 572.9 (6.6%) Separations media: Healthcare 32.7 32.0 2.2% 114.8 120.4 (4.7%) Filtration and specialty 16.9 16.5 2.4% 67.5 69.8 (3.3%) Total 49.6 48.5 2.3% 182.3 190.2 (4.2%) ` Total 180.2 $ 191.0 $ (5.7%) 717.4 $ 763.1 $ (6.0%) Segment Operating Income (1) Electronics and EDVs - $ 5.3 $ 22.4 $ (76.3%) 47.2 $ 91.1 $ (48.2%) % sales 15.5% 43.1% 28.2% 45.3% Transportation and industrial - $ 22.5 22.5 0.0% 83.2 96.1 (13.4%) % sales 23.3% 24.9% 22.6% 25.8% Separations media - $ 16.0 13.6 17.6% 52.5 54.7 (4.0%) % sales 32.3% 28.0% 28.8% 28.8% Corporate and other - $ (4.5) (10.0) 55.0% (24.8) (42.5) 41.6% % sales (2.5%) (5.2%) (3.5%) (5.6%) Segment operating income 39.3 $ 48.5 $ (19.0%) 158.1 $ 199.4 $ (20.7%) Segment operating income % 21.8% 25.4% 22.0% 26.1% (1) See Exhibit F for a reconciliation of Segment Operating Income to Income Before Income Taxes. |
|
|
6 EXHIBITS |
|
|
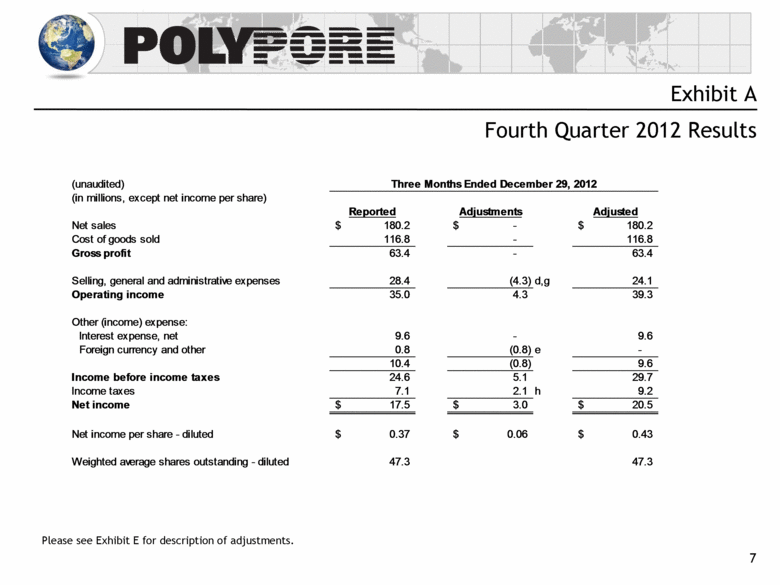
7 Exhibit A Fourth Quarter 2012 Results (unaudited) Three Months Ended December 29, 2012 (in millions, except net income per share) Reported Adjustments Adjusted Net sales 180.2 $ - $ 180.2 $ Cost of goods sold 116.8 - 116.8 Gross profit 63.4 - 63.4 Selling, general and administrative expenses 28.4 (4.3) d,g 24.1 Operating income 35.0 4.3 39.3 Other (income) expense: Interest expense, net 9.6 - 9.6 Foreign currency and other 0.8 (0.8) e - 10.4 (0.8) 9.6 Income before income taxes 24.6 5.1 29.7 Income taxes 7.1 2.1 h 9.2 Net income 17.5 $ 3.0 $ 20.5 $ Net income per share - diluted 0.37 $ 0.06 $ 0.43 $ Weighted average shares outstanding - diluted 47.3 47.3 Please see Exhibit E for description of adjustments. |
|
|
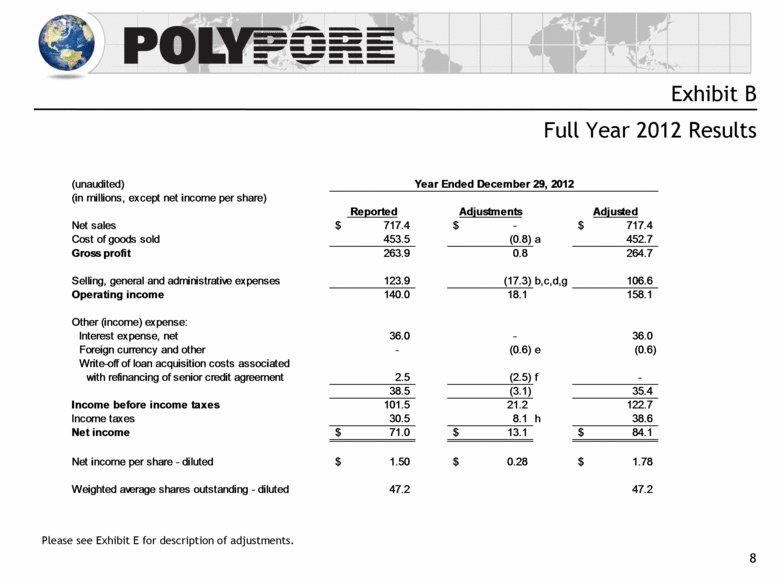
8 Exhibit B Full Year 2012 Results (unaudited) Year Ended December 29, 2012 (in millions, except net income per share) Reported Adjustments Adjusted Net sales 717.4 $ - $ 717.4 $ Cost of goods sold 453.5 (0.8) a 452.7 Gross profit 263.9 0.8 264.7 Selling, general and administrative expenses 123.9 (17.3) b,c,d,g 106.6 Operating income 140.0 18.1 158.1 Other (income) expense: Interest expense, net 36.0 - 36.0 Foreign currency and other - (0.6) e (0.6) Write-off of loan acquisition costs associated with refinancing of senior credit agreement 2.5 (2.5) f - 38.5 (3.1) 35.4 Income before income taxes 101.5 21.2 122.7 Income taxes 30.5 8.1 h 38.6 Net income 71.0 $ 13.1 $ 84.1 $ Net income per share - diluted 1.50 $ 0.28 $ 1.78 $ Weighted average shares outstanding - diluted 47.2 47.2 Please see Exhibit E for description of adjustments. |
|
|
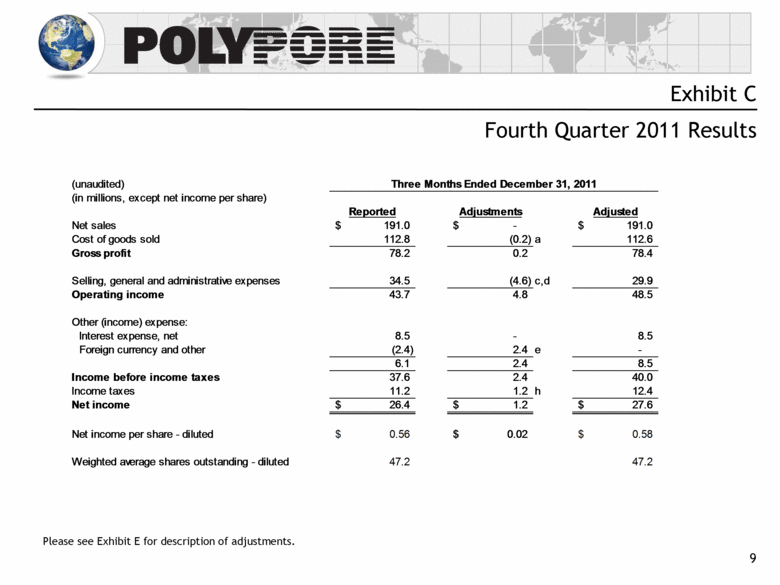
9 Exhibit C Fourth Quarter 2011 Results (unaudited) Three Months Ended December 31, 2011 (in millions, except net income per share) Reported Adjustments Adjusted Net sales 191.0 $ - $ 191.0 $ Cost of goods sold 112.8 (0.2) a 112.6 Gross profit 78.2 0.2 78.4 Selling, general and administrative expenses 34.5 (4.6) c,d 29.9 Operating income 43.7 4.8 48.5 Other (income) expense: Interest expense, net 8.5 - 8.5 Foreign currency and other (2.4) 2.4 e - 6.1 2.4 8.5 Income before income taxes 37.6 2.4 40.0 Income taxes 11.2 1.2 h 12.4 Net income 26.4 $ 1.2 $ 27.6 $ Net income per share - diluted 0.56 $ 0.02 $ 0.58 $ Weighted average shares outstanding - diluted 47.2 47.2 Please see Exhibit E for description of adjustments. |
|
|
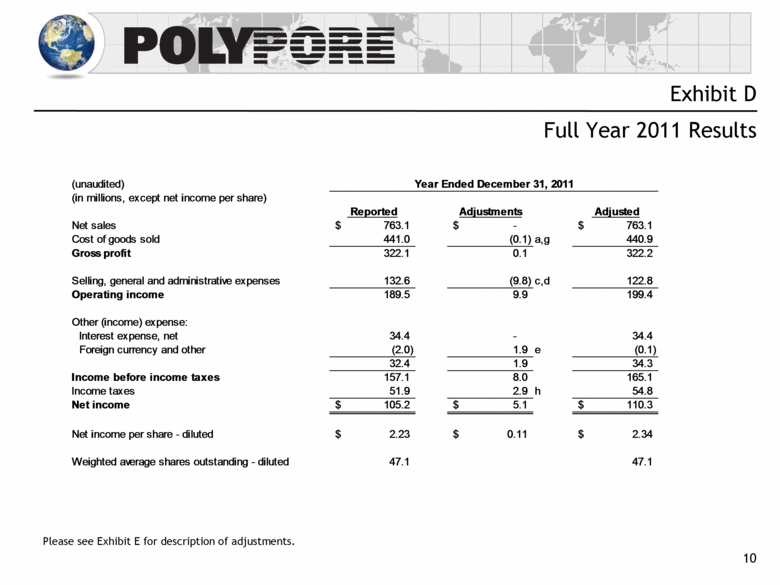
10 Exhibit D Full Year 2011 Results (unaudited) Year Ended December 31, 2011 (in millions, except net income per share) Reported Adjustments Adjusted Net sales 763.1 $ - $ 763.1 $ Cost of goods sold 441.0 (0.1) a,g 440.9 Gross profit 322.1 0.1 322.2 Selling, general and administrative expenses 132.6 (9.8) c,d 122.8 Operating income 189.5 9.9 199.4 Other (income) expense: Interest expense, net 34.4 - 34.4 Foreign currency and other (2.0) 1.9 e (0.1) 32.4 1.9 34.3 Income before income taxes 157.1 8.0 165.1 Income taxes 51.9 2.9 h 54.8 Net income 105.2 $ 5.1 $ 110.3 $ Net income per share - diluted 2.23 $ 0.11 $ 2.34 $ Weighted average shares outstanding - diluted 47.1 47.1 Please see Exhibit E for description of adjustments. |
|
|
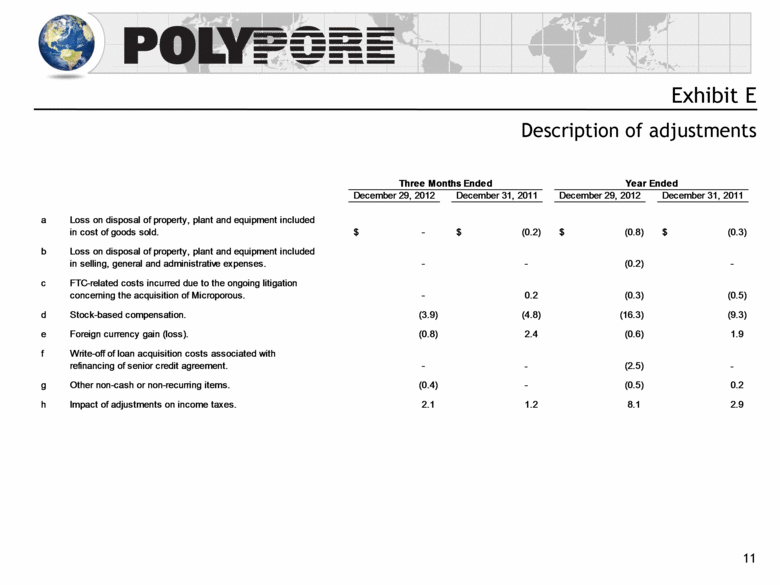
11 Exhibit E Description of adjustments Three Months Ended Year Ended December 29, 2012 December 31, 2011 December 29, 2012 December 31, 2011 a Loss on disposal of property, plant and equipment included in cost of goods sold. - $ (0.2) $ (0.8) $ (0.3) $ b Loss on disposal of property, plant and equipment included in selling, general and administrative expenses. - - (0.2) - c FTC-related costs incurred due to the ongoing litigation concerning the acquisition of Microporous. - 0.2 (0.3) (0.5) d Stock-based compensation. (3.9) (4.8) (16.3) (9.3) e Foreign currency gain (loss). (0.8) 2.4 (0.6) 1.9 f Write-off of loan acquisition costs associated with refinancing of senior credit agreement. - - (2.5) - g Other non-cash or non-recurring items. (0.4) - (0.5) 0.2 h Impact of adjustments on income taxes. 2.1 1.2 8.1 2.9 |
|
|
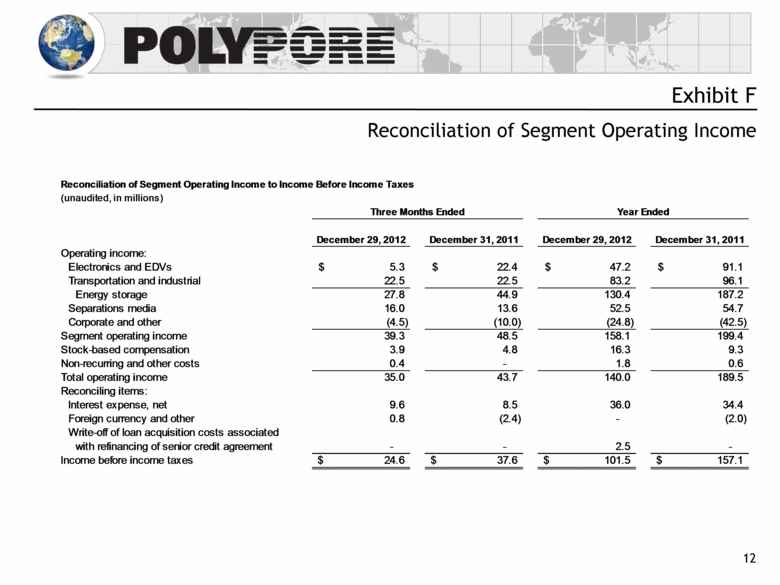
12 Exhibit F Reconciliation of Segment Operating Income Reconciliation of Segment Operating Income to Income Before Income Taxes (unaudited, in millions) Three Months Ended Year Ended December 29, 2012 December 31, 2011 December 29, 2012 December 31, 2011 Operating income: Electronics and EDVs 5.3 $ 22.4 $ 47.2 $ 91.1 $ Transportation and industrial 22.5 22.5 83.2 96.1 Energy storage 27.8 44.9 130.4 187.2 Separations media 16.0 13.6 52.5 54.7 Corporate and other (4.5) (10.0) (24.8) (42.5) Segment operating income 39.3 48.5 158.1 199.4 Stock-based compensation 3.9 4.8 16.3 9.3 Non-recurring and other costs 0.4 - 1.8 0.6 Total operating income 35.0 43.7 140.0 189.5 Reconciling items: Interest expense, net 9.6 8.5 36.0 34.4 Foreign currency and other 0.8 (2.4) - (2.0) Write-off of loan acquisition costs associated with refinancing of senior credit agreement - - 2.5 - Income before income taxes 24.6 $ 37.6 $ 101.5 $ 157.1 |