Attached files
| file | filename |
|---|---|
| EX-99.1 - EXHIBIT 99.1 - CreXus Investment Corp. | a50569261_ex991.htm |
| 8-K - CREXUS INVESTMENT CORP. 8-K - CreXus Investment Corp. | a50569261.htm |
Exhibit 99.2
CREXUS INVESTMENT CORP. 1 WWW.CREXUSINVESTMENT.COM SUPPLEMENTAL INVESTMENT INFORMATION QUARTER ENDED DECEMBER 31, 2012
CREXUS INVESTMENT CORP. 2 Disclaimer This presentation and our public documents to which we refer contain or incorporate by reference certain forward-looking statements within the meaning of Section 27A of the Securities Act of 1933 and Section 21E of the Securities Exchange Act of 1934. Forward-looking statements which are based on various assumptions (some of which are beyond our control) may be identified by reference to a future period or periods or by the use of forward-looking terminology, such as “believe,” “expect,” “anticipate,” “estimate,” “plan,” “continue,” “intend,” “should,” “may,” “would,” “will” or similar expressions, or variations on those terms or the negative of those terms. Actual results could differ materially from those set forth in forward-looking statements due to a variety of factors, including, but not limited to, our business and strategy; our ability to consummate the transaction contemplated by the agreement and plan of merger with Annaly Capital Management, Inc. and its subsidiary CXS Acquisition Corporation; our ability to obtain and maintain financing arrangements and the terms of such arrangements; financing and advance rates for our targeted assets; general volatility of the markets in which we acquire assets; the implementation, timing and impact of, and changes to, various government programs; our expected assets; changes in the value of our assets; market trends in our industry, interest rates, the debt securities markets or the general economy; rates of default or decreased recovery rates on our assets; our continuing or future relationships with third parties; prepayments of the mortgage and other loans underlying our mortgage-backed or other asset-backed securities; the degree to which our hedging strategies may or may not protect us from interest rate volatility; changes in governmental regulations, tax law and rates, accounting guidance, and similar matters; our ability to maintain our qualification as a REIT for federal income tax purposes; ability to maintain our exemption from registration under the Investment Company Act of 1940, as amended; the availability of opportunities in real estate-related and other securities; the availability of qualified personnel; estimates relating to our ability to make distributions to our stockholders in the future; our understanding of our competition; interest rate mismatches between our assets and our borrowings used to finance purchases of such assets; changes in interest rates and mortgage prepayment rates; the effects of interest rate caps on our adjustable-rate mortgage-backed securities; our ability to integrate acquired assets into our existing portfolio; and our ability to realize our expectations of the advantages of acquiring assets. For a discussion of the risks and uncertainties which could cause actual results to differ from those contained in the forward-looking statements, see “Risk Factors” in our most recent annual report on Form 10-K and subsequent quarterly reports on Form 10-Q. We do not undertake, and specifically disclaim all obligations, to publicly release the result of any revisions which may be made to any forward-looking statements to reflect the occurrence of anticipated or unanticipated events or circumstances after the date of such statements. This presentation may contain statistics and other data that in some cases has been obtained from or compiled from information made available by third-party service providers. LTV ratios are based on third party appraisals, some of which were obtained when the loans were originated which in certain cases are prior to our acquiring the loans.
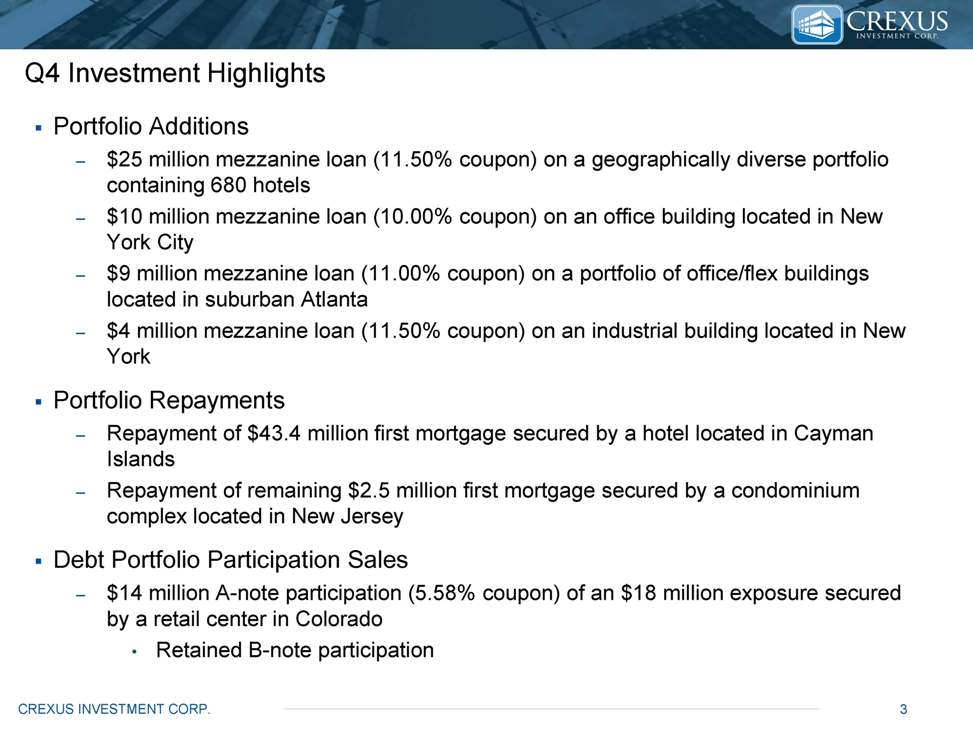
CREXUS INVESTMENT CORP. 3 Q4 Investment Highlights Portfolio Additions –$25 million mezzanine loan (11.50% coupon) on a geographically diverse portfolio containing 680 hotels –$10 million mezzanine loan (10.00% coupon) on an office building located in New York City –$9 million mezzanine loan (11.00% coupon) on a portfolio of office/flex buildings located in suburban Atlanta –$4 million mezzanine loan (11.50% coupon) on an industrial building located in New York Portfolio Repayments –Repayment of $43.4 million first mortgage secured by a hotel located in Cayman Islands –Repayment of remaining $2.5 million first mortgage secured by a condominium complex located in New Jersey Debt Portfolio Participation Sales –$14 million A-note participation (5.58% coupon) of an $18 million exposure secured by a retail center in Colorado •Retained B-note participation
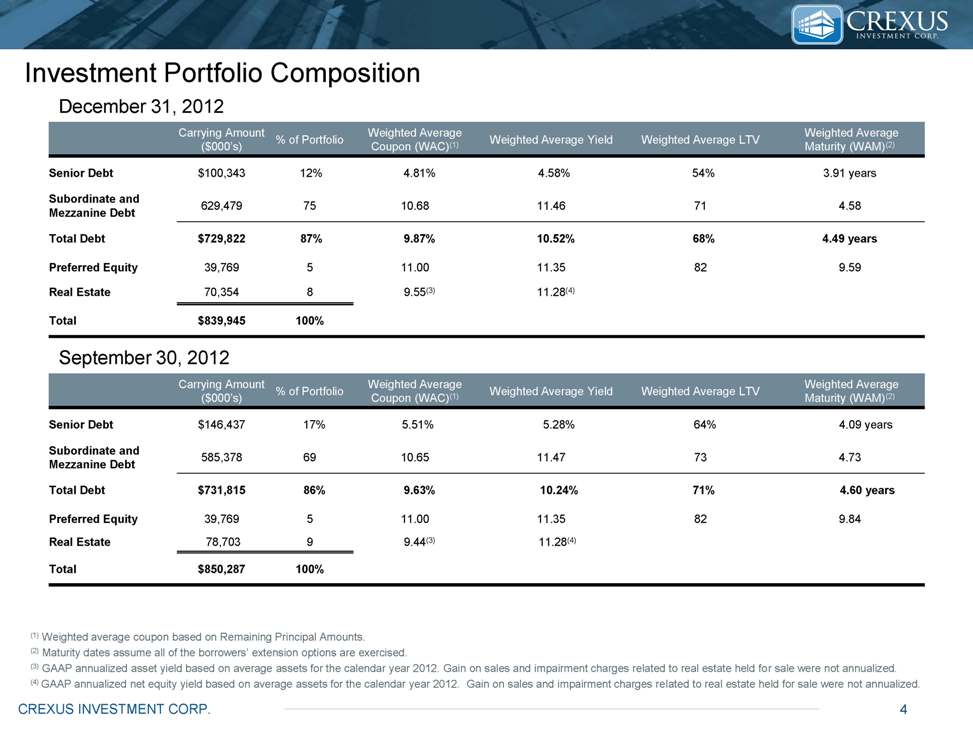
CREXUS INVESTMENT CORP. 4 Investment Portfolio Composition (1) Weighted average coupon based on Remaining Principal Amounts. (2) Maturity dates assume all of the borrowers’ extension options are exercised. (3) GAAP annualized asset yield based on average assets for the calendar year 2012. Gain on sales and impairment charges related to real estate held for sale were not annualized. (4) GAAP annualized net equity yield based on average assets for the calendar year 2012. Gain on sales and impairment charges related to real estate held for sale were not annualized. Carrying Amount ($000’s) % of Portfolio Weighted Average Coupon (WAC)(1) Weighted Average Yield Weighted Average LTV Weighted Average Maturity (WAM)(2) Senior Debt $100,343 12% 4.81% 4.58% 54% 3.91 years Subordinate and Mezzanine Debt 629,479 75 10.68 11.46 71 4.58 Total Debt $729,822 87% 9.87% 10.52% 68% 4.49 years Preferred Equity 39,769 5 11.00 11.35 82 9.59 Real Estate 70,354 8 9.55(3) 11.28(4) Total $839,945 100% December 31, 2012 September 30, 2012 Carrying Amount ($000’s) % of Portfolio Weighted Average Coupon (WAC)(1) Weighted Average Yield Weighted Average LTV Weighted Average Maturity (WAM)(2) Senior Debt $146,437 17% 5.51% 5.28% 64% 4.09 years Subordinate and Mezzanine Debt 585,378 69 10.65 11.47 73 4.73 Total Debt $731,815 86% 9.63% 10.24% 71% 4.60 years Preferred Equity 39,769 5 11.00 11.35 82 9.84 Real Estate 78,703 9 9.44(3) 11.28(4) Total $850,287 100%
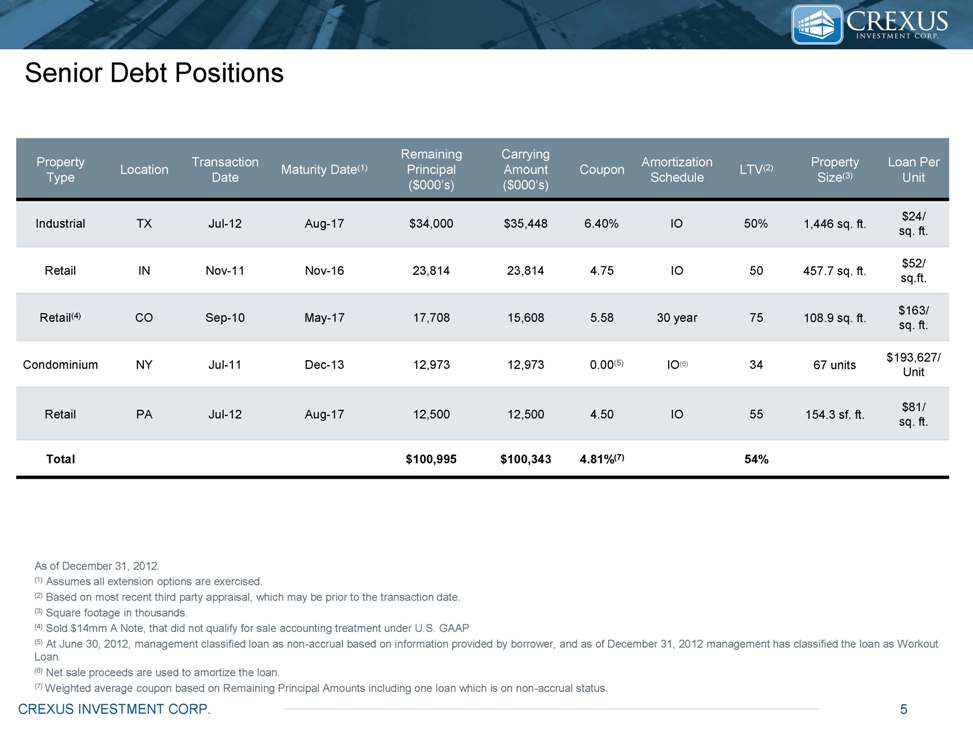
CREXUS INVESTMENT CORP. 5 Senior Debt Positions As of December 31, 2012. (1) Assumes all extension options are exercised. (2) Based on most recent third party appraisal, which may be prior to the transaction date. (3) Square footage in thousands. (4) Sold $14mm A Note, that did not qualify for sale accounting treatment under U.S. GAAP (5) At June 30, 2012, management classified loan as non-accrual based on information provided by borrower, and as of December 31, 2012 management has classified the loan as Workout Loan. (6) Net sale proceeds are used to amortize the loan. (7) Weighted average coupon based on Remaining Principal Amounts including one loan which is on non-accrual status. Property Type Location Transaction Date Maturity Date(1) Remaining Principal ($000’s) Carrying Amount ($000’s) Coupon Amortization Schedule LTV(2) Property Size(3) Loan Per Unit Industrial TX Jul-12 Aug-17 $34,000 $35,448 6.40% IO 50% 1,446 sq. ft. $24/ sq. ft. Retail IN Nov-11 Nov-16 23,814 23,814 4.75 IO 50 457.7 sq. ft. $52/ sq.ft. Retail(4) CO Sep-10 May-17 17,708 15,608 5.58 30 year 75 108.9 sq. ft. $163/ sq. ft. Condominium NY Jul-11 Dec-13 12,973 12,973 0.00(5) IO(6) 34 67 units $193,627/ Unit Retail PA Jul-12 Aug-17 12,500 12,500 4.50 IO 55 154.3 sf. ft. $81/ sq. ft. Total $100,995 $100,343 4.81%(7) 54%
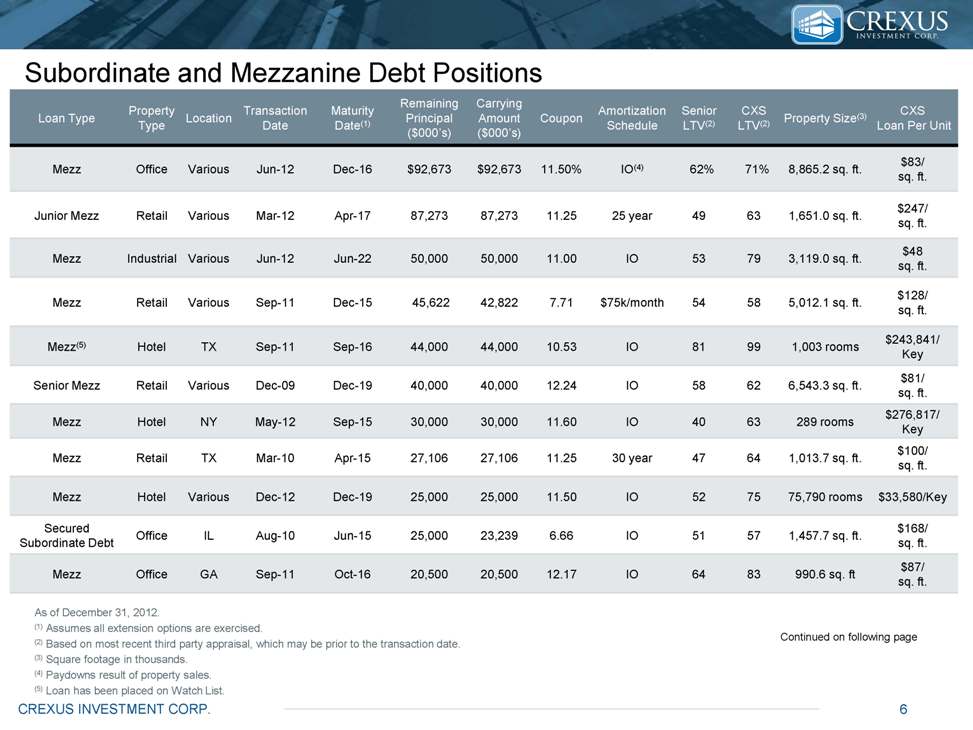
CREXUS INVESTMENT CORP. 6 Subordinate and Mezzanine Debt Positions As of December 31, 2012. (1) Assumes all extension options are exercised. (2) Based on most recent third party appraisal, which may be prior to the transaction date. (3) Square footage in thousands. (4) Paydowns result of property sales. (5) Loan has been placed on Watch List. Loan Type Property Type Location Transaction Date Maturity Date(1) Remaining Principal ($000’s) Carrying Amount ($000’s) Coupon Amortization Schedule Senior LTV(2) CXS LTV(2) Property Size(3) CXS Loan Per Mezz Office Various Jun-12 Dec-16 $92,673 $92,673 11.50% IO(4) 62% 71% 8,865.2 sq. ft. $83/ sq. ft. Junior Mezz Retail Various Mar-12 Apr-17 87,273 87,273 11.25 25 year 49 63 1,651.0 sq. ft. $247/ sq. ft. Mezz Industrial Various Jun-12 Jun-22 50,000 50,000 11.00 IO 53 79 3,119.0 sq. ft. $48 sq. ft. Mezz Retail Various Sep-11 Dec-15 45,622 42,822 7.71 $75k/month 54 58 5,012.1 sq. ft. $128/ sq. ft. Mezz(5) Hotel TX Sep-11 Sep-16 44,000 44,000 10.53 IO 81 99 1,003 rooms $243,841/ Key Senior Mezz Retail Various Dec-09 Dec-19 40,000 40,000 12.24 IO 58 62 6,543.3 sq. ft. $81/ sq. ft. Mezz Hotel NY May-12 Sep-15 30,000 30,000 11.60 IO 40 63 289 rooms $276,817/ Key Mezz Retail TX Mar-10 Apr-15 27,106 27,106 11.25 30 year 47 64 1,013.7 sq. ft. $100/ sq. ft. Mezz Hotel Various Dec-12 Dec-19 25,000 25,000 11.50 IO 52 75 75,790 rooms $33,580/Key Secured Subordinate Debt Office IL Aug-10 Jun-15 25,000 23,239 6.66 IO 51 57 1,457.7 sq. ft. $168/ sq. ft. Mezz Office GA Sep-11 Oct-16 20,500 20,500 12.17 IO 64 83 990.6 sq. ft $87/ sq. ft. Continued on following page
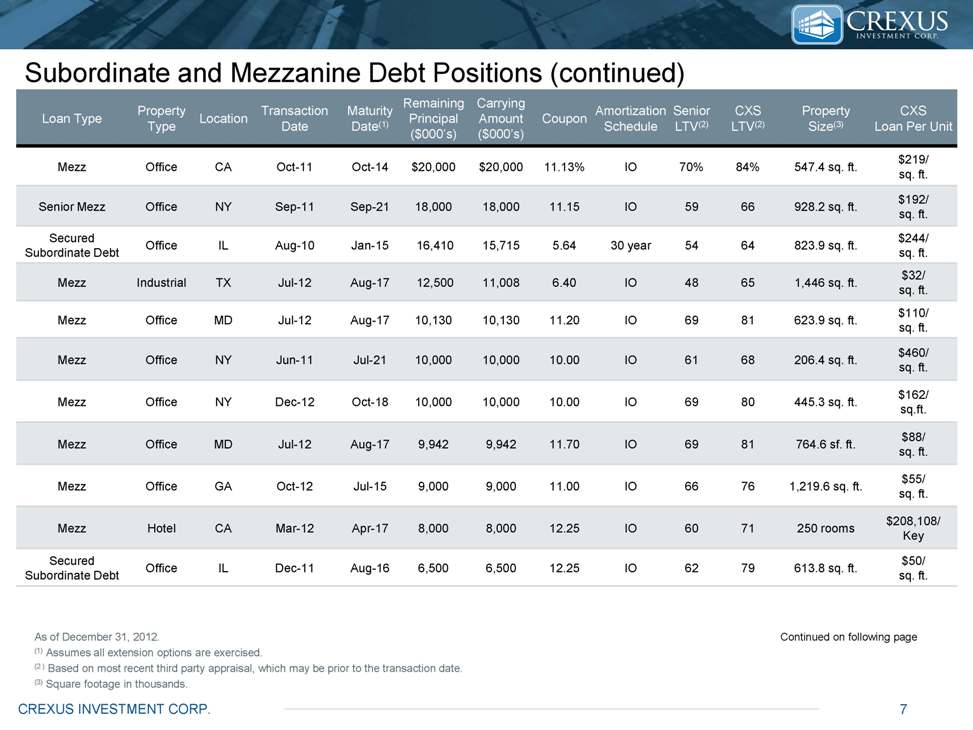
CREXUS INVESTMENT CORP. 7 Subordinate and Mezzanine Debt Positions (continued) As of December 31, 2012. (1) Assumes all extension options are exercised. (2 ) Based on most recent third party appraisal, which may be prior to the transaction date. (3) Square footage in thousands. Loan Type Property Type Location Transaction Date Maturity Date(1) Remaining Principal ($000’s) Carrying Amount ($000’s) Coupon Amortization Schedule Senior LTV(2) CXS LTV(2) Property Size(3) CXS Loan Per Unit Mezz Office CA Oct-11 Oct-14 $20,000 $20,000 11.13% IO 70% 84% 547.4 sq. ft. $219/ sq. ft. Senior Mezz Office NY Sep-11 Sep-21 18,000 18,000 11.15 IO 59 66 928.2 sq. ft. $192/ sq. ft. Secured Subordinate Debt Office IL Aug-10 Jan-15 16,410 15,715 5.64 30 year 54 64 823.9 sq. ft. $244/ sq. ft. Mezz Industrial TX Jul-12 Aug-17 12,500 11,008 6.40 IO 48 65 1,446 sq. ft. $32/ sq. ft. Mezz Office MD Jul-12 Aug-17 10,130 10,130 11.20 IO 69 81 623.9 sq. ft. $110/ sq. ft. Mezz Office NY Jun-11 Jul-21 10,000 10,000 10.00 IO 61 68 206.4 sq. ft. $460/ sq. ft. Mezz Office NY Dec-12 Oct-18 10,000 10,000 10.00 IO 69 80 445.3 sq. ft. $162/ sq.ft. Mezz Office MD Jul-12 Aug-17 9,942 9,942 11.70 IO 69 81 764.6 sf. ft. $88/ sq. ft. Mezz Office GA Oct-12 Jul-15 9,000 9,000 11.00 IO 66 76 1,219.6 sq. ft. $55/ sq. ft. Mezz Hotel CA Mar-12 Apr-17 8,000 8,000 12.25 IO 60 71 250 rooms $208,108/ Key Secured Subordinate Debt Office IL Dec-11 Aug-16 6,500 6,500 12.25 IO 62 79 613.8 sq. ft. $50/ sq. ft. Continued on following page
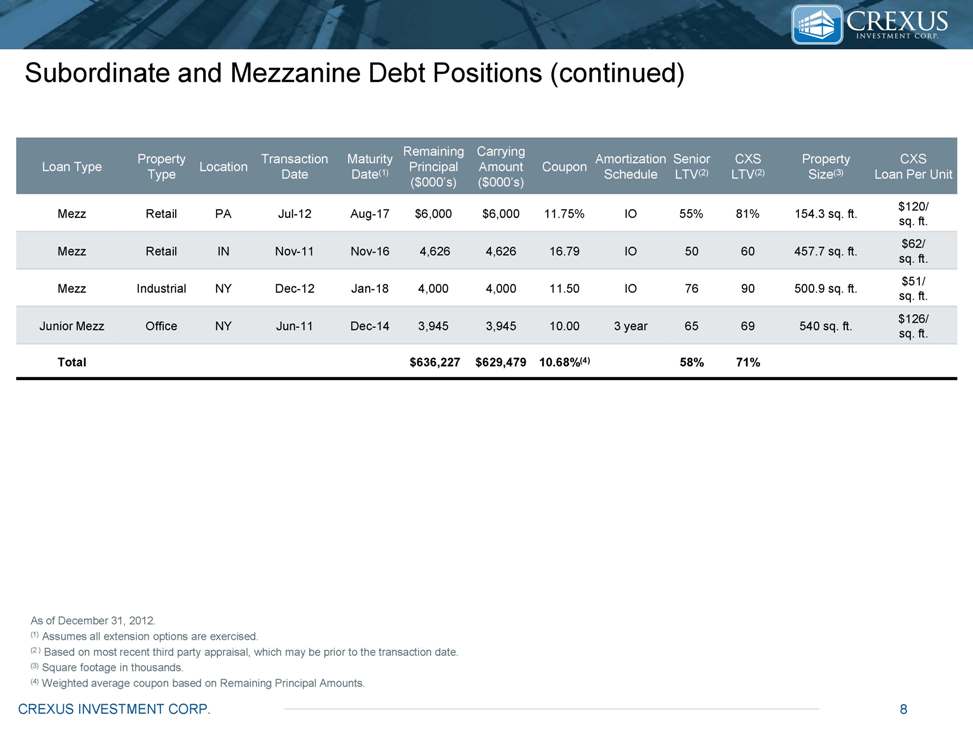
CREXUS INVESTMENT CORP. 8 Subordinate and Mezzanine Debt Positions (continued) As of December 31, 2012. (1) Assumes all extension options are exercised. (2 ) Based on most recent third party appraisal, which may be prior to the transaction date. (3) Square footage in thousands. (4) Weighted average coupon based on Remaining Principal Amounts. Loan Type Property Type Location Transaction Date Maturity Date(1) Remaining Principal ($000’s) Carrying Amount ($000’s) Coupon Amortization Schedule Senior LTV(2) CXS LTV(2) Property Size(3) CXS Loan Per Unit Mezz Retail PA Jul-12 Aug-17 $6,000 $6,000 11.75% IO 55% 81% 154.3 sq. ft. $120/ sq. ft. Mezz Retail IN Nov-11 Nov-16 4,626 4,626 16.79 IO 50 60 457.7 sq. ft. $62/ sq. ft. Mezz Industrial NY Dec-12 Jan-18 4,000 4,000 11.50 IO 76 90 500.9 sq. ft. $51/ sq. ft. Junior Mezz Office NY Jun-11 Dec-14 3,945 3,945 10.00 3 year 65 69 540 sq. ft. $126/ sq. ft. Total $636,227 $629,479 10.68%(4) 58% 71%
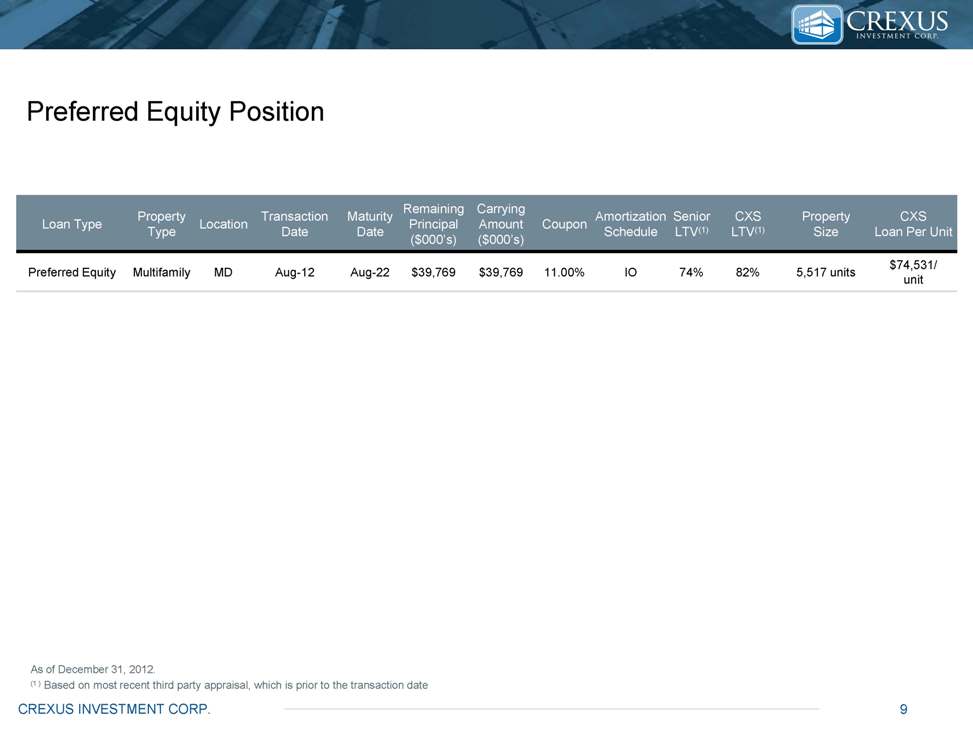
CREXUS INVESTMENT CORP. 9 As of December 31, 2012. (1 ) Based on most recent third party appraisal, which is prior to the transaction date Loan Type Property Type Location Transaction Date Maturity Date Remaining Principal ($000’s) Carrying Amount ($000’s) Coupon Amortization Schedule Senior LTV(1) CXS LTV(1) Property Size CXS Loan Per Unit Preferred Equity Multifamily MD Aug-12 Aug-22 $39,769 $39,769 11.00% IO 74% 82% 5,517 units $74,531/ unit Preferred Equity Position
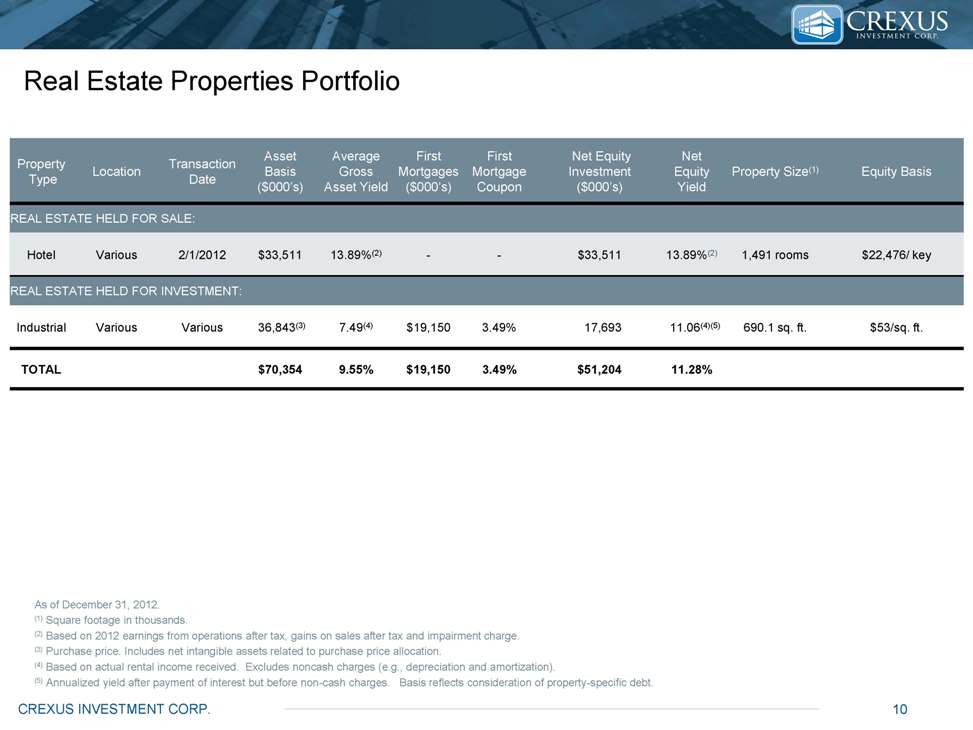
CREXUS INVESTMENT CORP. 10 Real Estate Properties Portfolio Property Type Location Transaction Date Asset Basis ($000’s) Average Gross Asset Yield First Mortgages ($000’s) First Mortgage Coupon Net Equity Investment ($000’s) Net Equity Yield Property Size(1) Equity Basis REAL ESTATE HELD FOR SALE: Hotel Various 2/1/2012 $33,511 13.89%(2) - - $33,511 13.89%(2) 1,491 rooms $22,476/ key REAL ESTATE HELD FOR INVESTMENT: Industrial Various Various 36,843(3) 7.49(4) $19,150 3.49% 17,693 11.06(4)(5) 690.1 sq. ft. $53/sq. ft. TOTAL $70,354 9.55% $19,150 3.49% $51,204 11.28% As of December 31, 2012. (1) Square footage in thousands. (2) Based on 2012 earnings from operations after tax, gains on sales after tax and impairment charge. (3) Purchase price. Includes net intangible assets related to purchase price allocation. (4) Based on actual rental income received. Excludes noncash charges (e.g., depreciation and amortization). (5) Annualized yield after payment of interest but before non-cash charges. Basis reflects consideration of property-specific debt.
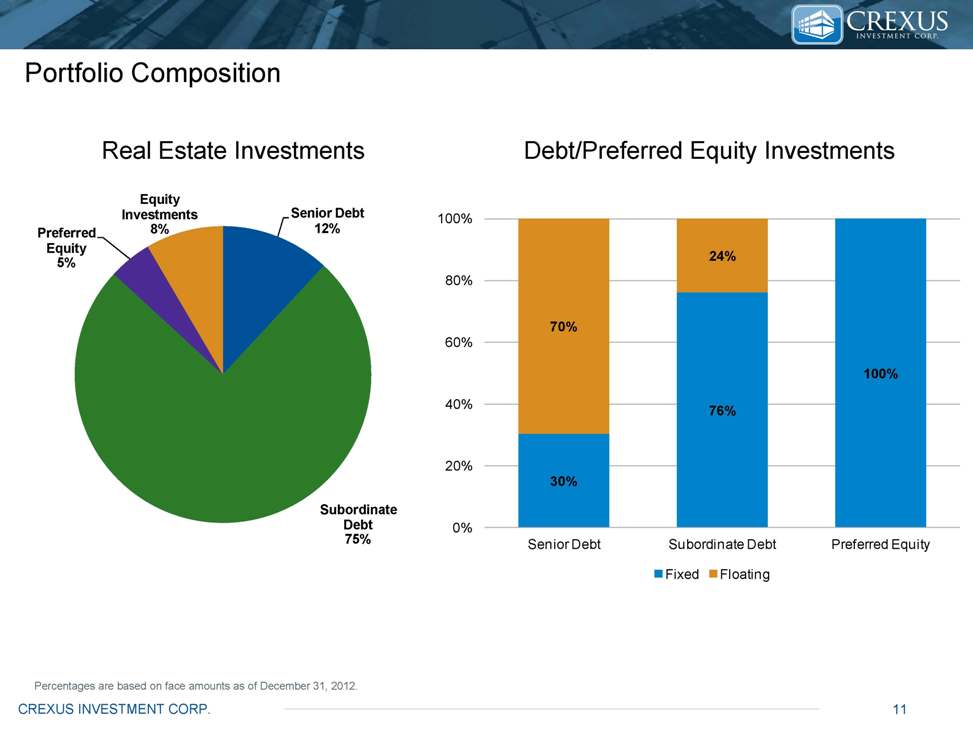
CREXUS INVESTMENT CORP. 11 30%76%100%70%24%0%20%40%60%80%100%Senior DebtSubordinate DebtPreferred EquityFixedFloatingPortfolio Composition Real Estate Investments Debt/Preferred Equity Investments Percentages are based on face amounts as of December 31, 2012. Senior Debt12%Subordinate Debt 75%Preferred Equity5%Equity Investments8%
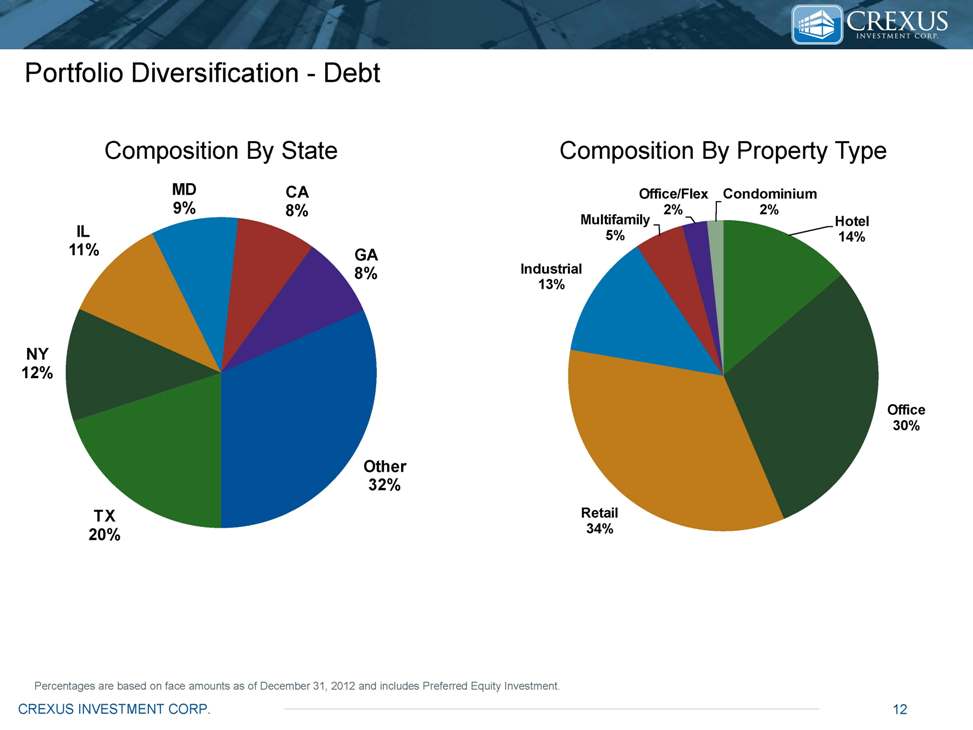
CREXUS INVESTMENT CORP. 12 Portfolio Diversification - Debt Percentages are based on face amounts as of December 31, 2012 and includes Preferred Equity Investment. Composition By State Composition By Property Type Hotel 14% Office 30% Retail 34% Industrial 13% Multifamily 5% Office/Flex 2% Condominium 2% TX 20% NY 12% IL 11% MD 9% CA 8% GA 8% Other 32%
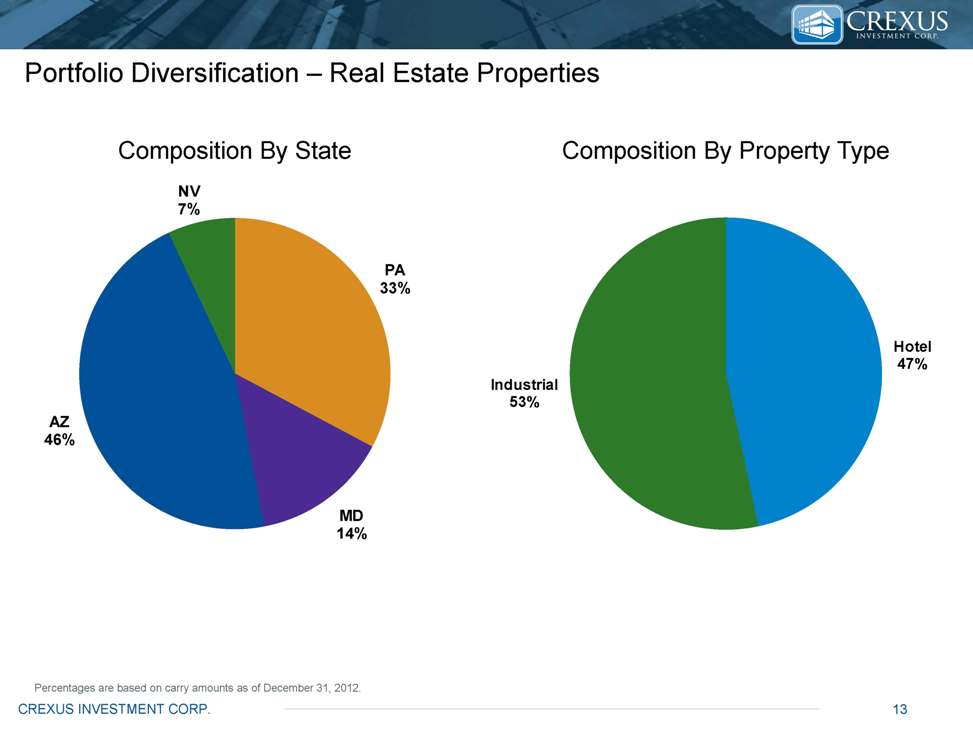
CREXUS INVESTMENT CORP. 13 Portfolio Diversification – Real Estate Properties Percentages are based on carry amounts as of December 31, 2012. Composition By State Composition By Property Type PA 33% MD 14% AZ 46% NV 7% Hotel 47% Industrial 53%
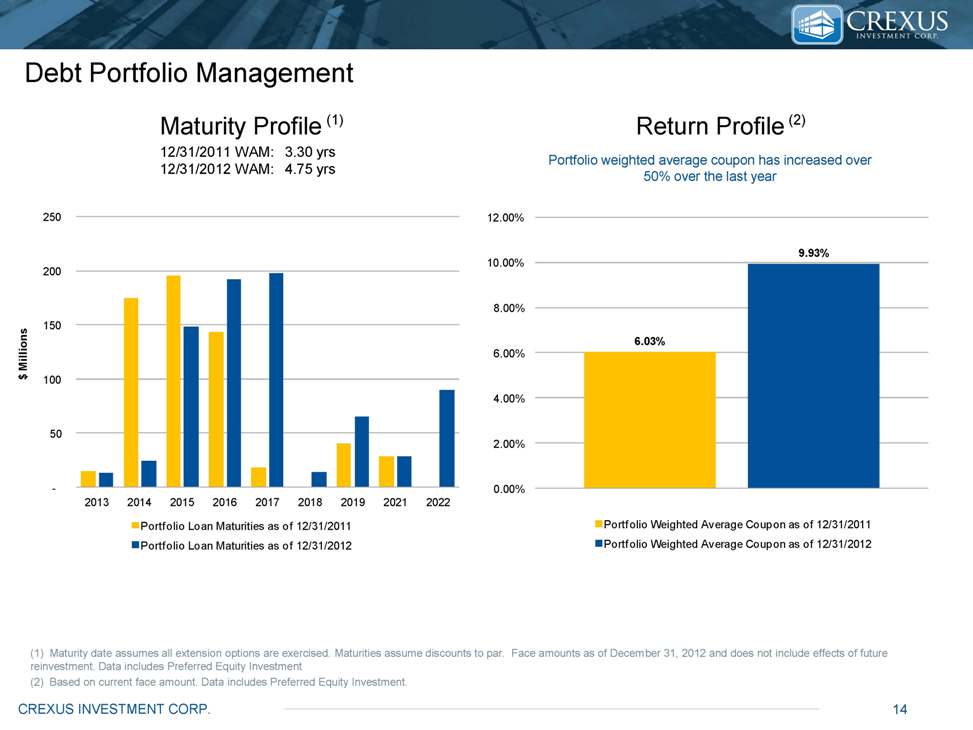
CREXUS INVESTMENT CORP. 14 6.03% 9.93% 0.00% 2.00% 4.00% 6.00% 8.00% 10.00% 12.00% Portfolio Weighted Average Coupon as of 12/31/2011Portfolio Weighted Average Coupon as of 12/31/2012-50 100 150 200 250 Loan Maturities as of 12/31/2011Portfolio Loan Maturities as of 12/31/2012Debt Portfolio Management Maturity Profile 12/31/2011 WAM: 3.30 yrs 12/31/2012 WAM: 4.75 yrs Portfolio weighted average coupon has increased over 50% over the last year Return Profile (1) Maturity date assumes all extension options are exercised. Maturities assume discounts to par. Face amounts as of December 31, 2012 and does not include effects of future reinvestment. Data includes Preferred Equity Investment (2) Based on current face amount. Data includes Preferred Equity Investment. (1) (2)
WWW.ANNALY.COM CREXUSINVESTMENT.COM Financial Statements
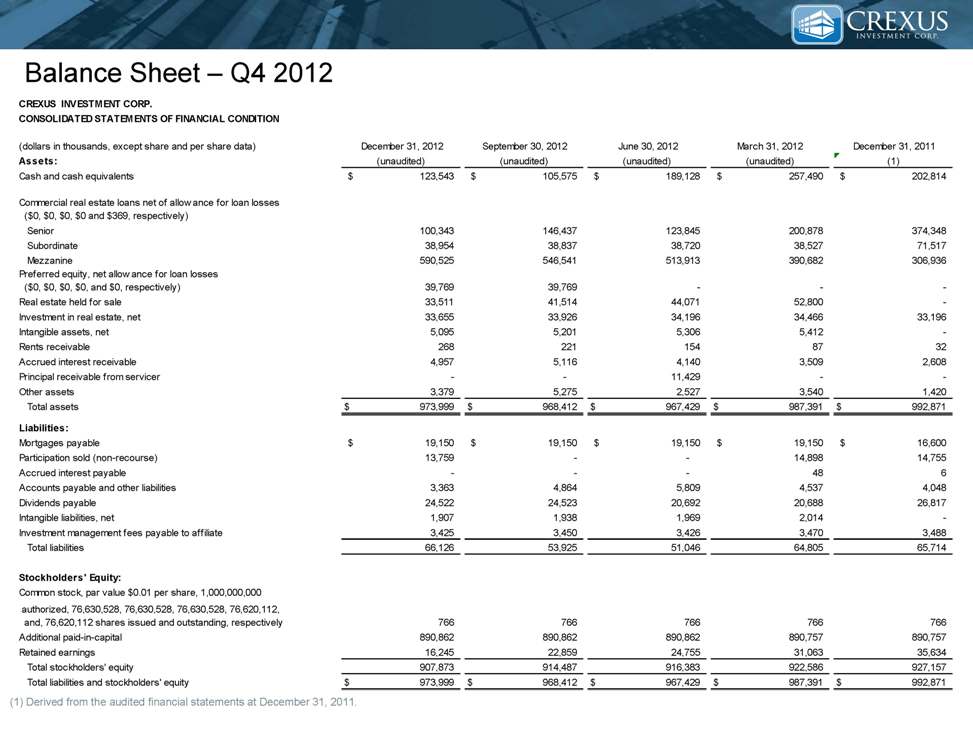
Balance Sheet – Q4 2012 Derived from the audited financial statements at December 31, 2011. CREXUS INVESTMENT CORP.CONSOLIDATED STATEMENTS OF FINANCIAL CONDITION(dollars in thousands, except share and per share data) December 31, 2012 September 30, 2012 June 30, 2012 March 31, 2012 December 31, 2011 Assets:(unaudited)(unaudited)(unaudited)(unaudited)(1)Cash and cash equivalents123,543$ 105,575$ 189,128$ 257,490$ 202,814$ Commercial real estate loans net of allowance for loan losses ($0, $0, $0, $0 and $369, respectively) Senior100,343 146,437 123,845 200,878 374,348 Subordinate38,954 38,837 38,720 38,527 71,517 Mezzanine590,525 546,541 513,913 390,682 306,936 Preferred equity, net allowance for loan losses ($0, $0, $0, $0, and $0, respectively)39,769 39,769 - - - Real estate held for sale33,511 41,514 44,071 52,800 - Investment in real estate, net33,655 33,926 34,196 34,466 33,196 Intangible assets, net5,095 5,201 5,306 5,412 - Rents receivable268 221 154 87 32 Accrued interest receivable4,957 5,116 4,140 3,509 2,608 Principal receivable from servicer- - 11,429 - - Other assets3,379 5,275 2,527 3,540 1,420 Total assets973,999$ 968,412$ 967,429$ 987,391$ 992,871$ Liabilities:Mortgages payable19,150$ 19,150$ 19,150$ 19,150$ 16,600$ Participation sold (non-recourse)13,759 - - 14,898 14,755 Accrued interest payable- - - 48 6 Accounts payable and other liabilities3,363 4,864 5,809 4,537 4,048 Dividends payable24,522 24,523 20,692 20,688 26,817 Intangible liabilities, net1,907 1,938 1,969 2,014 - Investment management fees payable to affiliate3,425 3,450 3,426 3,470 3,488 Total liabilities66,126 53,925 51,046 64,805 65,714 Stockholders' Equity:Common stock, par value $0.01 per share, 1,000,000,000 authorized, 76,630,528, 76,630,528, 76,630,528, 76,620,112, and, 76,620,112 shares issued and outstanding, respectively766 766 766 766 766 Additional paid-in-capital890,862 890,862 890,862 890,757 890,757 Retained earnings 16,245 22,859 24,755 31,063 35,634 Total stockholders' equity907,873 914,487 916,383 922,586 927,157 Total liabilities and stockholders' equity973,999$ 968,412$ 967,429$ 987,391$ 992,871$
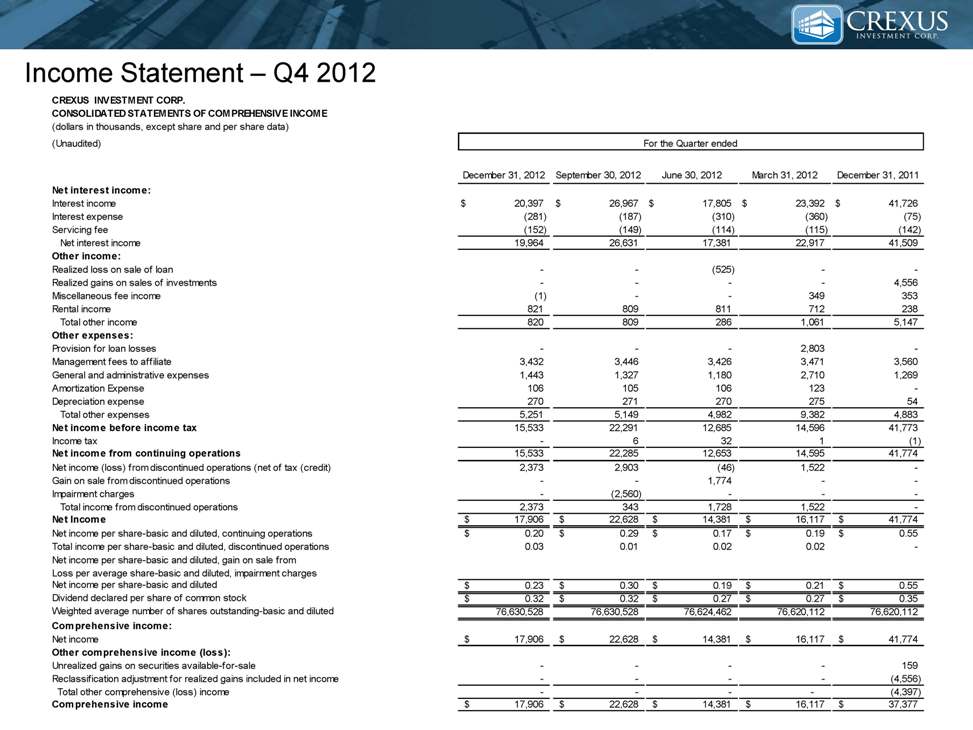
Income Statement – Q4 2012 CREXUS INVESTMENT CORP.CONSOLIDATED STATEMENTS OF COMPREHENSIVE INCOME(dollars in thousands, except share and per share data)(Unaudited)December 31, 2012September 30, 2012June 30, 2012March 31, 2012December 31, 2011Net interest income:Interest income20,397$ 26,967$ 17,805$ 23,392$ 41,726$ Interest expense(281)(187)(310)(360)(75)Servicing fee(152)(149)(114)(115)(142) Net interest income19,96426,63117,38122,91741,509Other income:Realized loss on sale of loan- - (525)- - Realized gains on sales of investments- - - - 4,556Miscellaneous fee income(1)- - 349353Rental income821809811712238 Total other income8208092861,0615,147Other expenses:Provision for loan losses- - - 2,803- Management fees to affiliate3,4323,4463,4263,4713,560General and administrative expenses1,4431,3271,1802,7101,269Amortization Expense106105106123- Depreciation expense27027127027554 Total other expenses5,2515,1494,9829,3824,883Net income before income tax 15,533 22,291 12,685 14,596 41,773 Income tax- 6321(1)Net income from continuing operations15,53322,28512,65314,59541,774Net income (loss) from discontinued operations (net of tax (credit) 2,3732,903(46)1,522- Gain on sale from discontinued operations- - 1,774- - Impairment charges- (2,560)- - - Total income from discontinued operations2,3733431,7281,522- Net Income17,906$ 22,628$ 14,381$ 16,117$ 41,774$ Net income per share-basic and diluted, continuing operations0.20$ 0.29$ 0.17$ 0.19$ 0.55$ Total income per share-basic and diluted, discontinued operations0.030.010.020.02- Net income per share-basic and diluted, gain on sale from Loss per average share-basic and diluted, impairment chargesNet income per share-basic and diluted0.23$ 0.30$ 0.19$ 0.21$ 0.55$ Dividend declared per share of common stock0.32$ 0.32$ 0.27$ 0.27$ 0.35$ Weighted average number of shares outstanding-basic and diluted76,630,528 76,630,528 76,624,462 76,620,112 76,620,112 Comprehensive income:Net income 17,906$ 22,628$ 14,381$ 16,117$ 41,774$ Other comprehensive income (loss):Unrealized gains on securities available-for-sale- - - - 159Reclassification adjustment for realized gains included in net income- - - - (4,556) Total other comprehensive (loss) income- - - - (4,397) Comprehensive income 17,906$ 22,628$ 14,381$ 16,117$ 37,377$ For the Quarter ended