Attached files
| file | filename |
|---|---|
| 8-K - FORM 8-K - TMS International Corp. | d486830d8k.htm |
| EX-99.1 - EX-99.1 - TMS International Corp. | d486830dex991.htm |
 Fourth Quarter and Full Year 2012
Earnings Call and Webcast
February 14, 2013
Exhibit 99.2 |
 This
presentation includes forward-looking statements within the meaning of Section 27A of the Securities
Act
of
1933,
(the
“Exchange
Act”),
as
amended,
and
Section
21E
of
the
Securities
Exchange
Act
of
1934, as
amended, with respect to our financial condition, results of operations and
business and our expectations or beliefs concerning future events. Such
forward-looking statements include the discussions of our business
strategies, estimates of future global steel production, trends toward outsourcing
and other market metrics and our expectations concerning future operations,
margins, profitability, liquidity and capital resources, among others.
Although we believe that such forward-looking statements are reasonable, there can be no assurance
that any forward-looking statements will prove to be correct. Such
forward-looking statements involve known and unknown risks,
uncertainties and other factors that may cause our actual results, performance or
achievements
to
be
materially
different
from
any
future
results,
performance or achievements expressed or
implied by such forward-looking statements.
Certain areas of this presentation depict Revenue After Raw Materials Costs, EBITDA
and Discretionary Cash Flow, which are non-GAAP
financial measures. Revenue After Raw Materials Costs, EBITDA and
Discretionary Cash Flow are not and should not be considered alternatives to
revenues or net income or any other financial measure under U.S. GAAP. We
reconcile these measurements to GAAP in our quarterly and annual reports on
forms 10-Q and 10-K, filed with the S.E.C. pursuant to the Exchange Act. Our calculation of
Revenue
After
Raw
Materials
Costs,
EBITDA
and
Discretionary
Cash
Flow
may
differ
from
methods
used
by
other companies.
When
we
use
the
term
“North
America”
in
this
presentation,
we
are
referring
to
the
United
States
and
Canada;
when
we
use
the
term
“International,”
we
are
referring
to
countries
other
than
the
United
States and
Canada;
when
we
use
the
term
“Latin
America,”
we
are
referring
to
Mexico,
Central
America,
South
America
and the Caribbean, including Trinidad & Tobago.
Safe harbor provision
1 |
 REVENUE AFTER RAW MATERIALS COSTS ($MM)
ADJUSTED EBITDA ($MM)
Fourth quarter and full year 2012 results
REVENUE AFTER RAW MATERIALS COSTS ($MM)
ADJUSTED EBITDA ($MM)
2
2011
2012
$549.5
$606.7
$400
$450
$500
$550
$600
$650
$700
2011
2012
$134.0
$145.3
$60
$80
$100
$120
$140
$160
$180
$200
2011
2012
$137.9
$148.3
$80
$100
$120
$140
$160
$180
$200
2011
2012
$31.7
$35.0
$20
$25
$30
$35
$40
$45
$50
2011
2012 |
   Operating environment summary
2012
2011
TMS CUSTOMERS BY REGION
TMS CUSTOMERS BY REGION
3
70.3
70.8
66.7
78.9
67.1
70.4
63.8
84.0
0
20
40
60
80
100
TMS Global
North America
Europe
Latin America
73.5
73.4
72.1
81.8
73.2
75.2
71.1
82.5
0
20
40
60
80
100
TMS Global
North America
Europe
Latin America
75.7
74.8
0
20
40
60
80
100
U.S. Industry
74.4
71.7
0
20
40
60
80
100
U.S. Industry |
 2012
2013 YTD
# of MSG contract wins
17
3
Cross-sells
15
2
International
7
2
Growth capital commitment
$37MM
$50-55MM
Additional revenue backlog
$308MM
$266MM
New countries penetrated
South Africa
Poland
Malaysia
MSG operational highlights
4
Continued success winning contracts in targeted regions
|
 5
RMOG operational highlights
VOLUME BY CHANNEL
3.3
NORTH AMERICA
INTERNATIONAL
AGENCY
NON-AGENCY
VOLUME BY GEOGRAPHY
3.2
3.3
3.2
13.4
13.4
13.4
13.4
REVENUE AFTER RAW
MATERIALS COSTS ($MM)
10% revenue growth despite flat volumes
$0
$5
$10
$15
$20
$25
2011
2012
$16.2
$17.8
$67.2
$71.8
$0
$25
$50
$75
$100
2011
2012
8.5
8.4
4.9
5.0
0
4
8
12
16
2011
2012
2.0
2.0
1.3
1.2
0
1
2
3
4
2011
2012
2.8
2.8
0.5
0.4
0
1
2
3
4
2011
2012
11.0
11.6
2.4
1.8
0
4
8
12
16
2011
2012 |
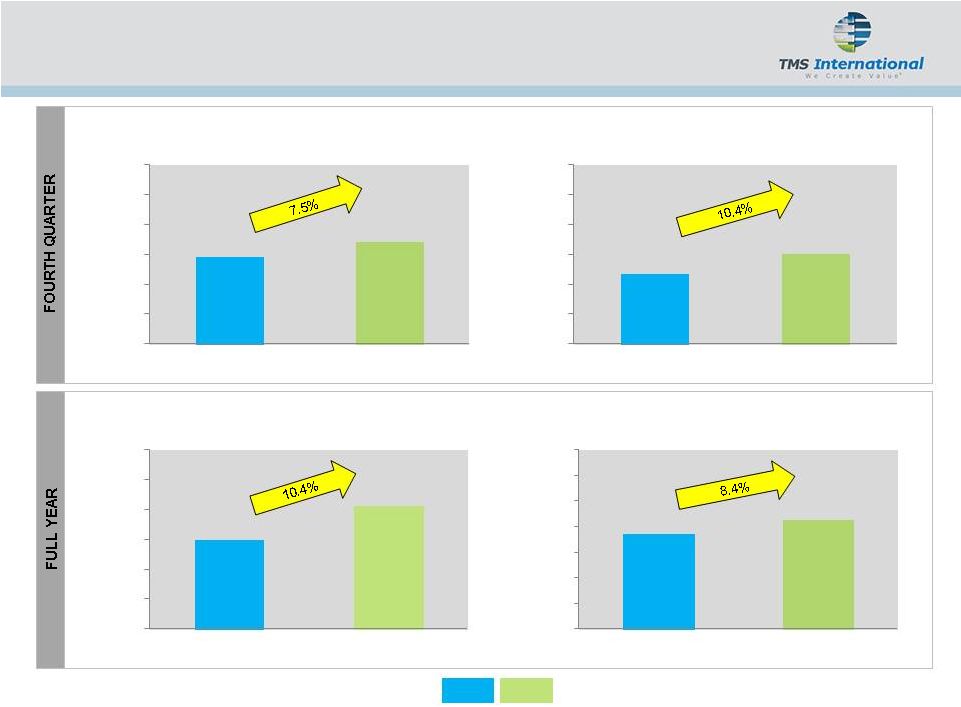
 Fourth Quarter
($MM)
Full Year
($MM)
2012
2011
%
Change
2012
2011
%
Change
Revenue after raw
materials costs
$148.3
$137.9
+7.5%
$606.7
$549.5
+10.4%
Adjusted EBITDA
$35.0
$31.7
+10.4%
$145.3
$134.0
+8.4%
Discretionary
cashflow
(1)
$20.6
$18.4
+12.0%
$102.6
$92.1
+11.3%
Growth capital
$11.6
$18.1
$68.1
$41.4
Leverage ratio
2.0x
2.1x
2.0x
2.1x
(1) Adjusted EBITDA less Maintenance Capital Expenditures.
Fourth quarter and full year financial highlights
6
Continued global expansion drives year-over-year growth
|
 Concluding remarks
7
Investment highlights
Market-leading global industrial services provider
Significant growth profile
Long-term contracted revenue and variable cost structure
Experienced and proven management team
Superior financial strength and liquidity
Strong cash flow generation drives earnings growth
Factors driving growth
Global steel production growing
Increased demand for outsourcing globally
Increased global market share
2013 Adjusted EBITDA guidance of $152 - $160 MM |
 |