Attached files
| file | filename |
|---|---|
| 8-K - FORM 8-K - MYERS INDUSTRIES INC | d485955d8k.htm |
| EX-99.1 - EX-99.1 - MYERS INDUSTRIES INC | d485955dex991.htm |
| EX-99.3 - EX-99.3 - MYERS INDUSTRIES INC | d485955dex993.htm |
 Earnings
Presentation Fourth Quarter & Full Year 2012
February 13, 2013
Exhibit 99.2 |
 Safe Harbor
Statement 2
Statements in this presentation concerning the Company’s goals, strategies, and
expectations for business and financial results may be "forward-looking
statements" within the meaning of the Private Securities Litigation
Reform
Act
of
1995
and
are
based
on
current
indicators
and
expectations.
Whenever
you
read
a
statement that is not simply a statement of historical fact (such as when we describe what
we "believe," "expect," or "anticipate" will occur, and
other similar statements), you must remember that our expectations may
not
be
correct,
even
though
we
believe
they
are
reasonable.
We
do
not
guarantee
that
the
transactions
and
events
described
will
happen
as
described
(or
that
they
will
happen
at
all). You
should
review
this
presentation with the understanding that actual future results may be materially different
from what we expect.
Many
of
the
factors
that
will
determine
these
results
are
beyond
our
ability
to
control
or
predict. You
are
cautioned
not
to
put
undue
reliance
on
any
forward-looking
statement.
We
do
not
intend,
and
undertake
no obligation, to update these forward-looking statements. These statements involve a
number of risks and uncertainties that could cause actual results to differ
materially from those expressed or implied in the applicable statements. Such risks
include: (1) Fluctuations in product demand and market acceptance
(2) Uncertainties associated with the general economic conditions in domestic and
international markets (3) Increased competition in our markets
(4) Changes in seasonality
(5)
Difficulties
in
manufacturing
operations,
such as
production
outages
or
maintenance
programs
(6) Raw material availability
(7)
Fluctuations
in
raw
material
costs;
fluctuations
outside
the
“normal”
range
of
industry
cycles
(8) Changes in laws and regulations and approvals and decisions of courts, regulators, and
governmental bodies
Myers Industries, Inc. encourages investors to learn more about these risk factors. A
detailed explanation of these factors is available in the Company’s publicly
filed quarterly and annual reports, which
can
be
found
online
at
www.myersind.com
and
at
the
SEC.gov
web
site. |
 Full Year 2012
Highlights •
Achieved 40% increase in adjusted EPS
•
$0.94 compared to $0.67 in 2011
•
Completed two strategic acquisitions which were accretive
•
Novel & Jamco
3
•
6% of total sales in 2012 came from products, services or markets
developed in the last three years.
•
Realized $16 million in Operations Excellence savings
•
3% of Cost of Goods sold
•
Increased capital spending by $5.1 million to $27 million
•
55% was for growth oriented projects
•
Returned cash to shareholders through dividend increase of 14% and
300k share buyback
•
As part of Innovation initiative more than 40 new products and services
were introduced (see next slide for examples) |
 4
New Products in 2012
Bin Clip
(Patented)
18”
Deep
Pick Rack
Extra-Duty Bulk
Box
Electronic Testing
Equipment for Truck
Fleets
Preset Gauge
Inflator
Water Based
Tread Cement
New Sizes Co-Ex
Pots & Trays
True Size
Nursery
Containers
360 Cell
Plug Tray
Slope-It
Bin Insert
Lean Panel -
Industry First
Tilt-View
The Grow Box
Decorative
Containers
Sloped
Louvered Panel |
 Full Year 2012
Financial Summary 5
•
Sales increased 4.7%
•
Strategic initiative centered on
Innovation
generated
6% of
total sales
•
Novel acquisition contributed
to sales increase in Material
Handling
•
Gross margin expanded to
27.2% from 26.2%
•
Operations Excellence
initiatives drove productivity
improvements and cost
savings
•
Adjusted EPS increased 40%
P&L
FY
FY
Highlights
2012
2011
B/(W)
Net sales
$791.2
$755.7
4.7%
Gross
margin
27.2%
26.2%
3.9%
SG&A
$163.4
$159.9
-2.2%
Net
income -
adjusted*
$32.1
$23.4
37.2%
Effective
tax rate
36.7%
---
EPS -
adjusted*
$0.94
$0.67
40.3%
*See Reconciliation of Non-GAAP measures on slide 19
Note: All figures except ratios and percents are $Millions
|
 Full Year 2012
Financial Summary 6
Notes: All figures except ratios and percents are $Millions
Free
Cash
Flow
=
Cash
flow
from
Operations –
Capital
Expenditures
Twelve Months Ended
Twelve Months Ended
Cash
December 31,
December 31,
Highlights
2012
2011
Free Cash Flow
$33.8
$42.2
Capital
expenditures
$27.0
$21.9
Dividends
$13.0
$9.5
Balance Sheet
December 31,
December 31,
Highlights
2012
2011
Long-term debt
(less current
portion)
$92.8
$73.7
Debt
-
net
of
cash
$88.9
$67.2
Net Debt to
Total Capital
27.9%
24.6%
Debt-to-EBITDA
1.1
1.0 |
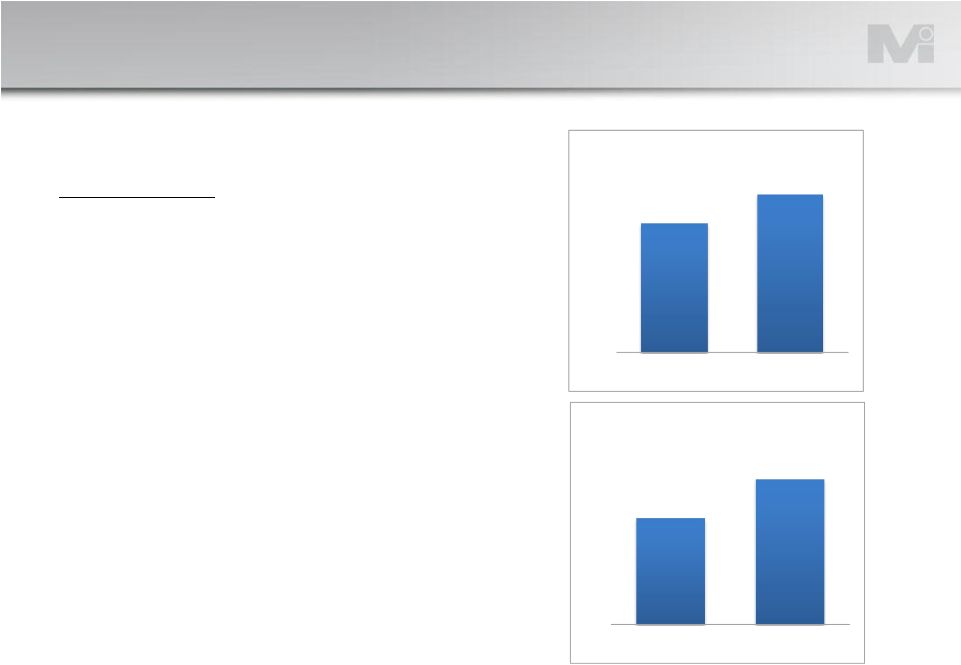
 FY Results
•
Sales increase of 9% due
mostly to Novel & Jamco
acquisitions and sales of
new products
•
Increased sales and
Operations Excellence
savings led to 39%
increase in adjusted EBIT
Segment
Review
–
Material
Handling
7
$ Millions
See Reconciliation of Non-GAAP measures on
slide 19
$261.8
$286.0
$240
$250
$260
$270
$280
$290
Full Year 2011
Full Year 2012
Net Sales
$34.1
$47.7
$10
$15
$20
$25
$30
$35
$40
$45
$50
Full Year 2011
Full Year 2012
EBIT -
Adjusted |
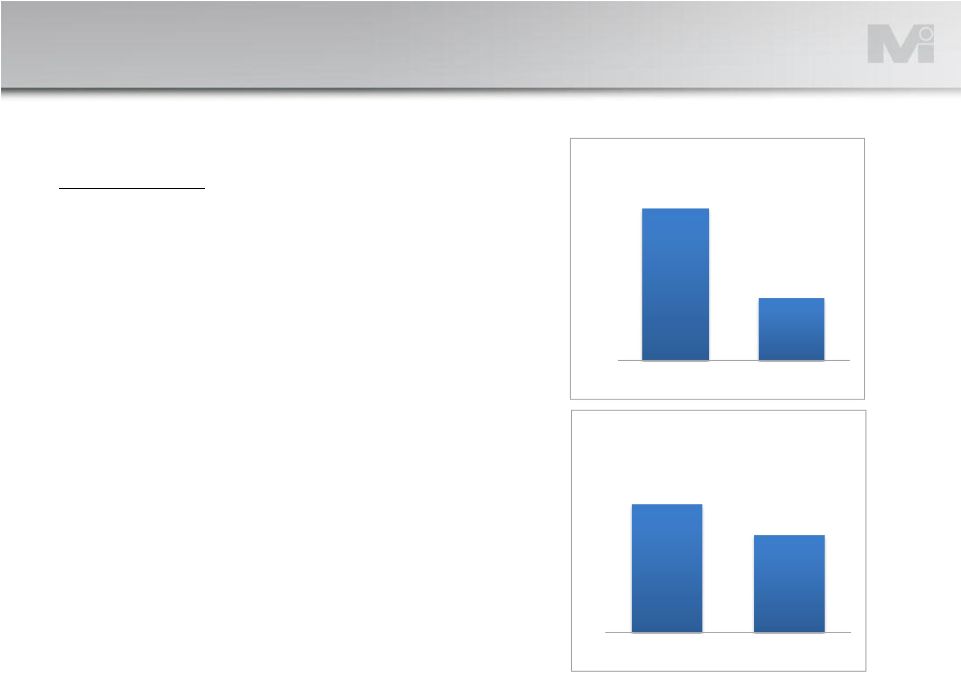 FY Results
•
Sales decline a result of:
•
Customers depleting
inventory and limiting
production during 2012
planting season
•
Delay in customer demand
from Q4 2012 to Q1 2013
•
Productivity and material
cost savings partially offset
income decline resulting
from lower sales
Segment
Review
–
Lawn
&
Garden
8
$ Millions
See Reconciliation of Non-GAAP measures on
slide 19
$217.1
$205.8
$198
$201
$204
$207
$210
$213
$216
$219
Full Year 2011
Full Year 2012
Net Sales
$4.6
$3.5
$0
$3
$6
Full Year 2011
Full Year 2012
EBIT -
Adjusted |
 FY Results
•
A decline in replacement
tire shipments combined
with lower equipment
sales led to decreased
sales
•
Lower sales led to
decrease in adjusted
EBIT
Segment
Review
–
Distribution
9
$ Millions
See Reconciliation of Non-GAAP measures on
slide 19
$183.7
$176.6
$170
$175
$180
$185
Full Year 2011
Full Year 2012
Net Sales
$17.0
$14.7
$12
$15
$18
Full Year 2011
Full Year 2012
EBIT -
Adjusted |
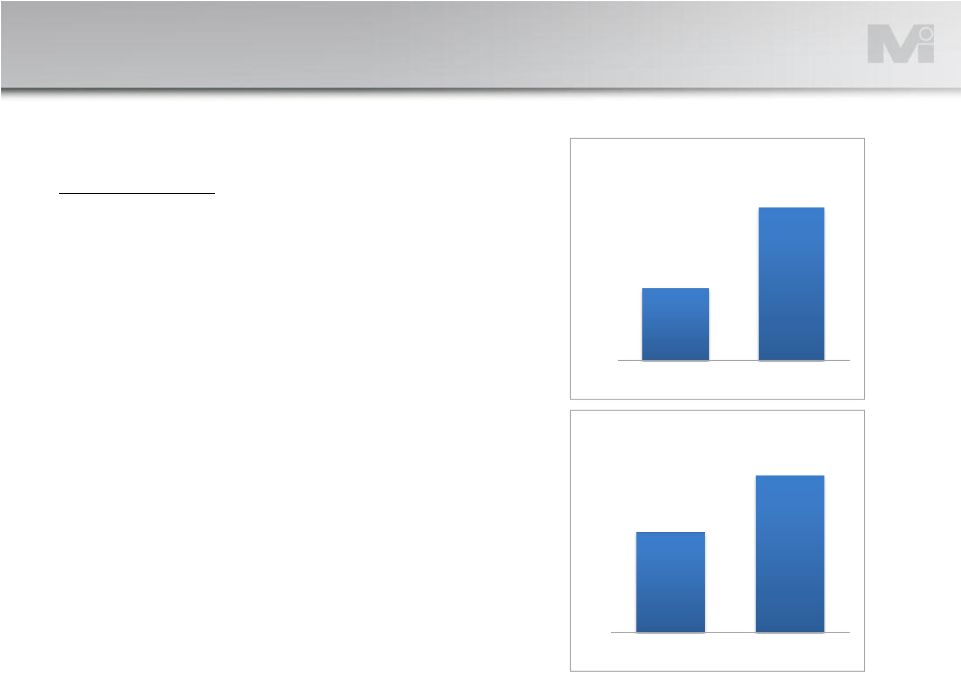
 FY
Results •
Strong sales in all end-
markets generated 22%
increase in sales
•
Higher sales led to the
increase in adjusted EBIT
of 36%
Segment
Review
–
Engineered
Products
10
$ Millions
See Reconciliation of Non-GAAP measures on
slide 19
$116.2
$141.7
$0
$15
$30
$45
$60
$75
$90
$105
$120
$135
$150
Full Year 2011
Full Year 2012
Net Sales
$11.5
$15.7
$0
$3
$6
$9
$12
$15
$18
Full Year 2011
Full Year 2012
EBIT -
Adjusted |
 Q4
2012
Financial
Highlights
11
•
Sales increased 11.1%
•
Very strong sales in
Material Handling more
than offset sales decreases
in the other three
segments
•
Gross margin decreased
from 27.0% to 26.7%
•
Change in sales mix across
the business segments led
to decline
•
Adjusted EPS increased
36.8%
Note:
All
figures
except
ratios
and
percents
are
$Millions
P&L
Q4
Q4
Highlights
2012
2011
B/(W)
Net sales
$214.0
$192.5
11.1%
Gross
margin
26.7%
27.0%
-0.8%
SG&A
$42.2
$41.8
-1.0%
Net
income -
adjusted*
$8.9
$6.4
39.1%
Effective
tax rate
38.2%
34.6%
EPS -
adjusted*
$0.26
$0.19
36.8%
*See Reconciliation of Non-GAAP measures on slide 19
|
 Q4
Results •
Delay in shipments from
earlier in the year to the
fourth quarter along with
sales from Novel & Jamco
acquisitions led to 48%
increase in sales
•
Higher sales combined with
productivity improvements
and lower manufacturing
costs resulted in 94%
increase in adjusted EBIT
Segment
Review
–
Material
Handling
12
$ Millions
See Reconciliation of Non-GAAP measures on
slide 19
$57.0
$84.4
$0
$10
$20
$30
$40
$50
$60
$70
$80
$90
Q4 2011
Q4 2012
Net Sales
$6.6
$12.8
$0
$3
$6
$9
$12
$15
Q4 2011
Q4 2012
EBIT -
Adjusted |
 Q4
Results •
Shift in customer demand
from Q4 2012 to Q1 2013
led to sales decrease
during the quarter
•
Income decline from lower
sales was more than offset
by productivity efficiencies
and material substitution
cost savings during the
quarter
Segment
Review
–
Lawn
&
Garden
13
$ Millions
See Reconciliation of Non-GAAP measures on
slide 19
$62.3
$58.8
$50
$53
$56
$59
$62
$65
Q4 2011
Q4 2012
Net Sales
$3.7
$3.8
$2
$3
$3
$4
$4
Q4 2011
Q4 2012
EBIT -
Adjusted |
 Q4
Results •
Continued and stronger
decline in replacement
tire shipments resulted
in sales decrease during
the quarter
•
Sales decrease led to the
decrease in adjusted
EBIT
Segment Review –
Distribution
14
$ Millions
See Reconciliation of Non-GAAP measures on
slide 19
$47.2
$44.7
$40
$45
$50
Q4 2011
Q4 2012
Net Sales
$4.7
$3.2
$0
$3
$6
Q4 2011
Q4 2012
EBIT -
Adjusted |
 Q4
Results •
Sales increases in RV and
marine were more than
offset by a decline in
sales of custom products
during the quarter
•
Sales decrease led to
decline in adjusted EBIT
Segment Review –
Engineered Products
15
$ Millions
See Reconciliation of Non-GAAP measures on
slide 19
$31.1
$30.1
$20
$25
$30
$35
Q4 2011
Q4 2012
Net Sales
$2.9
$2.4
$0
$5
Q4 2011
Q4 2012
EBIT -
Adjusted |
 Lawn &
Garden Update •
Announcing internal project to drive out costs,
increase productivity and improve profitability
•
Anticipated to yield annual savings of approximately $5
million by 2014
•
Addresses sub-segments of the business individually
•
Nursery –
various cost reduction efforts to improve
profitability
•
Greenhouse –
take actions to simplify, consolidate and
balance capacity with demand
16
•
Continue to look at further options including
external opportunities |
 Q1 & Full
Year 2013 Outlook Q1 Outlook
•
Material Handling
•
Seasonality in Brazil will unfavorably impact the quarter
•
Lawn & Garden
•
Solid order activity quarter-to-date on top of the delay in customer demand
from Q4 2012 to Q1 2013 should benefit the quarter
•
Distribution
•
Anticipate capturing greater shares of both equipment and supplies sales in a continued weak
marketplace
•
Engineered Products
•
Demand in transplant auto will be at normal levels during Q1 resulting in a decline in sales
in that market year-over-year
Full Year Outlook
•
Slow Q1 impacted by IT investments; but then good year-over-year improvement
•
Overall expect another year of good performance improvement
17 |
 Appendix
18 |
 MYERS INDUSTRIES, INC. RECONCILIATION OF NON-GAAP FINANCIAL MEASURES
INCOME (LOSS) BEFORE TAXES BY SEGMENT (UNAUDITED)
(Dollars in millions)
19
Reconciliation of Non-GAAP Measures
Quarter Ended
Twelve Months Ended
December 31
December 31
2012
2011
2012
2011
Material Handling
Income before taxes as reported
$
12.6
$
6.6
$
47.5
$
34.1
Restructuring expenses
0.2
0.0
0.2
0.0
Income before taxes as adjusted
12.8
6.6
47.7
34.1
Lawn & Garden
Income before taxes as reported
3.6
3.4
2.9
4.2
Restructuring expenses
0.2
0.3
0.6
0.4
Income before taxes as reported
3.8
3.7
3.5
4.6
Distribution
Income before taxes as reported
3.7
4.1
14.8
15.7
Restructuring expenses
0.0
0.9
0.7
2.0
Gain on building sale
(0.5)
(0.3)
(0.8)
(0.7)
Income before taxes as adjusted
3.2
4.7
14.7
17.0
Engineered Products
Income before taxes as reported
2.3
2.4
14.5
10.8
Restructuring expenses
0.1
0.5
1.2
0.7
Income before taxes as adjusted
2.4
2.9
15.7
11.5
Corporate and interest expense
Income (loss) before taxes as reported
(8.4)
(7.5)
(32.4)
(31.1)
Severance and other
0.3
0.0
1.8
0.3
Environmental
0.0
0.0
0.0
1.9
Income (loss) before taxes as adjusted
(8.1)
(7.5)
(30.6)
(28.9)
13.8
9.0
47.3
33.7
0.3
1.4
3.7
4.6
Income before taxes as adjusted
14.1
10.4
51.0
38.3
Income taxes
5.2
4.0
18.9
14.9
Net income as adjusted
$
8.9
$
6.4
$
32.1
$
23.4
Adjusted earnings per share
0.26
0.19
0.94
0.67
Consolidated
Income before taxes as reported
Restructuring expenses and other adjustments
Note:
Numbersin
the
Corporate
and
interest
expensesection
above
maybe
rounded
for
presentation
purposes.
Note
on
Reconciliation
of
Income
and
Earnings
Data:
Income
(loss)
excluding
the
items
mentioned
above
in
the
text
of
this
release
and
in
this
reconciliation
chartis
a
non-GAAP
financial
measure
that
Myers
Industries,
Inc.
calculates
according
to
theschedule
above,using
GAAP
amounts
from
the
unaudited
Consolidated
Financial
Statements.
The
Company
believes
that
the
excluded
items
arenot
primarily
related
to
core
operational
activities.
The
Company
believes
that
income
(loss)
excluding
items
that
are
not
primarily
related
to
core
operating
activities
these
items
as
well
as
other
financial
measures
in
connection
with
itsdecision-making
activities.
Income
(loss)
excluding
these
items
should
is
generally
viewed
as
providing
useful
information
regarding
a
company's
operating
profitability.
Management
uses
income
(loss)
excluding
not
be
considered
in
isolation
or
as
a
substitute
for
net
income
(loss),
income
(loss)
before
taxes
or
other
consolidated
income
data
prepared
in
accordance
with
GAAP.
The
Company‘s
method
for
calculating
income
(loss)
excluding
these
items
may
not
be
comparable
to
methods
used
by
other
companies. |
 Market
Indicators Material Handling
MHEM Index
Lawn & Garden
Housing Starts
Consumer Sentiment
Distribution
Miles Driven
Replacement Tire Shipments,
Gasoline Sales
Engineered Products
RVIA
Auto Market Forecasts
Source: Material Handling Industry Jan 2013
Forecast Source: National Association of
Home Builders (NAHB); Dec 2012 Thomson Reuters/University of Michigan
Source: JP Morgan, RMA, Energy Information
Administration Sources: RVIA Forecasts, Dec
2012; FRB G17 Release (Jan
2013); MAPI Forecast , Dec
2012 20 |
 |