Attached files
| file | filename |
|---|---|
| 8-K - FORM 8-K - WABASH NATIONAL Corp | v334776_8k.htm |

WABASH NATIONAL CORPORATION Investor Update February 2013 Dick Giromini, President & CEO Mark Weber, CFO

2 S AFE H ARBOR S TATEMENT This presentation will contain certain forward - looking statements, as defined by the Private Securities Litigation Reform Act of 1995 . These forward - looking statements are, however, subject to certain risks and uncertainties that could cause actual results to differ materially from those implied by the forward - looking statements . Without limitation, these risks and uncertainties include increased competition, dependence on new management, reliance on certain customers and corporate partnerships, shortages of raw materials, dependence on industry trends, access to capital, acceptance of new technology and products, and government regulation . Listeners should review and consider the various disclosures made by the Company in this presentation and in its reports to its stockholders and periodic reports on Forms 10 - K and 10 - Q . We cannot give assurance that the expectations reflected in our forward - looking statements will prove to be correct . Our actual results could differ materially from those anticipated in these forward - looking statements . All written and oral forward - looking statements attributable to us are expressly qualified in their entirety by the factors we disclose that could cause our actual results to differ materially from our expectations . © 2013 Wabash National, L.P. All rights reserved. Wabash®, Wabash National®, DuraPlate®, DuraPlate HD®, ArcticLite®, DuraPlate AeroS kir t®, TrustLock Plus®, RoadRailer®, and Beall® are marks owned by Wabash National, L.P. Transcraft®, Eagle® and Benson® are marks owned by Transcraft Corporation. Walker® T ran sport, Walker® Stainless Equipment, Walker® Defense Group, Walker® Barrier Systems, Walker® Engineered Products, Brenner® Tank, Garsite™, Progress Tank™, TST®, Bulk Tank International™, and Extract Technology® are marks owned by Walker Group Holdings LLC.

3 x Diversified manufacturer and industry leader in van and tank trailer production x Leading brands and longstanding relationships with blue - chip customer base x Acquisition of Walker Group accelerates diversification x Recent acquisition of Beall assets creates industry’s broadest tank trailer portfolio x Best - in - class, technologically innovative products x Trucking recovery and aging fleet equipment fuels trailer demand x Mature practitioner of lean manufacturing x Knowledgeable, experienced management and leadership team I NVESTMENT H IGHLIGHTS
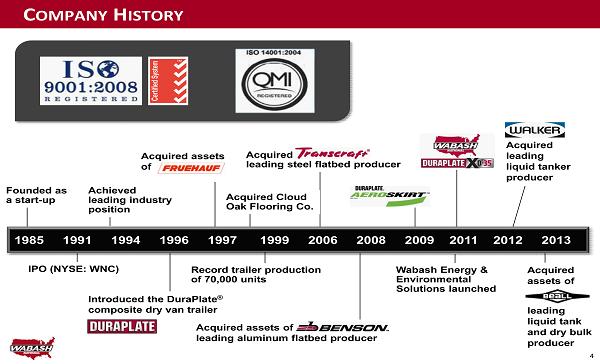
4 Acquired assets of leading liquid tank and dry bulk producer C OMPANY H ISTORY Acquired assets of leading aluminum flatbed producer Founded as a start - up IPO ( NYSE : WNC ) Achieved leading industry position 1985 1991 1994 1996 1997 1999 2006 2008 2009 2011 2012 2013 Introduced the DuraPlate ® composite dry van trailer Record trailer production of 70,000 units Wabash Energy & Environmental Solutions launched Acquired leading liquid tanker producer Acquired leading steel flatbed producer Acquired assets of Acquired Cloud Oak Flooring Co.
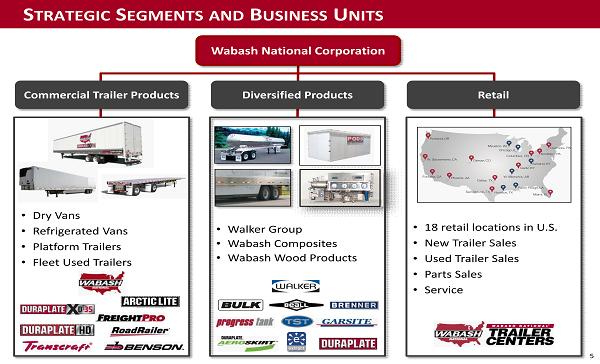
5 S TRATEGIC S EGMENTS AND B USINESS U NITS Commercial Trailer Products Wabash National Corporation Diversified Products Retail • Dry Vans • Refrigerated Vans • Platform Trailers • Fleet Used Trailers • Walker Group • Wabash Composites • Wabash Wood Products • 18 retail locations in U.S. • New Trailer Sales • Used Trailer Sales • Parts Sales • Service
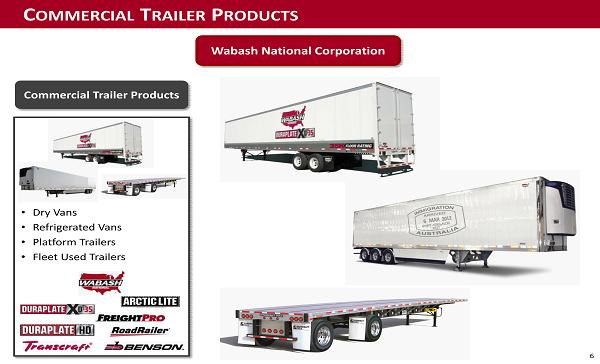
6 C OMMERCIAL T RAILER P RODUCTS Commercial Trailer Products Wabash National Corporation • Dry Vans • Refrigerated Vans • Platform Trailers • Fleet Used Trailers

7 C OMMERCIAL T RAILER P RODUCTS : K EY S TRENGTHS x #1 in van and platform trailer production for 18 of the past 25 years* x #1 in dry van semi - trailer production* x #3 in refrigerated van semi - trailer production* x Top 3 in platform semi - trailer production* x Blue - chip customer base x 60+ patents x “Voice of the customer” drives new technology development x Collaborative, consultative approach boosts customers’ bottom line x Committed to continuous improvement and lean manufacturing x 1 in 3 dry van trailers on the road made by Wabash National x More than 460,000 DuraPlate trailers on the road Industry Leadership Innovation Strong brand profile *Source : Trailer Body Builders Magazine, 2012

8 C OMMERCIAL T RAILER P RODUCTS : L ONG H ISTORY OF I NNOVATION Leading the way in transportation technologies that deliver value Sheet & Post Trailer • Commodity • Versatile • High maintenance FRP Trailer • FRP (Fiberglass Reinforced Plywood) • Added interior width • Difficult to repair 1985 Alum. Plate Trailer • WNC leading industry producer • Wide, smooth interior • Low maintenance • High material costs 1987 DuraPlate® Trailer • Durable • Longest useful life • Easy to repair • Lowest total cost of ownership • Recyclable 1996 DuraPlate® HD • High performance • Extremely durable • Heavy - duty freight applications 2004 DuraPlate® XD - 35 • The industry’s only 35,000 lb. dry van floor system • Specialty freight hauls: paper, steel coil 2011 Sheet & Post Trailer • Commodity • Versatile • High maintenance FRP Trailer • FRP (Fiberglass Reinforced Plywood) • Added interior width • Difficult to repair

9 C OMMERCIAL T RAILER P RODUCTS Dry Freight Vans: 82% / Total Refrigerated Vans: 11% / Total Platform Trailers: 5% / Total Specialty Equipment: 2% / Total Note: Percentages based on WNC shipments 2010 - 2012

10 C OMMERCIAL T RAILER P RODUCTS : C USTOMERS Wabash National Customers • 50% of Top 50 For - Hire Fleets • 40% of Top 100 For - Hire Fleets Preferred by the industry’s leading carriers Source: 2011 Transport Topics 100

11 Extensive sales and support network with 200+ locations Wabash National Trailer Centers retail network Platform Dealer Dry/Refrigerated Dealer C OMMERCIAL T RAILER P RODUCTS : D ISTRIBUTION

12 C OMMERCIAL T RAILER P RODUCTS Tonnage remains higher than pre - recession levels Source: ATA C OMMERCIAL T RAILER P RODUCTS : D EMAND -20% -15% -10% -5% 0% 5% 10% 15% 20% 90 95 100 105 110 115 120 125 130 2006 2007 2008 2009 2010 2011 2012 Truck Tonnage Index (ATA) TTI (Seas. Adjusted) Y/Y % Change

13 C OMMERCIAL T RAILER P RODUCTS T railer cycle could be one of the longest and strongest in history Source: ACT Research and FTR Associates. FTR numbers represent trailer production . ACT Forecast by Segment 2012 2013 2014 2015 2016 2017 Dry Van 129,543 141,750 150,000 140,000 125,000 140,000 Refrigerated 34,094 35,300 36,000 34,000 33,000 36,000 Platform 23,686 25,100 26,000 25,000 21,800 22,400 Liquid Tanks 7,833 8,650 7,500 6,800 5,800 6,200 Total Trailer Demand: Forecast 2012 2013 2014 2015 2016 2017 ACT (shipments) 240,015 254,500 265,000 245,200 222,100 244,500 FTR (production) 231,090 216,500 225,000 205,000 215,000 NA Industry Outlook

14 2013 O UTLOOK : I NDUSTRY F ORECAST Strong demand above replacement levels Short - /Mid - Term Demand Drivers Source: ACT Sources: 1974 - 1989:SMCC/TBB; 1989 - 2012: ACT • Age of equipment is at an all - time high of nearly 8.3 years • Equipment age profile: disproportionate number of aged units in fleets • 3+ years of significant under - buy (2008 - 2010) • CSA • Changes to HOS Rules (Hours of Service) 7 - day maximum driving time reduced from 82 to 70 hours DRY VANS: Population & Average Age 1979 - 2017 ACT Research Co., LLC: Copyright 2013 80 82 84 86 88 90 92 94 96 98 00 02 04 06 08 10 12 14 16 0 200 400 600 800 1000 1200 1400 1600 1800 2000 Population (000s) 5.5 6.0 6.5 7.0 7.5 8.0 8.5 9.0 9.5 10.0 10.5 Age (in Years) POPULATION AVERAGE AGE 0 50,000 100,000 150,000 200,000 250,000 300,000 350,000 1975 1980 1985 1990 1995 2000 2005 2010 Historical Industry Production

15 C OMMERCIAL T RAILER P RODUCTS Trucking boosts share of total tonnage to 70% by 2022 Source: ATA Freight Transportation Forecast to 2023 Overall Growth Trends • Total tonnage will increase an estimated 13.7B tons in 2011 to 16.6B tons in 2023 • Estimated Freight Increase ’12 - ’17 ’18 - ’23 General freight 3.6% 1.2% Bulk freight 2.6% 0.9% Trucking Trends • Truck share of total tonnage forecasted to exceed pre - recession level of ~69%. • Estimated Freight Increase ’12 - ’17 ’18 - ’23 Truckload (TL) 3.3% 1.1% Less - than - truckload (LTL) 3.5% 2.3% 67.0% 14.4% 1.3% 6.6% 6.6% 0.1% 2011 Truck Rail Carload Rail Intermodal Air Water Pipeline 69.6% 13.1% 1.9% 6.1% 6.1% 0.1% 2023 Truck Rail Carload Rail Intermodal Air Water Pipeline

16 D IVERSIFIED P RODUCTS Wabash National Corporation Diversified Products • Walker Group • Wabash Composites • Wabash Wood Products

17 D IVERSIFIED P RODUCTS : W ALKER G ROUP x #1 in Liquid Transportation Systems in North America x Complements Wabash National’s position as #1 van semi - trailer manufacturer in North America x Commonality of culture and history of innovation x Strong brand and premium products x Broadest tank trailer product line in the industry x Blue - chip and non - overlapping customer base x Attractive end markets – Chemicals, Dairy, Food & Beverage, Energy, Aviation, Pharmaceutical x Expands geographic footprint both domestically and in high growth international markets x Higher gross margin business, more stable revenue base/strong backlog x Ability to realize cost, operational and purchasing power synergies x Significant organic growth opportunities and geographic expansion Industry Leadership Diversification Attractive Financial Profile
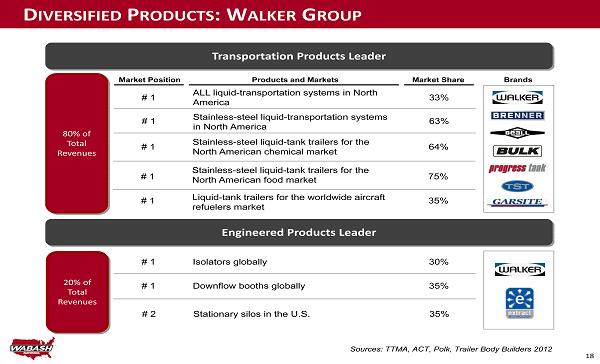
18 D IVERSIFIED P RODUCTS : W ALKER G ROUP Market Position Products and Markets Market Share Brands # 1 ALL liquid - transportation systems in North America 33% # 1 Stainless - steel liquid - transportation systems in North America 63% # 1 Stainless - steel liquid - tank trailers for the North American chemical market 64 % # 1 Stainless - steel liquid - tank trailers for the North American food market 75% # 1 Liquid - tank trailers for the worldwide aircraft refuelers market 35% # 1 Isolators globally 30% # 1 Downflow booths globally 35% # 2 Stationary silos in the U.S. 35% Transportation Products Leader Engineered Products Leader 80% of Total Revenues 20% of Total Revenues Sources: TTMA, ACT, Polk, Trailer Body Builders 2012

19 D IVERSIFIED P RODUCTS : W ALKER G ROUP Stainless - Steel Dairy Trailer Refined Petroleum Truck 7,000 Gallon Refueler Towable Hydrant Dispenser Liquid Tank Trailers Truck - Mounted Tanks Aviation Refuelers Carts and Hydrant Dispensers Stainless - Steel Vertical Silos WEP Processor Pharmair Containment Booth Vertical Silos and Horizontal Storage Tanks Processors and Mixers Downflow Booths and Containment Facilities Isolators Tray Dryer Isolator Transportation Products Engineered Products Truck - Hydrant Dispensers Defense Fuel Truck Aluminum Shale Oil Trailer 10,000 Gallon Refueler

20 D IVERSIFIED P RODUCTS : W ALKER G ROUP End - Markets Geographies Products and Services Blue - Chip Customer Base Oil, Gas & Energy Services Dairy, Food and Beverage Chemical Pharmaceuticals Aviation Defense Environmental Note: 1. All information based off of 2011 revenues US, 87% Australia, 0% Asia, 5% Africa, 0% Latin America, 2% Mexico & Canada, 2% Europe, 3% Parts and Services Revenue, 13% Manufacturing Revenue, 87% Chemical, 31% Dairy, Food & Beverage, 27% Aviation, 15% Energy, 12% Pharmaceutical, 9% Defense, 4% Environmental, 2%
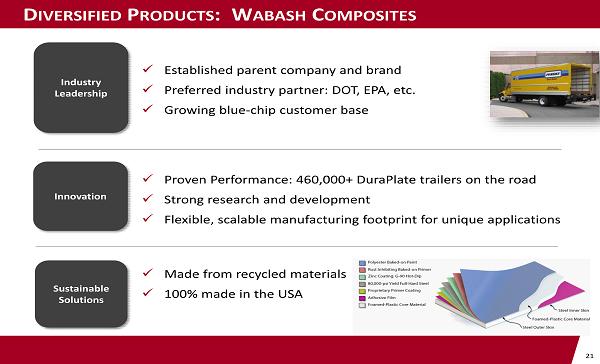
21 D IVERSIFIED P RODUCTS : W ABASH C OMPOSITES x Established parent company and brand x Preferred industry partner: DOT, EPA, etc. x Growing blue - chip customer base x Proven Performance: 460,000+ DuraPlate trailers on the road x Strong research and development x Flexible, scalable manufacturing footprint for unique applications x Made from recycled materials x 100% made in the USA Industry Leadership Innovation Sustainable Solutions

22 D IVERSIFIED P RODUCTS : W ABASH C OMPOSITES New product offerings constantly in evaluation and development DuraPlate® Composite Material • Pre - coated, galvanized steel skins • Foamed HDPE Core • Extremely strong • Light weight • Damage resistant • Multiple industrial applications Van Truck Bodies DuraPlate AeroSkirt® Portable Storage Cargo Trailers Swing & Overhead Doors Other Applications

23 D IVERSIFIED P RODUCTS : W ABASH C OMPOSITES Demand Drivers • Forecasted growth in Truck Body market drives DuraPlate® panel sales growth • CARB (California Air Resource Board) compliance requirements continue to drive DuraPlate® AeroSkirt® demand • Housing Starts support potential moving and storage growth and need for portable storage containers Source: U.S. Census Bureau Source: ACT

FINANCIALS

25 0 500 1,000 1,500 2007 2008 2009 2010 2011 2012 $1,103 $836 $338 $640 $1,187 $1,462 - 12% - 8% - 4% 0% 4% 8% 12% 2007 2008 2009 2010 2011 2012 8% 3% - 7% 4% 6% 11% Revenue ($ millions) Gross Margin Net Working Capital as % of Revenue (3) (1) 2008 operating income excludes a non - cash impairment charge for goodwill of $66.3 million (2) 2012 operating income excludes acquisition expenses of $14.4 million related to the acquisitions of Walker and certain assets of Beall (3) Net Working Capital as % of Revenue = 13 - month average Accounts Receivable, Inventory net of Accounts Payable divided by trailing 12 - month revenue - 80 - 60 - 40 - 20 0 20 40 60 80 100 2007 2008 2009 2010 2011 2012 $26.5 ($37.5) ($66.1) ($15.4) $19.8 $84.9 Operating Income (1 )(2) ($ millions) F INANCIAL H IGHLIGHTS 0% 5% 10% 15% 20% 2007 2008 2009 2010 2011 2012 15% 15% 17% 10% 10% 12%

26 $300 $400 $500 $600 $700 $800 $900 $1,000 $1,100 $1,200 $1,300 $1,400 $1,500 Q109 Q209 Q309 Q409 Q110 Q210 Q310 Q410 Q111 Q211 Q311 Q411 Q112 Q212 Q312 Q412 $1,462 ($60) ($40) ($20) $0 $20 $40 $60 $80 $100 $120 $140 Q109 Q209 Q309 Q409 Q110 Q210 Q310 Q410 Q111 Q211 Q311 Q411 Q112 Q212 Q312 Q412 $119 TTM Revenue ($ millions) TTM Operating EBITDA (1) ($ millions) (1) A reconciliation of Operating EBITDA to net income (loss) for the periods presented is included in the Appendix to this p res entation Diversification & Profitability Initiatives Footprint Optimization: • Consolidated Lafayette van manufacturing/warehousing • Consolidated all platform and dump trailer production Strategic Acquisitions: • Acquired higher margin Walker Group resulting in more consistent, stable earnings and cash flow • Beall asset purchase adds product line breadth and geographic expansion Margin Growth: • Leverage Duraplate technology outside of trailers • Focused margin expansion in core trailer business Q UARTERLY F INANCIAL H IGHLIGHTS

27 Capital Structure and Liquidity Strong Liquidity & Flexible Capital Structure 0 50 100 150 200 250 300 2013 2014 2015 2016 2017 2018 2019 ($ millions) Required Minimum Maturities (2)(3) Cost Effective Debt Structure • $150 Million ABL Revolving Facility – Sr. Secured, matures 5/2017, floating LIBOR pricing 1.75% - 2.25% • $150 Million Convertible Notes – Sr. Unsecured, matures 5/2018, semiannual interest payment of 3.375% • $300 Million Term Loan B – Sr. Secured, matures 5/2019, 1% annual amortization, all - in floating pricing ~ 6.25% $0 $25 $50 $75 $100 $125 $150 $175 $200 $225 $250 12/09 12/10 12/11 3/12 6/12 9/12 12/12 $21.0 $60.4 $125.7 $99.6 $151.2 $182.2 $224.3 ($ millions) Liquidity (1) Debt & Capital Lease Maturities (1) Liquidity, defined as cash on hand plus available borrowing capacity Cash Conversion Focus • Net working capital target of approximately 12% of revenue; generating significant free cash flows for potential debt reduction • Minimal debt repayment requirements for next 5 years; provides ability for term debt pre - payment • CapEx at <1% of revenue: $7.3M in 2011 and $14.9M in 2012 • Approx. $111M in NOLs at 12/31/12 $4 $4 $4 $4 $4 $154 $153 $280 (2) Excess cash flows, as defined in the TLB, may require additional mandatory pre - payment requirements; above maturities reflects only minimum obligations at 1% of principal (or ~$3M per year) (3) Schedule represents estimate of debt and capital lease maturities as of December 31, 2012 inclusive of new financing facilities
APPENDIX

29 C ONSOLIDATED I NCOME S TATEMENT ($ in thousands, except per share amounts) 2007 2008 2009 2010 2011 2012 Net sales 1,102,544$ 836,213$ 337,840$ 640,372$ 1,187,244$ 1,461,854$ Cost of sales 1,010,823 815,289 360,750 612,289 1,120,524 1,298,031 Gross profit 91,721$ 20,924$ (22,910)$ 28,083$ 66,720$ 163,823$ % of sales 8.3% 2.5% -6.8% 4.4% 5.6% 11.2% General and administrative expenses 46,557 41,139 29,033 29,876 30,994 44,751 % of sales 4.2% 4.9% 8.6% 4.7% 2.6% 3.1% Selling expenses 15,743 14,290 11,176 10,669 12,981 23,589 % of sales 1.4% 1.7% 3.3% 1.7% 1.1% 1.6% Amortization of intangibles 2,955 2,955 2,955 2,955 2,955 10,590 % of sales 0.3% 0.4% 0.9% 0.5% 0.2% 0.7% Other operating expenses - 66,317 - - - 14,409 % of sales 0.0% 7.9% 0.0% 0.0% 0.0% 1.0% - - - - - - Income (Loss) from operations 26,466$ (103,777)$ (66,074)$ (15,417)$ 19,790$ 70,484$ % of sales 2.4% -12.4% -19.6% -2.4% 1.7% 4.8% Other income (expense) Increase in fair value of warrant - - (33,447) (121,587) - - Interest expense (5,755) (4,657) (4,379) (4,140) (4,136) (21,724) Other, net 3,977 (328) (866) (667) (441) (97) Income (Loss) before income taxes 24,688$ (108,762)$ (104,766)$ (141,811)$ 15,213$ 48,663$ Income tax expense (benefit) 8,403 17,064 (3,001) (51) 171 (56,968) Net income (loss) 16,285$ (125,826)$ (101,765)$ (141,760)$ 15,042$ 105,631$ Preferred stock dividends and early extinguishment -$ -$ 3,320$ 25,454$ -$ -$ Net income (loss) applicable to common stockholders 16,285$ (125,826)$ (105,085)$ (167,214)$ 15,042$ 105,631$ Diluted net income (loss) per share 0.52$ (4.21)$ (3.48)$ (3.36)$ 0.22$ 1.53$

30 C ONSOLIDATED B ALANCE S HEET ($ in thousands) 2007 2008 2009 2010 2011 2012 ASSETS Current assets Cash and cash equivalents 41,224$ 29,766$ 1,108$ 21,200$ 19,976$ 81,449$ Accounts receivable 68,752 37,925 17,081 37,853 52,219 96,590 Inventories 113,125 92,896 51,801 110,850 189,533 189,487 Deferred income taxes 14,514 - - - - 42,330 Prepaid expenses and other 4,046 5,307 6,877 2,155 2,317 8,239 Total current assets 241,661$ 165,894$ 76,867$ 172,058$ 264,045$ 418,095$ Property, plant and equipment 122,063 122,035 108,802 98,834 96,591 132,146 Deferred income taxes 2,772 - - - - 21,894 Goodwill 66,317 - - - - 146,444 Intangible assets 32,498 29,089 25,952 22,863 19,821 171,990 Other assets 18,271 14,956 12,156 9,079 7,593 12,057 Total assets 483,582$ 331,974$ 223,777$ 302,834$ 388,050$ 902,626$ LIABILITIES & STOCKHOLDERS' EQUITY Current liabilities Current portion of long-term debt -$ 80,008$ -$ -$ -$ 3,381$ Current portion of capital lease obligations - 337 337 590 4,007 1,140 Accounts payable 40,787 42,798 30,201 71,145 107,985 87,299 Other accrued liabilities 54,258 45,449 34,583 38,896 59,024 104,873 Warrant - - 46,673 - - - Total current liabilities 95,045$ 168,592$ 111,794$ 110,631$ 171,016$ 196,693$ Long-term debt 104,500 - 28,437 55,000 65,000 416,849 Capital lease obligations - 4,803 4,469 3,964 814 3,781 Other noncurrent liabilities and contingencies 4,108 5,142 3,258 4,214 4,874 15,511 Deferrred income taxes - - - - - 1,065 Preferred stock - - 22,334 - - - Stockholders' equity 279,929 153,437 53,485 129,025 146,346 268,727 Total Liabilities and stockholders' equity 483,582$ 331,974$ 223,777$ 302,834$ 388,050$ 902,626$

31 C ONSOLIDATED C ASH F LOWS ($ in thousands) 2007 2008 2009 2010 2011 2012 Cash flows from operating activities Net income (loss) 16,285$ (125,826)$ (101,765)$ (141,760)$ 15,042$ 105,631$ Adjustments to reconcile net income (loss) to net cash provided by (used in) operating activities Depreciation 16,512 18,512 16,630 13,900 12,636 14,975 Amortization of intangibles 2,955 2,955 2,955 2,955 2,955 10,590 Net loss (gain) on the sale of assets 116 606 (55) 431 (9) 203 Foreign exchange gain on disposition of Canadian subsidiary (3,322) - - - - - (Gain) Loss on debt extinguishment (546) (151) 303 - 668 - Deferred income taxes 8,182 17,286 - - - (55,292) Excess tax benefits from stock-based compensation (33) (6) - - - - Increase in fair value of warrant - - 33,447 121,587 - - Stock-based compensation 4,358 4,990 3,382 3,489 3,398 5,149 Accretion of debt discount - - - - - 2,972 Impairment of goodwill - 66,317 - - - - Changes in operating assets and liabilities Accounts receivable 41,717 30,827 20,845 (20,772) (14,366) 1,180 Inventories 19,958 20,229 41,095 (59,062) (78,683) 41,696 Prepaid expenses and other 6 436 (1,570) 3,024 (162) 736 Accounts payable and accrued liabilities (48,487) (5,657) (22,666) 45,251 56,968 (48,777) Other, net 3,159 291 420 650 386 (3,046) Net cash provided by (used in) operating activities 60,860$ 30,809$ (6,979)$ (30,307)$ (1,167)$ 76,017$ Cash flows from investing activities Capital expenditures (6,714) (12,613) (981) (1,782) (7,264) (14,916) Acquisition, net of cash acquired (4,500) - - - - (364,012) Proceeds from the sale of property, plant and equipment 147 213 300 1,813 17 607 Other - - - - - (2,500) Net cash (used in) provided by investing activities (11,067)$ (12,400)$ (681)$ 31$ (7,247)$ (380,821)$ Cash flows from financing activities Proceeds from issuance of common stock, net of expenses - - - 71,948 (155) - Proceeds from exercise of stock options 74 97 - 504 538 354 Excess tax benefits from stock-based compensation 33 6 - - - - Borrowings under revolving credit facilities 103,721 202,908 276,853 712,491 848,705 206,015 Payments under revolving credit facilities (103,721) (122,900) (328,424) (685,928) (838,705) (271,015) Payments under long-term debt obligations (19,852) (104,133) - - - (2,250) Stock repurchase (11,840) (138) (35) (384) (533) (564) Principal payments under capital lease obligations - (193) (334) (352) (671) (1,629) Proceeds from issuance of convertible senior notes - - - - - 145,500 Proceeds from issuance of term loan credit facility, net of issuance costs - - - - - 292,500 Proceeds from issuance of preferred stock and warrant - - 35,000 - - - Payments under redemption of preferred stock - - - (47,791) - - (1,362) (4) (1,420) - (1,989) (5,134) - - - - - 2,500 - - (2,638) (120) - - Preferred and common stock dividends paid (5,507) (5,510) - - - - Net cash (used in) provided by financing activities (38,454)$ (29,867)$ (20,998)$ 50,368$ 7,190$ 366,277$ Net increase (decrease) in cash and cash equivalents 11,339$ (11,458)$ (28,658)$ 20,092$ (1,224)$ 61,473$ Cash and cash equivalents at beginning of period 29,885 41,224 29,766 1,108 21,200 19,976 Cash and cash equivalents at end of period 41,224$ 29,766$ 1,108$ 21,200$ 19,976$ 81,449$ Debt amendment and issuance costs paid Preferred stock issuance costs paid Proceeds from issuance of industrial revenue bond

32 R ECONCILIATION OF N ON - GAAP M EASURES Note: This table reconciles annual net income (loss) for the periods presented to the non - GAAP measure of Operating EBITDA ($ in millions) 2007 2008 2009 2010 2011 2012 Net income (loss) 16.3$ (125.8)$ (101.8)$ (141.8)$ 15.0$ 105.6$ Income tax expense (benefit) 8.4 17.1 (3.0) (0.1) 0.2 (57.1) Increase in fair value of warrant - - 33.4 121.6 - - Interest expense 5.8 4.7 4.4 4.1 4.1 21.7 Depreciation and amortization 19.5 21.5 19.6 16.9 15.6 25.6 Stock-based compensation 4.4 5.0 3.4 3.5 3.4 5.2 Impairment of goodwill - 66.3 - - - - Acquisition expenses - - - - - 17.3 Other non-operating (income) expense (4.1) 0.2 0.9 0.7 0.5 0.2 Operating EBITDA 50.3$ (11.0)$ (43.1)$ 4.9$ 38.8$ 118.5$ % of sales 4.6% -1.3% -12.8% 0.8% 3.3% 8.1%
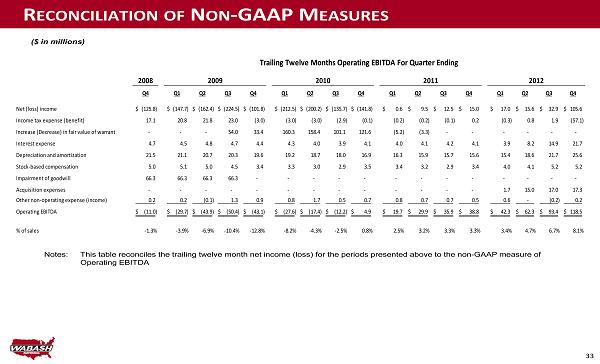
33 Notes: R ECONCILIATION OF N ON - GAAP M EASURES ($ in millions) This table reconciles the trailing twelve month net income (loss) for the periods presented above to the non - GAAP measure of Operating EBITDA 2008 Q4 Q1 Q2 Q3 Q4 Q1 Q2 Q3 Q4 Q1 Q2 Q3 Q4 Q1 Q2 Q3 Q4 Net (loss) income (125.8)$ (147.7)$ (162.4)$ (224.5)$ (101.8)$ (212.5)$ (200.2)$ (135.7)$ (141.8)$ 0.6$ 9.5$ 12.5$ 15.0$ 17.0$ 15.6$ 32.9$ 105.6$ Income tax expense (benefit) 17.1 20.8 21.8 23.0 (3.0) (3.0) (3.0) (2.9) (0.1) (0.2) (0.2) (0.1) 0.2 (0.3) 0.8 1.9 (57.1) Increase (Decrease) in fair value of warrant - - - 54.0 33.4 160.3 158.4 101.1 121.6 (5.2) (3.3) - - - - - - Interest expense 4.7 4.5 4.8 4.7 4.4 4.3 4.0 3.9 4.1 4.0 4.1 4.2 4.1 3.9 8.2 14.9 21.7 Depreciation and amortization 21.5 21.1 20.7 20.3 19.6 19.2 18.7 18.0 16.9 16.3 15.9 15.7 15.6 15.4 18.6 21.7 25.6 Stock-based compensation 5.0 5.1 5.0 4.5 3.4 3.3 3.0 2.9 3.5 3.4 3.2 2.9 3.4 4.0 4.1 5.2 5.2 Impairment of goodwill 66.3 66.3 66.3 66.3 - - - - - - - - - - - - - Acquisition expenses - - - - - - - - - - - - - 1.7 15.0 17.0 17.3 Other non-operating expense (income) 0.2 0.2 (0.1) 1.3 0.9 0.8 1.7 0.5 0.7 0.8 0.7 0.7 0.5 0.6 - (0.2) 0.2 Operating EBITDA (11.0)$ (29.7)$ (43.9)$ (50.4)$ (43.1)$ (27.6)$ (17.4)$ (12.2)$ 4.9$ 19.7$ 29.9$ 35.9$ 38.8$ 42.3$ 62.3$ 93.4$ 118.5$ % of sales -1.3% -3.9% -6.9% -10.4% -12.8% -8.2% -4.3% -2.5% 0.8% 2.5% 3.2% 3.3% 3.3% 3.4% 4.7% 6.7% 8.1% 20122009 2010 2011 Trailing Twelve Months Operating EBITDA For Quarter Ending