Attached files
| file | filename |
|---|---|
| 8-K - CURRENT REPORT - MID AMERICA APARTMENT COMMUNITIES INC. | v334589_8k.htm |

Capital Markets Update February 2013

MAA | A BRIGHTER VIEW 2 Long-Term Performance Profile • Full cycle performance objective – Focused on high growth markets – Two-tier market strategy – Competitive in Up Cycle – Protected in Down Cycle • Create competitive advantage for capital to generate outperformance over long-term – Capital deployment practices • Acquisitions • New development – Superior operations • Scale • Technology FFO per Share Dividend per Share FFO/Share for 2003 and 2010 excludes non-routine items. IPO

MAA | A BRIGHTER VIEW 3 Long-Term Performance Profile 5 Year Total Shareholder Return 10 Year Total Shareholder Return MAA Multifamily REIT Peer Group 81.22% 65.71% 374.76% 234.87%

MAA | A BRIGHTER VIEW 4 Focus on High Growth Region > $200MM $100MM –$200 MM < $55MM$55MM -$100MM MAA Concentration –Gross Real Assets Percent of Gross Assets Large Markets Dallas, TX 9.3% Atlanta, GA 7.9% Jacksonville, FL 7.4% Nashville, TN 7.4% Houston, TX 5.8% Austin, TX 4.6% Raleigh/Durham, NC 4.2% Tampa, FL 3.4% Phoenix, AZ 3.0% Orlando, FL 1.7% South Florida 1.4% Charlotte, NC 1.3% Richmond, VA 1.1% Total Large Markets 58.5% Secondary Markets Memphis, TN 5.0% San Antonio, TX 2.9% Little Rock, AR 2.8% Greenville, SC 2.4% Columbus, GA 2.2% Savannah, GA 1.9% Jackson, MS 1.7% Lexington, KY 1.7% Charleston, SC 1.5% Norfolk, Hampton, VA Beach, VA 1.4% Kansas City, MO 1.4% Tallahassee, FL 1.2% Augusta, GA/Aiken, SC 1.2% Birmingham, AL 1.1% Chattanooga, TN 1.1% Macon, GA 1.1% All other Secondary 10.9% Total Secondary Markets 41.5%

MAA | A BRIGHTER VIEW 5 Active Capital Recycling • Recent acquisitions average 20 years newer than recent dispositions • Average rents on recent acquisitions are 54% higher than recent dispositions • In 2013, targeting an additional $150-$160 million of dispositions and $250- $300 million of acquisitions Cap Price Units Avg Rent Rate Age Acquisitions by Year (wholly-owned): 2009 78,300$ 1,064 835$ 6.9% 4 2010 230,050$ 2,138 794$ 6.0% 1 2011 362,515$ 3,055 1,064$ 5.9% 3 2012 345,075$ 2,451 1,163$ 5.6% 6 1,015,940$ 8,708 1,019$ 5.9% 4 Dispositions by Year (wholly-owned): 2009 29,800$ 840 542$ 7.0% 27 2010 -$ - 2011 23,950$ 534 626$ 6.5% 27 2012 113,200$ 2,254 703$ 6.8% 23 166,950$ 3,628 663$ 6.8% 24

MAA | A BRIGHTER VIEW 6 Positive Outlook for Leasing Fundamentals • Not the typical Sunbelt Region exposure to supply risks • MAA’s “two-tier market”portfolio strategy drives down risks/volatility while continuing to capture the superior demand side characteristics of the region • Permitting trends favor MAA strategy Source: Census Bureau, Moody’s economy.com Over the last up cycle (2004-2007), the ratio of new jobs to multifamily completions in our markets averaged 7 to 1. The projected ratiofor 2013 far exceeds the average while the secondary market segment is expected to outperform in 2013 as supply from recent permitting ramps up more in the large markets. • Permitting picked up in 2012; more so in the large markets • Despite this increase in projected supply, job growth is expected to outpace the average in both market tiers, helping to offset the impact of the new supply and drive positive absorption • Job growth combined with the lack of relative supply in the secondary markets, creates compelling opportunity in this market tier (40% of gross assets) • New mortgage rules in effect in early 2014 should maintain the disciplined lending environment, keeping the loss of residents to home ownership at normal (or below normal) levels Fcst
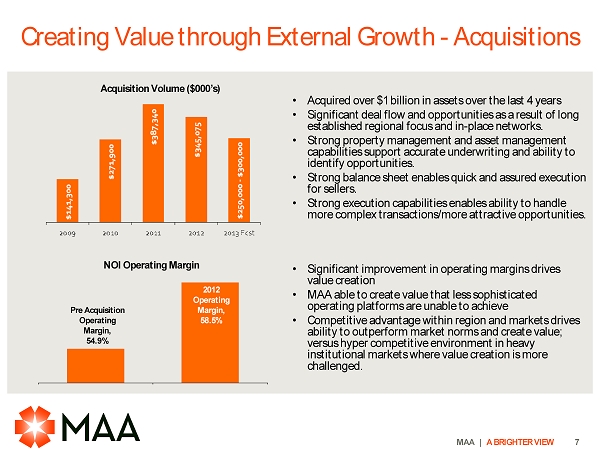
MAA | A BRIGHTER VIEW 7 • Acquired over $1 billion in assets over the last 4 years • Significant deal flow and opportunities as a result of long established regional focus and in-place networks. • Strong property management and asset management capabilities support accurate underwriting and ability to identify opportunities. • Strong balance sheet enables quick and assured execution for sellers. • Strong execution capabilities enables ability to handle more complex transactions/more attractive opportunities. NOI Operating Margin 2012 Operating Margin, 58.5% Pre Acquisition Operating Margin, 54.9% • Significant improvement in operating margins drives value creation • MAA able to create value that less sophisticated operating platforms are unable to achieve • Competitive advantage within region and markets drives ability to outperform market norms and create value; versus hyper competitive environment in heavy institutional markets where value creation is more challenged. Acquisition Volume ($000’s) Creating Value through External Growth -Acquisitions

MAA | A BRIGHTER VIEW 8 Creating Value through External Growth -Development DEVELOPMENT PIPELINE 3.4% of Multifamily Gross Assets Current Percent Cost Total Available Total to Date Initial MSA Units to Occupy Occupied Leased ($000s) per Unit ($000s) Start Finish Occupancy River's Walk Charleston 270 0% N/A N/A 33,400$ 124$ 15,200$ 1Q12 4Q13 2Q13 1225 South Church Phase II Charlotte 210 0% N/A N/A 27,300$ 130$ 23,400$ 2Q11 1Q13 1Q13 220 Riverside Jacksonville 294 0% N/A N/A 40,400$ 137$ 5,300$ 4Q12 4Q14 3Q14 Total 774 0% N/A N/A 101,100$ 131$ 43,900$ DEVELOPMENT COMMUNITIES IN LEASE-UP Current Cost Total Percent Total to Date Construction Expected MSA Units Occupied ($000s) per Unit ($000s) Finished Stabilized Ridge at Chenal Valley Little Rock 312 77% 29,200$ 94$ 29,100$ 3Q12 3Q13 Cool Springs Nashville 428 77% 56,400$ 132$ 56,300$ 4Q12 4Q13 Total 740 77% 85,600$ 116$ 85,400$ Estimated CostPercent of Units ConstructionAvailable to Occupy Estimated Cost Total expected average yield of development pipeline is 7.5% -8%

MAA | A BRIGHTER VIEW 9 Strong Investment Grade Balance Sheet -Progress

MAA | A BRIGHTER VIEW 10 Strong Investment Grade Balance Sheet -Position Agency Rating Outlook Fitch BBB Stable Moody's Baa2 Stable S&P BBB- Positive

MAA | A BRIGHTER VIEW 11 Migrating to unsecured, primarily fixed rate debt Common Equity Unsecured Debt Secured Debt Strong Investment Grade Balance Sheet -Profile

MAA | A BRIGHTER VIEW 12 Source: Cap rate data from BMO Capital Markets Update (1/22/13) and same store data from Green Street Nov ’12 Residential Sector Update (last full cycle 2004-2012). • MAA is currently priced at a multiple and implied cap rate discount to the sector average. • However, MAA’s historical long-term internal same store growth (and overall FFO growth) performance exceeds the sector average; established record of exceeding regional ‘market’performance levels and sector ‘averages’. Implied 10 Year IRR: • MAA outperforms by 100 bps on unleveraged basis with continued cap rate discount. • MAA outperforms by 180 bps on a leveraged basis. • MAA outperforms by 370 bps on a leveraged basis by capturing the sector’s current average cap rate. • Actual historical results and current position suggests otherwise • Implies long-term same store earnings growth rate 90 bps (25%) lower than sector Attractive Pricing Opportunity 8% 9%

MAA | A BRIGHTER VIEW 13 Source: 2002-2011 same store data from Green Street Nov ’12 Residential Sector Update (NOI adjusted for capex); 2012-13 data from company earnings release Same Store NOI Growth (2002-2013Fcst) MAA has generated higher average growth combined with lower volatility than peers Average 1.1% 1.8% 1.6% 1.9% 2.0% 1.1% 1.8% Attractive Pricing Opportunity

MAA | A BRIGHTER VIEW 14 Summary • Quality assets • High growth markets poised for solid leasing fundamentals • Full cycle performance profile supports superior long-term shareholder performance • Strengthened and well positioned balance sheet

MAA | A BRIGHTER VIEW 15 Market StationKansas City, MO 2012 Acquisition Ridge at Chenal ValleyLittle Rock, AR Development Hue Raleigh, NC 2010 Acquisition Tattersall at Tapestry ParkJacksonville, FL 2011 Acquisition

MAA | A BRIGHTER VIEW 16 1225 South ChurchCharlotte, NC PhI 2010 Acquisition PhII Development Retreat at Lake NonaOrlando, FL 2012 Acquisition Bella Casita at Las CollinasDallas, TX 2010 Acquisition Allure at BrookwoodAtlanta, GA 2012 Acquisition

17 Certain matters in this presentation may constitute forward-looking statements within the meaning of Section 27-A of the Securities Act of 1933 and Section 21E of the Securities and Exchange Act of 1934. Such statements include, but are not limited to, statements made about anticipated economic and market conditions, expectations for future demographics, the impact of competition,general changes in the apartment industry, expectations for acquisition and joint venture performance, ability to pay dividends and the ability to obtain financing at reasonable rates. Actual results and the timing of certain events could differ materially from those projected in or contemplated by the forward-looking statements due to a number of factors, including a downturn in general economic conditions or the capital markets, competitive factors including overbuilding or other supply/demand imbalances in some or all of our markets,changes in interest rates and other items that are difficult to control such as the impact of legislation, as well as the other general risks inherent in the apartment and real estate businesses. Reference is hereby made to the filings of Mid-America Apartment Communities, Inc., with the Securities and Exchange Commission, including quarterly reports on Form 10-Q, reports on Form 8-K, and its annual report on Form 10-K, particularly including the risk factors contained in the latter filing. End of Presentation Eric Bolton CEO 901-248-4127 eric.bolton@maac.com Al Campbell CFO 901-248-4169 al.campbell@maac.com Leslie Wolfgang Investor Relations 901-248-4126 leslie.wolfgang@maac.com Jennifer Patrick Investor Relations 901-435-5371 jennifer.patrick@maac.com http://ir.maac.com