Attached files
| file | filename |
|---|---|
| 8-K - 8-K - MARKWEST ENERGY PARTNERS L P | a13-4484_28k.htm |
Exhibit 99.1
|
|
Argus Americas LPG Summit Randy Nickerson, SVP & CCO February 7, 2013 |

|
|
Forward-Looking Statements This presentation contains forward-looking statements and information. These forward-looking statements, which in many instances can be identified by words like “could,” “may,” “will,” “should,” “expects,” “plans,” “project,” “anticipates,” “believes,” “planned,” “proposed,” “potential,” and other comparable words, regarding future or contemplated results, performance, transactions, or events, are based on MarkWest Energy Partners, L.P. (“MarkWest” and the “Partnership”) current information, expectations and beliefs, concerning future developments and their potential effects on MarkWest. Although MarkWest believes that the expectations reflected in the forward-looking statements are reasonable, it can give no assurance that such expectations will prove to be correct, and actual results, performance, distributions, events or transactions could vary significantly from those expressed or implied in such statements and are subject to a number of uncertainties and risks. Among the factors that could cause results to differ materially are those risks discussed in the periodic reports MarkWest files with the SEC, including its Annual Report on Form 10-K for the year ended December 31, 2011 and its Quarterly Report on Form 10-Q for the quarters ended March 31, 2012, June 30, 2012, and September 30, 2012. You are urged to carefully review and consider the cautionary statements and other disclosures, including those under the heading “Risk Factors,” made in those documents. If any of the uncertainties or risks develop into actual events or occurrences, or if underlying assumptions prove incorrect, it could cause actual results to vary significantly from those expressed in the presentation, and MarkWest’s business, financial condition, or results of operations could be materially adversely affected. Key uncertainties and risks that may directly affect MarkWest’s performance, future growth, results of operations, and financial condition, include, but are not limited to: Fluctuations and volatility of natural gas, NGL products, and oil prices; A reduction in natural gas or refinery off-gas production which MarkWest gathers, transports, processes, and/or fractionates; A reduction in the demand for the products MarkWest produces and sells; Financial credit risks / failure of customers to satisfy payment or other obligations under MarkWest’s contracts; Effects of MarkWest’s debt and other financial obligations, access to capital, or its future financial or operational flexibility or liquidity; Construction, procurement, and regulatory risks in our development projects; Hurricanes, fires, and other natural and accidental events impacting MarkWest’s operations, and adequate insurance coverage; Terrorist attacks directed at MarkWest facilities or related facilities; Changes in and impacts of laws and regulations affecting MarkWest operations and risk management strategy; and Failure to integrate recent or future acquisitions. 2 |
|
|
Key Investment Considerations High-Quality, Diversified Assets Proven Track Record of Growth and Customer Satisfaction Substantial Growth Opportunities Strong Financial Profile Leading presence in six core natural gas producing regions of the U.S. Key long-term contracts with high-quality producers to develop the Marcellus Shale, Utica Shale, Huron/Berea Shale, Woodford Shale, Haynesville Shale, and Granite Wash formation No incentive distribution rights, which drives a lower cost of capital Distributions have increased by 224% (12% CAGR) since IPO Over $7 billion of organic growth and acquisitions since IPO, including the December 2011 Liberty and May 2012 Keystone transactions Ranked #1 in EnergyPoint’s 2011 midstream customer satisfaction survey 2012 growth capital forecast of $1.8 billion 2013 growth capital forecast of $1.4 to $1.9 billion Growth projects are well diversified across the asset base and increase the percentage of fee-based net operating margin Long-term organic growth opportunities focused on resource plays Committed to maintaining strong financial profile Debt to book capitalization of 49% Debt to Adjusted EBITDA of 4.3x Adjusted EBITDA to Interest Expense of 5.2x Established relationships with joint venture partners, which provides capital flexibility 3 |
|
|
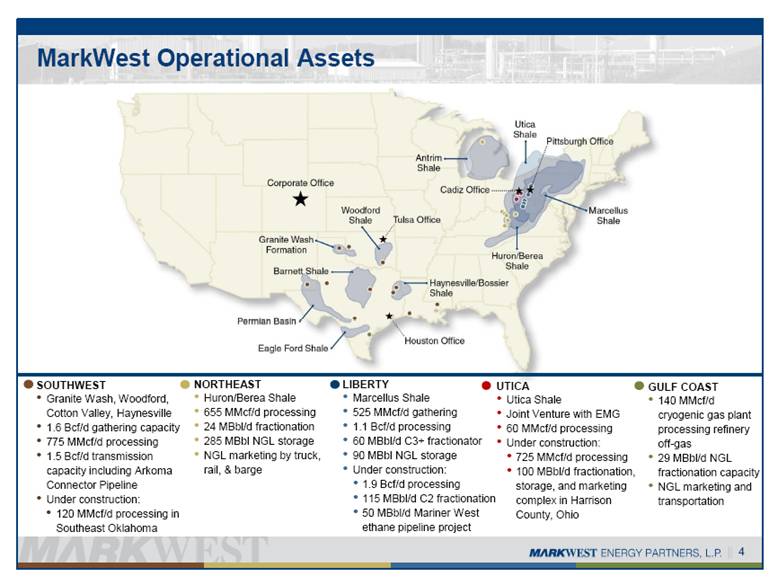
MarkWest Operational Assets UTICA Utica Shale Joint Venture with EMG 60 MMcf/d processing Under construction: 725 MMcf/d processing 100 MBbl/d fractionation, storage, and marketing complex in Harrison County, Ohio SOUTHWEST Granite Wash, Woodford, Cotton Valley, Haynesville 1.6 Bcf/d gathering capacity 775 MMcf/d processing 1.5 Bcf/d transmission capacity including Arkoma Connector Pipeline Under construction: 120 MMcf/d processing in Southeast Oklahoma NORTHEAST Huron/Berea Shale 655 MMcf/d processing 24 MBbl/d fractionation 285 MBbl NGL storage NGL marketing by truck, rail, & barge LIBERTY Marcellus Shale 525 MMcf/d gathering 1.1 Bcf/d processing 60 MBbl/d C3+ fractionator 90 MBbl NGL storage Under construction: 1.9 Bcf/d processing 115 MBbl/d C2 fractionation 50 MBbl/d Mariner West ethane pipeline project GULF COAST 140 MMcf/d cryogenic gas plant processing refinery off-gas 29 MBbl/d NGL fractionation capacity NGL marketing and transportation 4 |
|
|
U.S. Shale Plays are Driving Natural Gas Supply 5 EIA data concludes shale gas development will increase from 8.1 trillion cubic feet in 2012 to 11.0 trillion cubic feet by 2020, a 36% increase. In 2020, shale gas will account for 42% of total U.S. dry natural gas production MarkWest is focused on midstream development in resource plays (Marcellus, Utica, Granite Wash, Haynesville, Huron, Woodford) and has benefited tremendously from the advantages of being a first mover Source: U.S. Energy Information Administration, Annual Energy Outlook 2013 Early Release 2012 34% 24% 2% 7% 7% 10% 16% 24% 1% 5% 6% 11% 11% |
|
|
U.S. Shale Play Volume Growth 6 In 2012, the Marcellus Shale became the largest producing natural gas resource play in the U.S. Sources: EIA, Lippman Consulting, Inc. gross withdrawal estimates as of December 2012 and converted to dry production estimates with EIA-calculated average gross-to-dry shrinkage factors by state and/or shale play. Barnett Haynesville Marcellus |
|
|
Growth Driven by Customer Satisfaction 7 Ranked #1 in Midstream Customer Satisfaction Survey for 2011 Since 2006, we have been ranked #1 or #2 by EnergyPoint Research |
|
|
MarkWest Liberty: Current Processing Capacity of 1.1 Bcf/d 8 Growing to nearly 3 Bcf/d of processing capacity in the Marcellus Shale by 2014 TEPPCO PRODUCTS PIPELINE SUNOCO PIPELINE EPD ATEX EXPRESS PIPELINE Mariner West De-ethanization I Houston I, II, III De-ethanization I, II Majorsville I, II, III, IV, V, VI Sarsen & Bluestone I, II, III Sherwood I, II, III Mobley I, II, III Harrison Fractionation & marketing facilities Sarsen Bluestone I Majorsville I-II Houston I-III Mobley I Sherwood I Majorsville III, V Mobley II, III Sherwood II, III Bluestone II, III Majorsville IV, VI 2014 2013 Current & 2012 Mariner East |

|
|
MarkWest Utica EMG JV Processing Capacity 9 Growing to nearly 800 MMcf/d of processing capacity in the Utica Shale by the end of 2013 Cadiz Interim Cadiz I, II Seneca I, II 2013 2012 Mobley Sherwood Houston Majorsville Seneca I, II Harrison Fractionator TEPPCO PRODUCTS PIPELINE EPD ATEX EXPRESS PIPELINE Sarsen & Bluestone INTERCONNECT TO 3RD PARTY PIPELINE Cadiz I, II and De-ethanization SUNOCO PIPELINE |
|
|
100% 34% 44% 22% MarkWest Marcellus & Utica Fractionation Capacity 10 Approximately 275,000 Bbl/d of fractionation capacity in the Marcellus and Utica Shales by 2014 2014 2013 Current 2014: Majorsville De-Ethanization 38,000 Bbl/d 2013: Majorsville De-Ethanization 38,000 Bbl/d 2013: Houston De-Ethanization 38,000 Bbl/d 2012: Houston C3+ Fractionation 60,000 Bbl/d 2014 175,000 Bbl/d 100,000 Bbl/d Liberty Utica 2014: Harrison C3+ Fractionation 60,000 Bbl/d 2014: Harrison De-Ethanization 40,000 Bbl/d |
|
|
11 Utica Shale – Gulfport Activity 11 Source: Gulfport Energy Corporation ~ 137,000 gross (106,000 net) acres Focused within the wet gas/retrograde condensate and mature oil windows of the Utica/Point Pleasant 5 year lease terms that are extendable with 5 year options Continue to pursue attractive acreage acquisition opportunities 77% interest / 100% operated 455 MBOE – 910 MBOE EUR / well (2) 856 gross locations (3) 36.4 MMBoe of gross original oil in place per section (2) Asset Overview (1) 2012 Activities Update (1) Currently running two rigs Spudded fifteen wells 2013 Planned Activities (1) Plan to drill approximately 50 gross wells CAPEX (net): $347 to $351 million OHIO PENNSYLVANIA WEST VIRGINIA Chesapeake Buell #8H 9.5 MMcfpd + 1,425 Bblpd liquids Six 400 Bbl tanks on location Anadarko Spencer #A-1H & #A-5H 2-Month Production: 20,000 Bbls of oil + 37 MMcf of gas Range Resources Zahn #1H 7-Day Average Test Rate of 4.4 MMcfepd Chesapeake Neider #3H 3.8 MMcfpd + 980 Bblpd liquids Enervest Frank 2H 24-Hour Test Rate of 1.2 MMcfd + 360 Bblpd of oil + 312 BBlpf of NGL Rex Energy Cheeseman #1H 24-Hour Test Rate of 9.2 MMcfpd Antero Miley #5H Completed Hess / Marquette N. American Coal #3H-3 24-Hour Test Rate of 11 MMcfpd Chesapeake Shaw #5H Peak rate 2.9 Mmcfpd + 180 Bblpd of NGL + 770 Bblpd of oil Chesapeake Brown #10H Peak rate 1,445 Boepd (Inc. 8.7 MMcfpd of gas) Chesapeake Conglio #6H Peak Rate 5.0 Mmcfpd + 290 Bopd Gulfport Energy Wagner #1-28H Gulfport Energy Boy Scout #1-33H Boy Scout #5-33H Gulfport Energy Ryser #1-25H Gulfport Energy Shugert #1-12H Chesapeake Burgett #8H Peak rate 2.1 Mmcfpd + 140 Bblpd of NGL + 720 Bblpd of oil Anadarko Brookfield #A-3H 20 Day Production: ~9,500 Bbls of oil + ~12 MMcf of gas Gulfport Energy Shugert #1-1H Gulfport Energy BK Stephens #1-16H Antero Rubel Unit Completed Gulfport Energy Groh #1-12H Enervest Cairns 5H 24-Hour Test Rate of 2.2 MMcfd + 729 Bblpd of oil + 587 BBlpf of NGL CONSOL NBL 1A Peak rate of 9.0 MMcfpd + 10 Bblpd of condensate Gulfport Energy Lyon #1-27H - Completing Lyon #2-27H - WOC Gulfport Energy Stout #1-28H – WOC Stout #2-28H – Drilling Gulfport Energy Clay 1-4H Gulfport Energy Stutzman #1-14H Chesapeake Houyouse #8H Peak rate 5.6 Mmcfpd + 335 Bblpd of NGL + 465 Bblpd of oil Chesapeake White #8H Peak rate 4.1 Mmcfpd + 285 Bblpd of NGL + 390 Bblpd of oil Chesapeake Stuart Henderson #1H Peak rate 1.9 Mmcfpd + 100 Bblpd of NGL + 410 blpd of oil CONSOL / Hess Athens A 1H-24 Peak rate of 13.9 MMcfpd + 1,056 Bblpd ofcondensate CONSOL NBL 16A Peak rate of 12.0 MMcfpd + 768 Bblpd of condensate Gulfport Energy McCort #1-28H Drilling |

|
|
12 Utica Shale – Gulfport – Summary of Wells 12 First nine wells averaged a rate of 787 barrels of condensate per day, 10.85 MMCF of natural gas per day and 1,253 barrels of NGLs, or 3,849 BOEPD (1) Production mix of included approximately 20% condensate, 47% natural gas, and 33% natural gas liquids Production Mix Well Name County Completion Date Length of Lateral (feet) Frac Stages IP Rate (Boe/d) (1) Oil Gas NGLs Shrink Factor (1) Wagner 1-28H Harrison 5/28/2012 8,143 28 4,650 9% 50% 41% 18% Boy Scout 1-33H Harrison 6/13/2012 7,974 22 3,456 45% 26% 29% 25% Groh 1-12H Guernsey 7/7/2012 5,414 16 1,935 61% 20% 19% 18% Shugert 1-1H Belmont 7/27/2012 5,758 16 4,913 3% 56% 41% 17% Ryser 1-25H Harrison 8/11/2012 8,291 23 2,914 51% 27% 22% 21% BK Stephens 1-14H (2) Harrison 9/19/2012 5,276 19 3,007 41% 34% 25% 11% Shugert 1-12H Belmont 9/7/2012 8,197 25 7,482 4% 57% 39% 10% Clay 1-4H Harrison 11/8/2012 7,372 28 2,226 34% 32% 34% 27% Stutzman 1-14H (3) Belmont 1/9/2013 8,634 34 4,060 - 77% 23% 11% Source: Gulfport filings Assumes full ethane recovery Test rate reflecting a 30-day resting period and the well will return to complete a 60 day resting period Test rate reflecting a 12day resting period and the well will return to complete a 60 day resting period |

|
|
77,000 net acres of leasehold in core of the play 23% HBP and additional 77% not expiring for 5-plus years Over 90% of acreage has rich gas processing potential 100% operated by Antero 95 Bcfe of proved reserves / 2.6 Tcfe of 3P reserves Three wells completed with strong results – waiting on pipeline, compression 100% drilling success rate Fully Integrated MarkWest’s 200 MMcf/d Seneca I cryogenic processing plant online in 3Q 2013 Access to 20,000 Bbl/d of ethane takeaway capacity on Enterprise ATEX pipeline to Mont Belvieu Utica Shale – Antero Activity Summary Source: Antero Resources Corporation 13 Gulfport Energy Wagner #1-28H Peak Rate 17.1 MMcf/d + 1,881 Bbl/d NGL + 432 Bbl/d condensate Chesapeake Bailey #3H Peak Rate 5.7 MMcf/d + 270 Bbl/d NGL + 205 Bbl/d oil Chesapeake Brown #10H Peak Rate 1,445 Boe/d (Including 8.7 MMcf/d gas) Rex Energy Talarico / Drustel Pads 30-Day Average Test Rate ~5.3 MMcf/d EUR ~5+ Bcf Range resources Zahn #1 7-Day Average Test Rate of 4.4 MMcfe/d Rex Energy Cheeseman #1H 9.2 MMcf/d Chesapeake Thompson 3H 6.4 MMcf/d Chesapeake Coniglio #6H 1,125 Boe/d with 290 Bbl/d Oil Chesapeake Mangun #8H 3.1 MMcf/d + 1,015 Bbl/d liquids Chesapeake Neider #3H 3.8 MMcf/d + 980 Bbl/d liquids Chesapeake Shaw #5H 1,435 Boe/d with 770 Bbl/d Oil + 180 Bbl/d NGL Chesapeake Burgett #8H 1,210 Boe/d with 70% Liquids Chesapeake Snoddy #6H Peak Rate 4.2 MMcf/d + 250 Bbl/d NGL + 320 Bbl/d oil Chesapeake Buell #8H 9.5 MMcf/d + 1,425 Bbl/d liquids Gulfport Energy Shugert #1-12H 26 MMcf/d + 2,907 Bbl/d NGL + 300 Bbl/d oil Gulfport Energy Shugert #1-1H 20 MMcf/d + 2,022 Bbl/d NGL + 144 Bbl/d Oil Gulfport Energy BK Stephens #1-16H Peak rate 6.9 MMcf/d + 759 Bbl/d NGL + 1,224 Bbl/d condensate Chesapeake Geatches MAH #3H Completing Horizontal CNX/Hess Peak Rate 7 MMcf/d + 823 Bbl/d NGL + 10 Bbl/d Condensate Antero Rubel Unit 1H Strong Results Gulfport Energy Boy Scout #1-33H Peak rate 7.1 MMcf/d + 1,008 Bbl/d NGL + 1,560 Bbl/d condensate Gulfport Energy Ryser #1-25H Peak rate 5.9 MMcf/d + 649 Bbl/d NGL + 1,488 Bbl/d condensate Gulfport Energy Groh #1-12H Peak rate 2.8 MMcf/d + 367 Bbl/d NGL + 1,186 Bbl/d condensate Anadarko Spencer A-1H & A-5H CUM first 2 months: 20,000 Bbl + 37 MMcf Anadarko Brookfield A-3H CUM first 20 days: 9,500 Bbl + 12 MMcf Enervest Cairns #5H 2.2 MMcf/d + 1,316 Bbl/d liquids Antero Sanford 1H Strong Results Antero Miley Unit 5HA Strong Results |
|
|
~ 6,300 gross (4,100 net) acres with approximately 20 net drilling locations Drilled and completed three wells and plans to bring seven wells online in 2013 Rex Energy Utica Overview Contract Summary Gulfport and Rex anchor critical tri-county area All of Warrior South Prospect gas and NGLs are committed to MarkWest Utica EMG Initially 10 MMcfd of firm capacity growing to 20 MMcfd in 2014 Gathering, processing and fractionation agreement is fee based and includes processing volume guarantees Processing will occur in the Seneca processing complex MarkWest gathers and processes Rex’s gas in the Marcellus Rex Energy Overview 14 Rex Acreage Source: Rex Energy |

|
|
Additional producers identified in the core area have combined acreage of between 200,000 and 250,000 acres Our core area, where we believe we have a competitive advantage, covers approximately 1.5 million acres. Additional Producers in Core Area Summary of Opportunity Utica producers are interested in fee based agreements and are willing to provide volume backstops MarkWest Utica EMG now has the critical mass and full spectrum of services to enable us to capture a significant portion of the production inside our core area If we capture only 50% of the total acreage, it could support more than 4 Bcf/d of total processing and 230,000 Bbl/d of total C3+ fractionation Tremendous Opportunity 15 MarkWest Utica Core Area |

|
|
MarkWest Marcellus and Utica Processed Gas Volumes 16 MWE Announced Projects |
|
|
MarkWest Marcellus and Utica Potential C3+ Volumes 17 MWE Announced Projects |

|
|
MarkWest Marcellus and Utica Potential Ethane Volumes 18 MWE Announced Projects |

|
|
MarkWest’s Perspective on Northeast Ethane Production Prior to July of this year, no ethane will be recovered (other than at MarkWest's Keystone facilities) and some residue pipelines may reject gas deliveries due to high Btu content Between July of this year and the start-up of the ATEX pipeline in early 2014, the Mariner West project will be the only active ethane project and MarkWest will be the only processor recovering ethane In 2013 through 2015 Marcellus and Utica producers will probably only recover the minimum amount of ethane in order for their residue gas to meet gas quality specifications By 2017, MarkWest’s producer customers could produce as much as 200,000 Bbl/d of ethane We estimate that our producer customers have committed between 100,000 and 125,000 Bbl/d to current ethane projects 19 Purity product pipeline projects in Marcellus and Utica will maximize producer economics Image Mobley Processing Seneca Processing Cadiz Processing & Harrison Fractionation Rich Utica Rich Marcellus Sherwood Processing Marketing Capabilities Truck Rail Pipe Boat Majorsville Processing & De-Ethanization Houston Processing & Fractionation Keystone Processing 40 Mb/d TEPPCO ATEX Mariner Pipelines Mariner West Mariner East |
|
|
Northeast Propane Supply and Demand 20 The Targa and Enterprise Gulf Coast export facilities should create sufficient demand to offset growth in NGLs in 2013 and 2014 New PDH plants will also increase long-term propane demand MarkWest has led the Northeast propane export efforts and we have been exporting propane internationally since June 2012 MarkWest and Range Resources have committed to 25,000 Bbl/d of propane export capacity on Mariner East Important to watch whether producers in northern Utica counties like Carroll and Columbiana, OH, and northwestern PA can address the frac barrier challenges. If so, PADD I may no longer be a net importer in the winter and a new y-grade pipeline may have economic justification Exports in the Northeast are key to maintaining the supply short position of PADD I in the winter. Every month that PADD I is a net importer, Northeast producers make an additional $0.10 to $0.25 per wellhead Mcf Photo by Wheeling & Lake Erie Railway Co. MarkWest Houston Rail Yard |
|
|
Northeast Butanes and Gasoline Supply and Demand 21 Marcellus natural gasoline already serves western Canadian heavy oil markets and Utica condensate production will increase access to these markets. Marcellus natural gasoline will maintain its transportation advantage over the US Gulf Coast supplies Northeast iso-butane will continue to effectively compete with Canadian, Midwestern US, and Gulf Coast iso-butane supplies, and Northeast iso-butane will maintain its advantaged pricing over normal butane For the Northeast, the saying was “propane was the new ethane” but that has evolved into “butane is the new propane” The Northeast supply and demand balance would be helped by either new butane isomerization capacity or a butane export facility. A new y-grade pipeline would also effectively increase Northeast butane demand We continue to analyze the installation of an isomerization facility but are currently focusing on butane exports. Fortunately, there are a number of potential butane export facilities that could begin operation in the next year |
|
|
Keys to Success Maintain stronghold in key resource plays with high-quality assets Execute growth projects that are well diversified across the asset base 22 EXECUTE, EXECUTE, EXECUTE!!! Provide best-in-class midstream services for our producer customers Preserve strong financial profile Deliver superior & sustainable total returns |
|
|
1515 ARAPAHOE STREET TOWER 1, SUITE 1600 DENVER, COLORADO 80202 PHONE: 303-925-9200 INVESTOR RELATIONS: 866-858-0482 EMAIL: INVESTORRELATIONS@MARKWEST.COM WEBSITE: WWW.MARKWEST.COM |
