Attached files
| file | filename |
|---|---|
| 8-K - FORM 8-K - EveryWare Global, Inc. | v333373_8k.htm |
| EX-2.1 - EXHIBIT 2.1 - EveryWare Global, Inc. | v333373_ex2-1.htm |
| EX-99.2 - EXHIBIT 99.2 - EveryWare Global, Inc. | v333373_ex99-2.htm |
January 31, 2013 Investor Presentation Business Combination with ROI Acquisition Corp.
1 Forward Looking Statements This presentation includes "forward looking statements" within the meaning of the "safe harbor" provisions of the United States Private Securities Litigation Reform Act of 1995 . Forward - looking statements may be identified by the use of words such as "anticipate", "believe", "expect", "estimate", "plan", "outlook", and "project" and other similar expressions that predict or indicate future events or trends or that are not statements of historical matters . Such forward looking statements with respect to revenues, earnings, performance, strategies, prospects and other aspects of the businesses of ROI Acquisition Corp . (“ROI”), EveryWare Global, Inc . (“EveryWare”) and the combined company after completion of the proposed business combination, are based on current expectations that are subject to risks and uncertainties . A number of factors could cause actual results or outcomes to differ materially from those indicated by such forward looking statements . These factors include, but are not limited to : ( 1 ) the occurrence of any event, change or other circumstances that could give rise to the termination of the Business Combination Agreement and Plan of Merger for the business combination (the "Business Combination Agreement") ; ( 2 ) the outcome of any legal proceedings that may be instituted against ROI, EveryWare or others following announcement of the Business Combination Agreement and transactions contemplated therein ; ( 3 ) the inability to complete the transactions contemplated by the Business Combination Agreement due to the failure to obtain approval of the stockholders of the ROI or other conditions to closing in the Business Combination Agreement ; ( 4 ) the risk that the proposed transaction disrupts current plans and operations as a result of the announcement and consummation of the transactions described herein ; ( 5 ) the ability to recognize the anticipated benefits of the business combination, which may be affected by, among other things, competition, the ability of the combined company to grow and manage growth profitably, maintain relationships with suppliers and obtain adequate supply of products and retain its key employees ; ( 6 ) costs related to the proposed business combination ; ( 7 ) changes in applicable laws or regulations ; ( 8 ) the possibility that EveryWare may be adversely affected by other economic, business, and/or competitive factors ; and ( 9 ) other risks and uncertainties indicated from time to time in the proxy statement, including those under “Risk Factors” therein, and other filings with the Securities and Exchange Commission (“SEC”) by ROI . You are cautioned not to place undue reliance upon any forward - looking statements, which speak only as of the date made, and ROI and EveryWare undertake no obligation to update or revise the forward - looking statements, whether as a result of new information, future events or otherwise . Financial Presentation This presentation includes non - GAAP financial measures, including EBITDA, Adjusted EBITDA, Adjusted EBITDA margin and Free Cash Flow. EBITDA is calculated as earnings before interest and taxes (“EBIT”) plus depreciation and amortization (“EBITDA”). Adjusted EBITDA is cal culated as EBITDA plus restructuring expenses, certain acquisition/merger - related transaction fees, inventory writedown, management fees and reimbursed expenses paid to current EveryWare shareholders that will not continue following the business combination and other items as described below. For 201 1, restructuring items included consulting and legal fees, recruiting costs and other transaction costs associated with a refinancing activity at Anchor Hock ing . For 2012, restructuring items included severance expense, consultant costs, recruiting costs and reimbursed expenses for existing EveryWare shareholders. The acquis iti on/merger - related transaction fees relate solely to either the November 2011 acquisition of Oneida or the March 2012 merger/refinancing of EveryWare and not the pr oposed business combination with ROI. For 2011, acquisition/merger - related transaction fees included (i) $3.5 million of Oneida acquisition expenses and (ii) a ($1.6) million reversal for the cancellation of the Oneida retiree life insurance liability. For 2012, acquisition/merger - related transaction fees included (i) a $2.0 million prepayment fee to retire certain Anchor debt upon the March 2012 refinancing and (ii) $2.3 million of merger - related expenses, employee sale bonuses and severance expense, and early termination fees associated with the Canadian warehouse closure. For 2011, other items included benefits from foreign exchang e g ains and gains on the disposal of fixed assets. For 2012, other items included (i) a one - time $2.3 million accounts receivable write down and (ii) adjustments fo r environmental reserve increases, non - cash stock - based compensation and losses on the disposal of fixed assets. In addition, Adjusted EBITDA for 2012 is further adjus ted to give pro forma effect to (i) the full - year impact of certain cost improvements implemented within the fiscal year, (ii) the expected benefit of the unwind of a n atural gas hedge and (iii) the estimated increased expenses of operating as a public company. A reconciliation of EBIT to Adjusted EBITDA is set forth on page 33. A dju sted EBITDA margin is defined as Adjusted EBITDA divided by net sales. Free Cash Flow is defined as Adjusted EBITDA less capital expenditures.
2 Financial Presentation (continued) Wherever referenced, 2011 results include financial results for the two months ended December 31, 2011 for Oneida and 12 mont hs ended December 31, 2011 for Anchor Hocking. All financial information included in this document is unaudited and is subject to change. Furthermore, certain financial information in this presentation gives effect to the proposed business combination with ROI, i ncl uding TEV, 2013 Estimated EPS, 2013 Estimated Adjusted EPS and 2013E P/E/Growth. TEV represents total enterprise value, which is calculated as equity value plus deb t outstanding minus cash. For purposes of calculating TEV, we have assumed that $107.5 million in cash consideration is paid to existing EveryWare sharehol der s, existing ROI shareholders redeem $17.1 million of shares (representing 23% of the cash in trust), and $245 million in net debt is funded at closing. 20 13 Estimated EPS is estimated earnings per share, calculated in accordance with GAAP, but with earnings adjusted to add back management fees and reimbursed expenses to Eve ryWare shareholders, and further adjusted to give pro forma effect to the items noted in the description of Adjusted EBITDA above. The shares contempl ate d in EveryWare’s EPS do not include earnout shares and only include shares that are vested upon the closing of the contemplated transaction. 2013 Estimat ed Adjusted EPS is calculated as 2013 Estimated EPS plus deferred tax components, such as temporary book - to - tax variances and the impact of existing NOLs, thereby ref lecting a cash tax view of EPS. 2013E P/E/Growth is calculated as 2013E P/E (price divided by EPS, with an assumed transaction price for post - merger EveryWare o f $10.00 per share) divided by EPS growth from 2013E to 2014E. Non - GAAP Information EveryWare believes that these non - GAAP measures of financial results provide useful information to management and investors regarding certain financial and business trends relating to EveryWare’s financial condition and results of operations . EveryWare’s management uses these non - GAAP measures to compare the Company’s performance to that of prior periods for trend analyses, for purposes of determining management incentive compensation, and for budgeting and planning purposes . These measures are used in monthly financial reports prepared for management and EveryWare’s board of directors . EveryWare believes that the use of these non - GAAP financial measures provides an additional tool for investors to use in evaluating ongoing operating results and trends and in comparing the Company’s financial measures with other consumer products companies, many of which present similar non - GAAP financial measures to investors . Management of EveryWare does not consider these non - GAAP measures in isolation or as an alternative to financial measures determined in accordance with GAAP . The principal limitation of these non - GAAP financial measures is that they exclude significant expenses and income that are required by GAAP to be recorded in the Company’s financial statements . In addition, they are subject to inherent limitations as they reflect the exercise of judgments by management about which expenses and income are excluded or included in determining these non - GAAP financial measures . In order to compensate for these limitations, management presents non - GAAP financial measures in connection with GAAP results . You should review the Company’s audited financial statements, which will be presented in ROI’s proxy statement to be filed with the SEC and delivered to ROI’s stockholders, and not rely on any single financial measure to evaluate EveryWare’s business . Additional Information In connection with the proposed business combination between EveryWare and ROI, ROI intends to file with the SEC a preliminary proxy statement and mail a definitive proxy statement and other relevant documents to ROI stockholders . This presentation does not contain all the information that should be considered concerning the business combination . It is not intended to form the basis of any investment decision or any other decision in respect of the proposed business combination . ROI stockholders and other interested persons are advised to read, when available, the preliminary proxy statement and any amendments thereto, and the definitive proxy statement in connection with ROI’s solicitation of proxies for the special meeting to be held to approve the transactions contemplated by the proposed business combination because these materials will contain important information about EveryWare, ROI and the proposed transactions . The definitive proxy statement will be mailed to ROI stockholders as of a record date to be established for voting on the proposed transactions . Stockholders will also be able to obtain a copy of the preliminary proxy statement and definitive proxy statement once they are available, without charge, at the SEC’s website at http : //www . sec . gov, or by directing a request to ROI Acquisition Corp . , 9 West 57 th Street, Floor 26 , New York, New York 10019 , tel . ( 212 ) 825 - 0400 , Attention : Joseph A . De Perio .
3 Additional Information (continued) This presentation shall not constitute a solicitation of a proxy, consent or authorization with respect to any securities or in respect of the proposed business combination . Participants in the Solicitation ROI and its directors and officers may be deemed participants in the solicitation of proxies to ROI’s stockholders with respect to the transaction . A list of the names of those directors and officers and a description of their interests in ROI is contained in ROI’s prospectus dated February 24 , 2012 , which was filed with the SEC on February 27 , 2012 , and will also be contained in the definitive proxy statement for the proposed business combination when available .
Table of Contents ▪ Executive Summary ▪ Market Dynamics ▪ The EveryWare Story ▪ ROI / EveryWare Business Combination ▪ Appendix 4
SECTION 1 Executive Summary 5
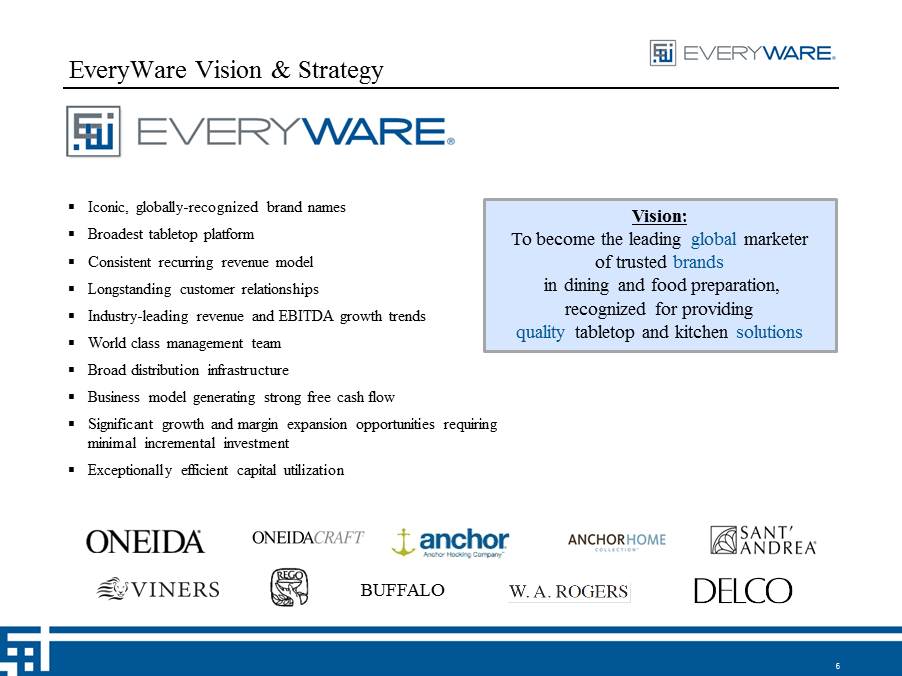
6 EveryWare Vision & Strategy ▪ Iconic, globally - recognized brand names ▪ Broadest tabletop platform ▪ Consistent recurring revenue model ▪ Longstanding customer relationships ▪ Industry - leading revenue and EBITDA growth trends ▪ World class management team ▪ Broad distribution infrastructure ▪ Business model generating strong free cash flow ▪ Significant growth and margin expansion opportunities requiring minimal incremental investment ▪ Exceptionally efficient capital utilization Vision: To become the leading global marketer of trusted brands in dining and food preparation, recognized for providing quality tabletop and kitchen solutions BUFFALO
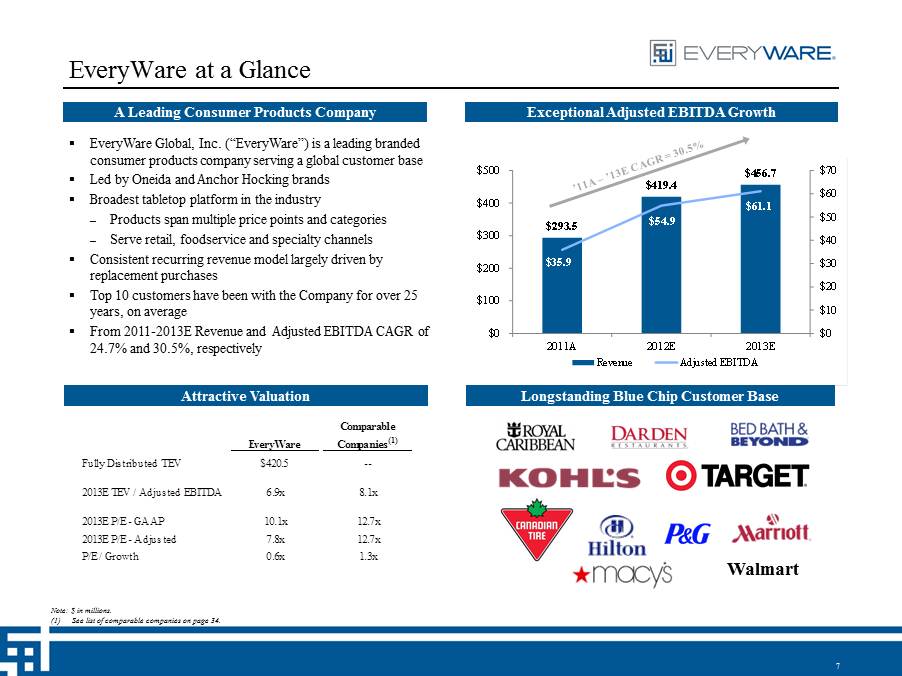
$293.5 $419.4 $456.7 $35.9 $54.9 $61.1 $0 $10 $20 $30 $40 $50 $60 $70 $0 $100 $200 $300 $400 $500 2011A 2012E 2013E Revenue Adjusted EBITDA EveryWare Comparable Companies (1) Fully Distributed TEV $420.5 -- 2013E TEV / Adjusted EBITDA 6.9x 8.1x 2013E P/E - GAAP 10.1x 12.7x 2013E P/E - Adjusted 7.8x 12.7x P/E / Growth 0.6x 1.3x 7 EveryWare at a Glance A Leading Consumer Products Company ▪ EveryWare Global, Inc. (“EveryWare ”) is a leading branded consumer products company serving a global customer base ▪ Led by Oneida and Anchor Hocking brands ▪ Broadest tabletop platform in the industry – Products span multiple price points and categories – Serve retail, foodservice and specialty channels ▪ Consistent recurring revenue model largely driven by replacement purchases ▪ Top 10 customers have been with the Company for over 25 years, on average ▪ From 2011 - 2013E Revenue and Adjusted EBITDA CAGR of 24.7% and 30.5%, respectively Exceptional Adjusted EBITDA Growth Attractive Valuation Longstanding Blue Chip Customer Base Note: $ in millions. (1) See list of comparable companies on page 34. Walmart
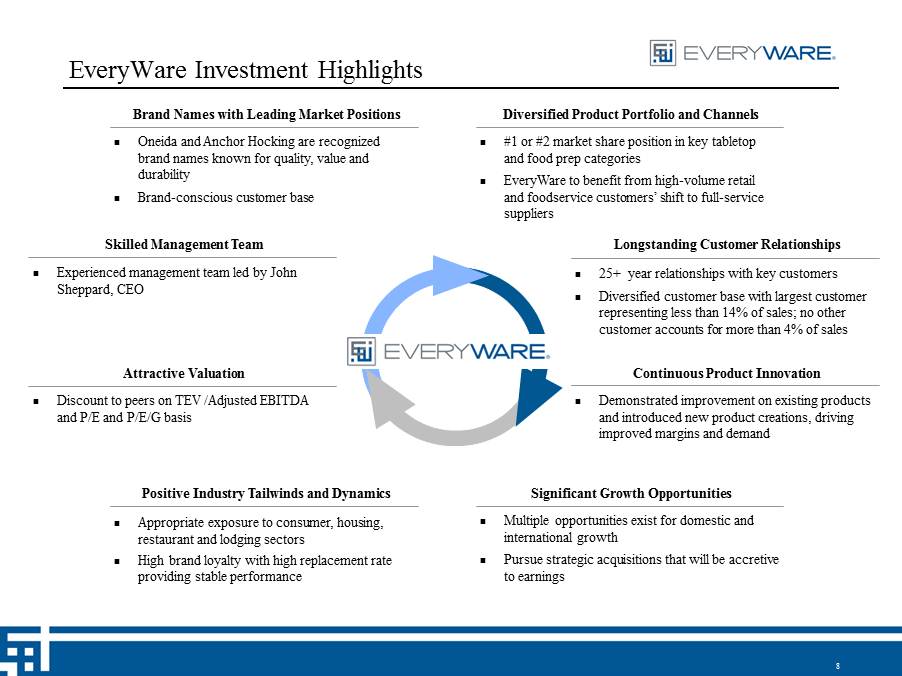
8 EveryWare Investment Highlights #1 or #2 market share position in key tabletop and food prep categories EveryWare to benefit from high - volume retail and foodservice customers’ shift to full - service suppliers Diversified Product Portfolio and Channels 25+ year relationships with key customers Diversified customer base with largest customer representing less than 14% of sales; no other customer accounts for more than 4% of sales Longstanding Customer Relationships Significant Growth Opportunities Multiple opportunities exist for domestic and international growth Pursue strategic acquisitions that will be accretive to earnings Positive Industry Tailwinds and Dynamics Appropriate exposure to consumer, housing, restaurant and lodging sectors High brand loyalty with high replacement rate providing stable performance Demonstrated improvement on existing products and introduced new product creations, driving improved margins and demand Continuous Product Innovation Skilled Management Team Experienced management team led by John Sheppard, CEO Discount to peers on TEV /Adjusted EBITDA and P/E and P/E/G basis Attractive Valuation Oneida and Anchor Hocking are recognized brand names known for quality, value and durability Brand - conscious customer base Brand Names with Leading Market Positions
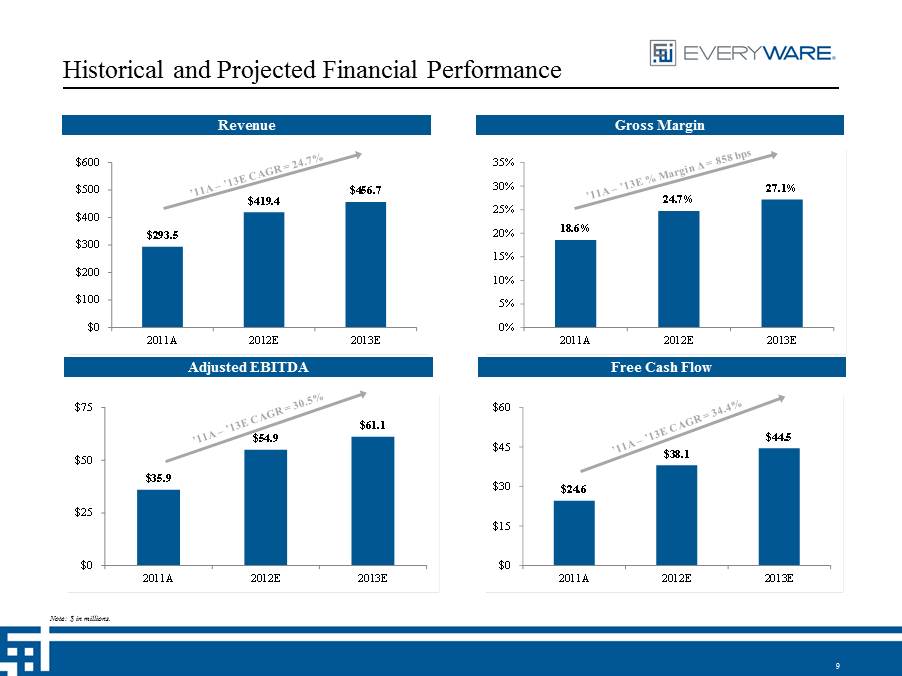
$24.6 $38.1 $44.5 $0 $15 $30 $45 $60 2011A 2012E 2013E $35.9 $54.9 $61.1 $0 $25 $50 $75 2011A 2012E 2013E 18.6% 24.7% 27.1% 0% 5% 10% 15% 20% 25% 30% 35% 2011A 2012E 2013E $293.5 $419.4 $456.7 $0 $100 $200 $300 $400 $500 $600 2011A 2012E 2013E 9 Historical and Projected Financial Performance Revenue Gross Margin Adjusted EBITDA Free Cash Flow Note: $ in millions.
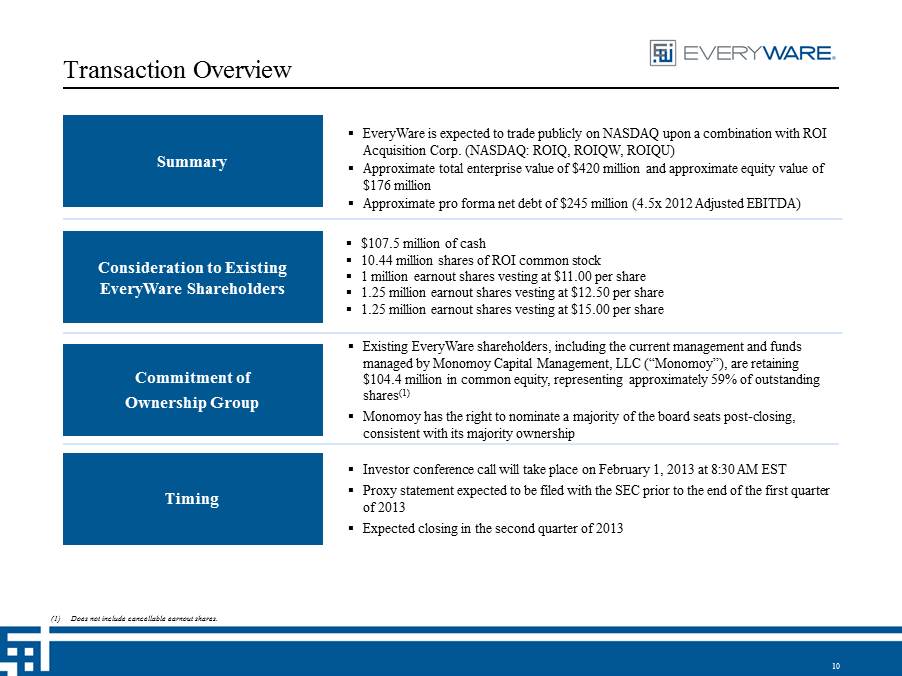
10 Transaction Overview Summary ▪ EveryWare is expected to trade publicly on NASDAQ upon a combination with ROI Acquisition Corp. (NASDAQ: ROIQ, ROIQW, ROIQU) ▪ Approximate total enterprise value of $420 million and approximate equity value of $176 million ▪ Approximate pro forma net debt of $245 million (4.5x 2012 Adjusted EBITDA) ▪ $107.5 million of cash ▪ 10.44 million shares of ROI common stock ▪ 1 million earnout shares vesting at $11.00 per share ▪ 1.25 million earnout shares vesting at $12.50 per share ▪ 1.25 million earnout shares vesting at $15.00 per share ▪ Existing EveryWare shareholders, including the current management and funds managed by Monomoy Capital Management, LLC (“Monomoy”), are retaining $104.4 million in common equity, representing approximately 59% of outstanding shares (1) ▪ Monomoy has the right to nominate a majority of the board seats post - closing, consistent with its majority ownership ▪ Investor conference call will take place on February 1, 2013 at 8:30 AM EST ▪ Proxy statement expected to be filed with the SEC prior to the end of the first quarter of 2013 ▪ Expected closing in the second quarter of 2013 Consideration to Existing EveryWare Shareholders Commitment of Ownership Group Timing (1) Does not include cancellable earnout shares.
SECTION 2 Market Dynamics 11
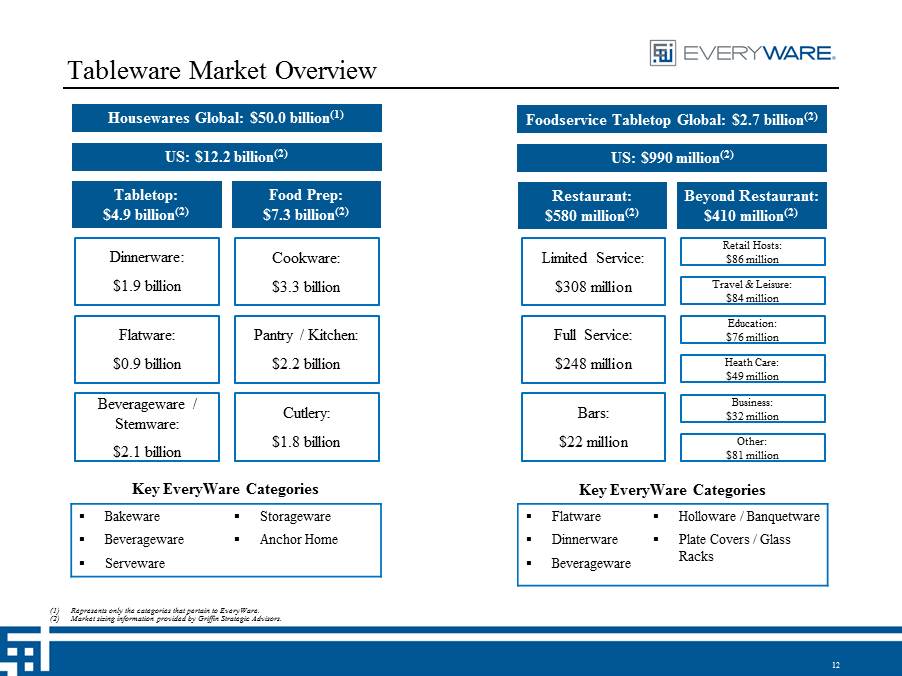
▪ Bakeware ▪ Beverageware ▪ Serveware ▪ Storageware ▪ Anchor Home Tableware Market Overview Dinnerware: $1.9 billion Flatware: $0.9 billion Beverageware / Stemware: $2.1 billion Housewares Global: $50.0 billion (1) (1) Represents only the categories that pertain to EveryWare. (2) Market sizing information provided by Griffin Strategic Advisors. 12 US: $12.2 billion (2) Tabletop: $4.9 billion (2) Food Prep: $7.3 billion (2) Cookware: $3.3 billion Pantry / Kitchen: $2.2 billion Cutlery: $1.8 billion Limited Service: $308 million Full Service: $248 million Bars: $22 million Foodservice Tabletop Global: $2.7 billion (2) US: $990 million (2) Restaurant: $580 million (2) Beyond Restaurant: $410 million (2) Retail Hosts: $86 million Travel & Leisure: $84 million Education: $76 million Heath Care: $49 million Business: $32 million Other: $81 million Key EveryWare Categories Key EveryWare Categories ▪ Flatware ▪ Dinnerware ▪ Beverageware ▪ Holloware / Banquetware ▪ Plate Covers / Glass Racks
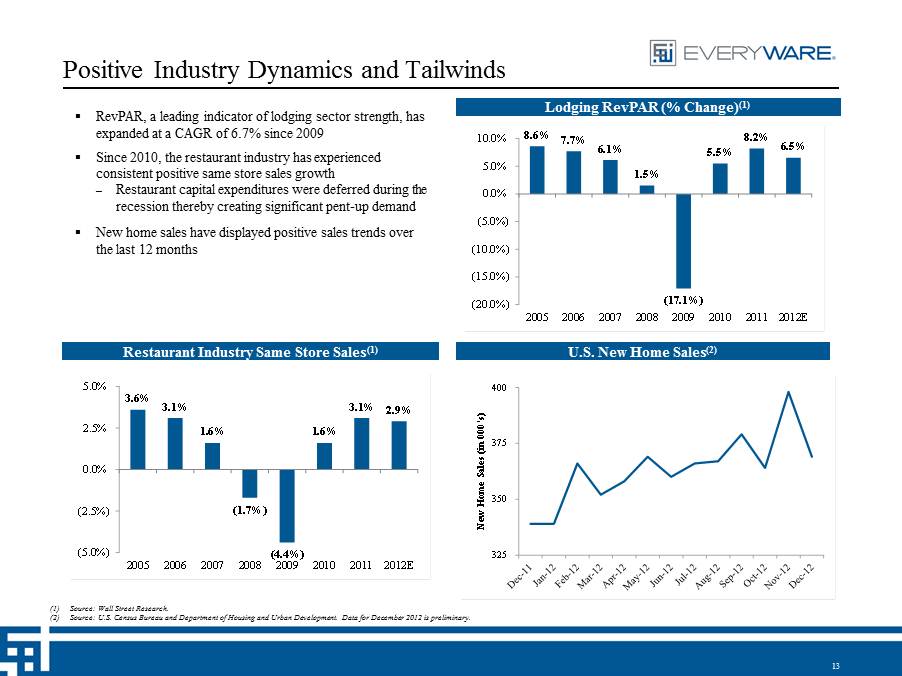
13 Positive Industry Dynamics and Tailwinds ▪ RevPAR, a leading indicator of lodging sector strength, has expanded at a CAGR of 6.7% since 2009 ▪ Since 2010, the restaurant industry has experienced consistent positive same store sales growth – Restaurant capital expenditures were deferred during the recession thereby creating significant pent - up demand ▪ New home sales have displayed positive sales trends over the last 12 months U.S. New Home Sales (2) (1) Source: Wall Street Research. (2) Source: U.S. Census Bureau and Department of Housing and Urban Development. Data for December 2012 is preliminary. 325 350 375 400 New Home Sales (in 000's) Restaurant Industry Same Store Sales (1) 3.6% 3.1% 1.6% (1.7%) (4.4%) 1.6% 3.1% 2.9% (5.0%) (2.5%) 0.0% 2.5% 5.0% 2005 2006 2007 2008 2009 2010 2011 2012E Lodging RevPAR (% Change) (1) 8.6% 7.7% 6.1% 1.5% (17.1%) 5.5% 8.2% 6.5% (20.0%) (15.0%) (10.0%) (5.0%) 0.0% 5.0% 10.0% 2005 2006 2007 2008 2009 2010 2011 2012E

SECTION 3 The EveryWare Story 14
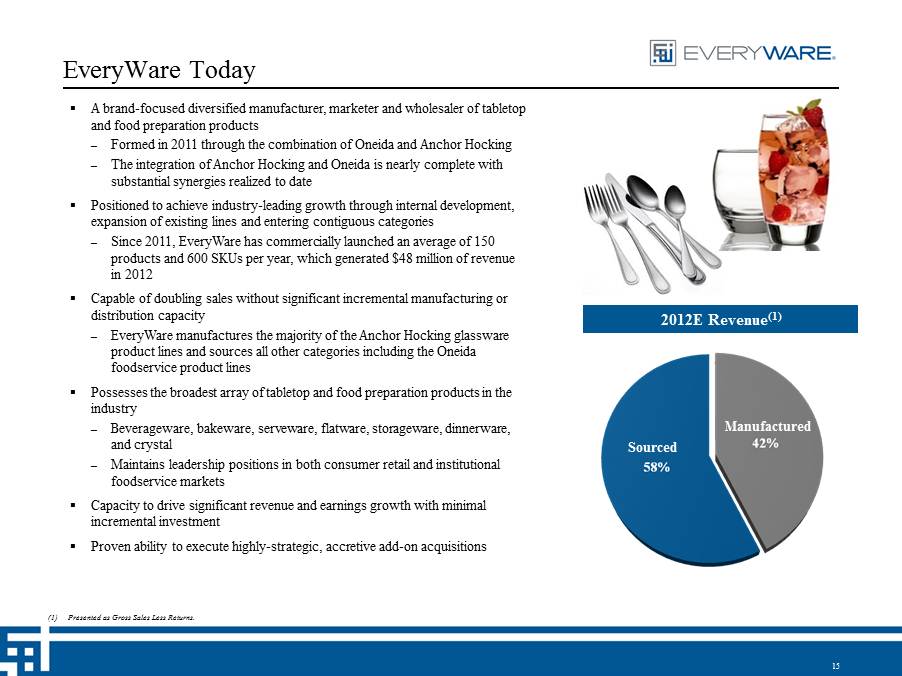
15 EveryWare Today ▪ A brand - focused diversified manufacturer, marketer and wholesaler of tabletop and food preparation products – Formed in 2011 through the combination of Oneida and Anchor Hocking – The integration of Anchor Hocking and Oneida is nearly complete with substantial synergies realized to date ▪ Positioned to achieve industry - leading growth through internal development, expansion of existing lines and entering contiguous categories – Since 2011, EveryWare has commercially launched an average of 150 products and 600 SKUs per year, which generated $48 million of revenue in 2012 ▪ Capable of doubling sales without significant incremental manufacturing or distribution capacity – EveryWare manufactures the majority of the Anchor Hocking glassware product lines and sources all other categories including the Oneida foodservice product lines ▪ Possesses the broadest array of tabletop and food preparation products in the industry – Beverageware, bakeware, serveware, flatware, storageware, dinnerware, and crystal – Maintains leadership positions in both consumer retail and institutional foodservice markets ▪ Capacity to drive significant revenue and earnings growth with minimal incremental investment ▪ Proven ability to execute highly - strategic, accretive add - on acquisitions 2012E Revenue (1) (1) Presented as Gross Sales Less Returns. Manufactured Sourced
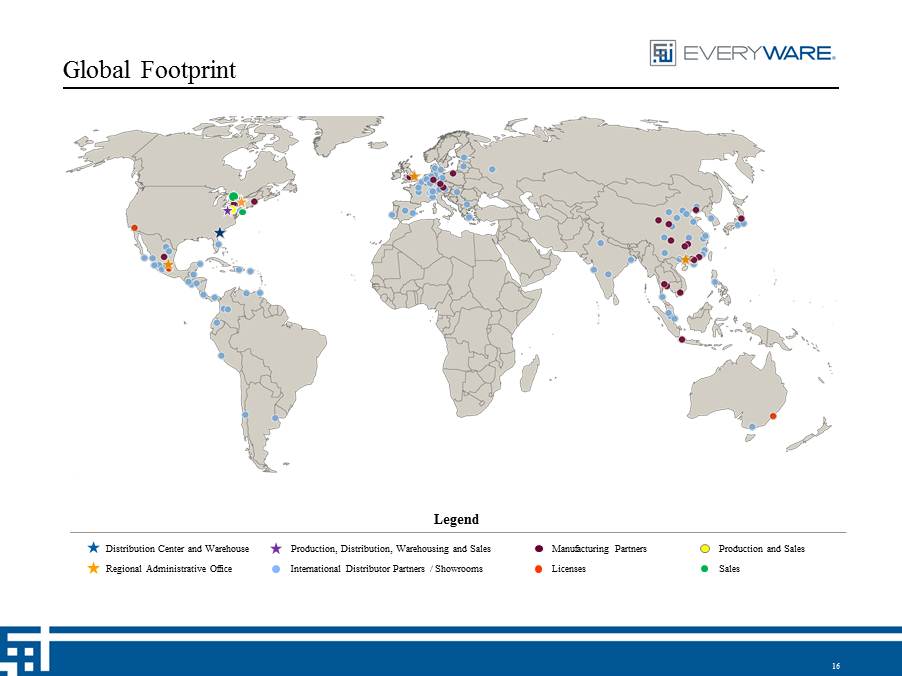
Global Footprint Legend Sales Distribution Center and Warehouse Regional Administrative Office Manufacturing Partners International Distributor Partners / Showrooms Licenses Production and Sales Production, Distribution, Warehousing and Sales Oneida’s Global Presence Manufacturing Partners Manufacturing Partners International Distributor Partners/Showrooms International Distributor Partners/Showrooms Licensees Licensees Regional Headquarters Regional Headquarters World Headquarters and US Distribution World Headquarters and US Distribution 16
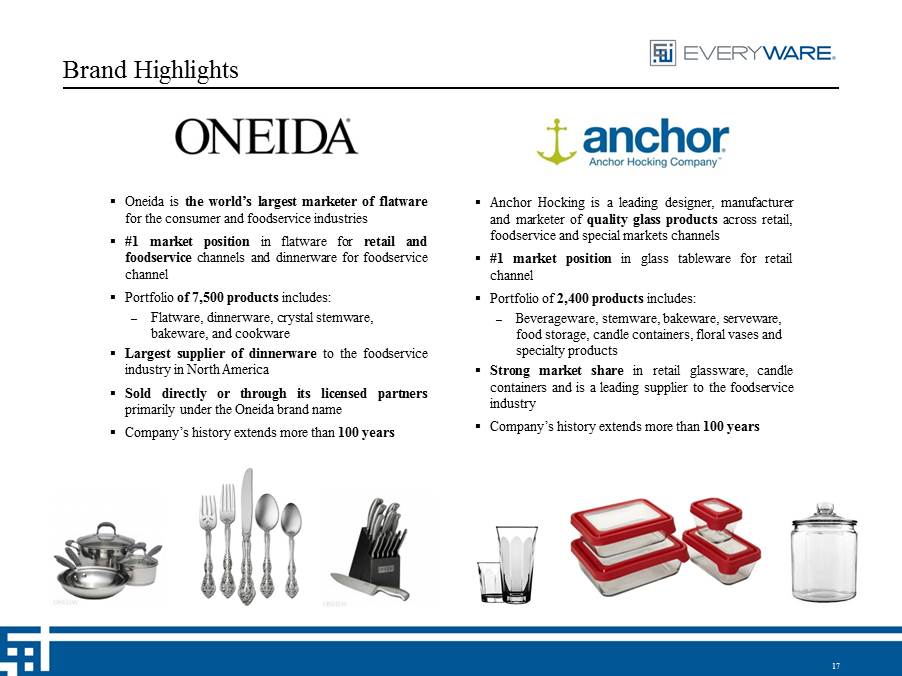
17 Brand Highlights ▪ Oneida is the world’s largest marketer of flatware for the consumer and foodservice industries ▪ # 1 market position in flatware for retail and foodservice channels and dinnerware for foodservice channel ▪ Portfolio of 7 , 500 products includes : – Flatware, dinnerware, crystal stemware, bakeware, and cookware ▪ Largest supplier of dinnerware to the foodservice industry in North America ▪ Sold directly or through its licensed partners primarily under the Oneida brand name ▪ Company’s history extends more than 100 years ▪ Anchor Hocking is a leading designer, manufacturer and marketer of quality glass products across retail, foodservice and special markets channels ▪ # 1 market position in glass tableware for retail channel ▪ Portfolio of 2 , 400 products includes : – Beverageware, stemware, bakeware, serveware, food storage, candle containers, floral vases and specialty products ▪ Strong market share in retail glassware, candle containers and is a leading supplier to the foodservice industry ▪ Company’s history extends more than 100 years
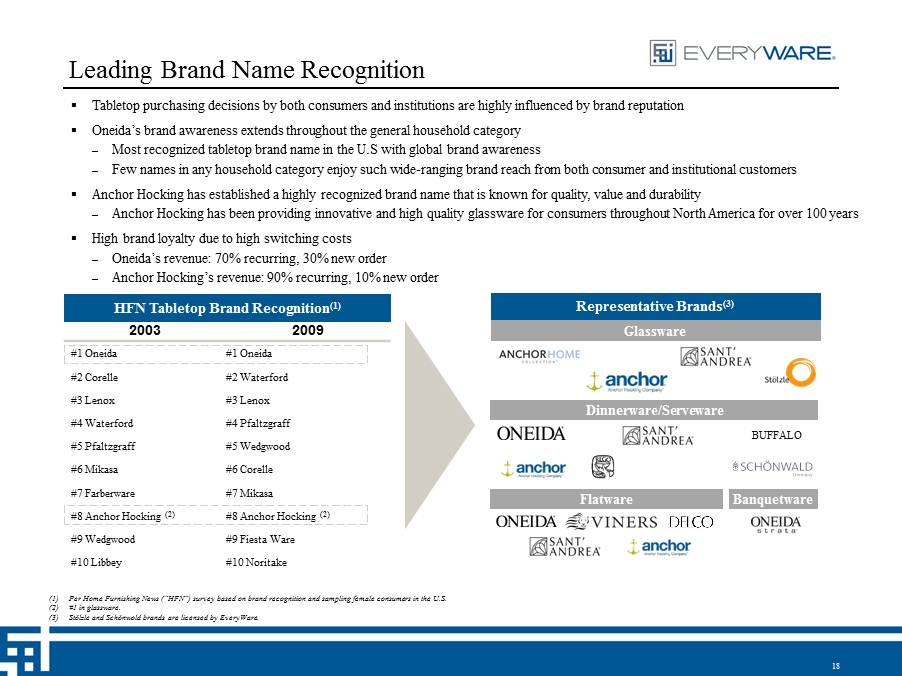
18 Leading Brand Name Recognition ▪ Tabletop purchasing decisions by both consumers and institutions are highly influenced by brand reputation ▪ Oneida’s brand awareness extends throughout the general household category – Most recognized tabletop brand name in the U.S with global brand awareness – Few names in any household category enjoy such wide - ranging brand reach from both consumer and institutional customers ▪ Anchor Hocking has established a highly recognized brand name that is known for quality, value and durability – Anchor Hocking has been providing innovative and high quality glassware for consumers throughout North America for over 100 y ear s ▪ High brand loyalty due to high switching costs – Oneida’s revenue: 70% recurring, 30% new order – Anchor Hocking’s revenue: 90% recurring, 10% new order HFN Tabletop Brand Recognition (1) 2003 2009 #1 Oneida #2 Corelle #3 Lenox #4 Waterford #5 Pfaltzgraff #6 Mikasa #7 Farberware #8 Anchor Hocking (2) #9 Wedgwood #10 Libbey #1 Oneida #2 Waterford #3 Lenox #4 Pfaltzgraff #5 Wedgwood #6 Corelle #7 Mikasa #8 Anchor Hocking (2) #9 Fiesta Ware #10 Noritake Dinnerware/Serveware Flatware Banquetware Representative Brands (3) Glassware (1) Per Home Furnishing News (“HFN”) survey based on brand recognition and sampling female consumers in the U.S. (2) #1 in glassware. (3) Stölzle and Schönwold brands are licensed by EveryWare. BUFFALO
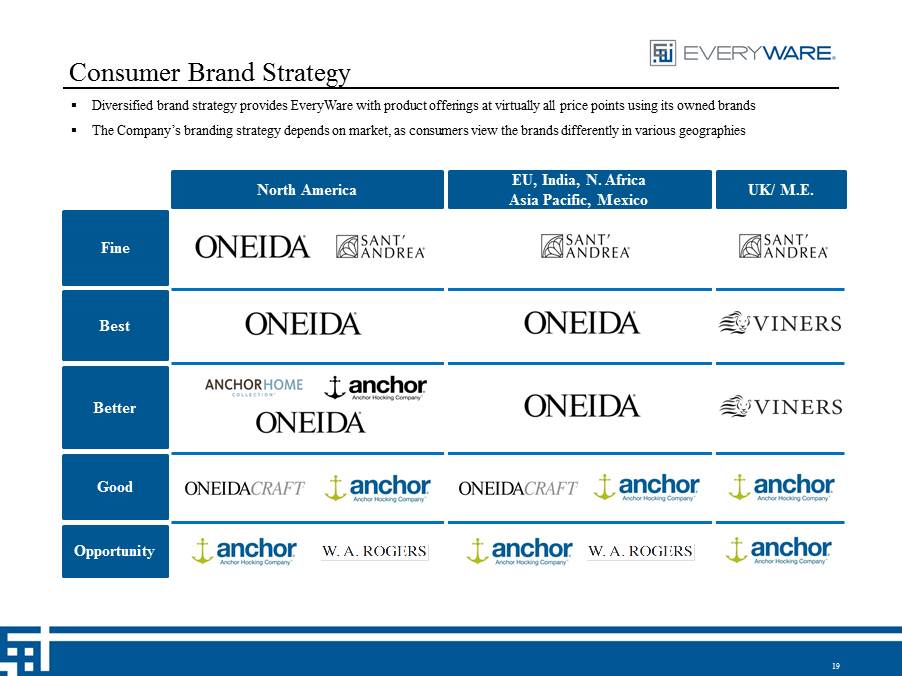
Consumer Brand Strategy Lead UK/ M.E. North America EU, India, N. Africa Asia Pacific, Mexico Best Opportunity Good Better Fine 19 ▪ Diversified brand strategy provides EveryWare with product offerings at virtually all price points using its owned brands ▪ The Company’s branding strategy depends on market, as consumers view the brands differently in various geographies
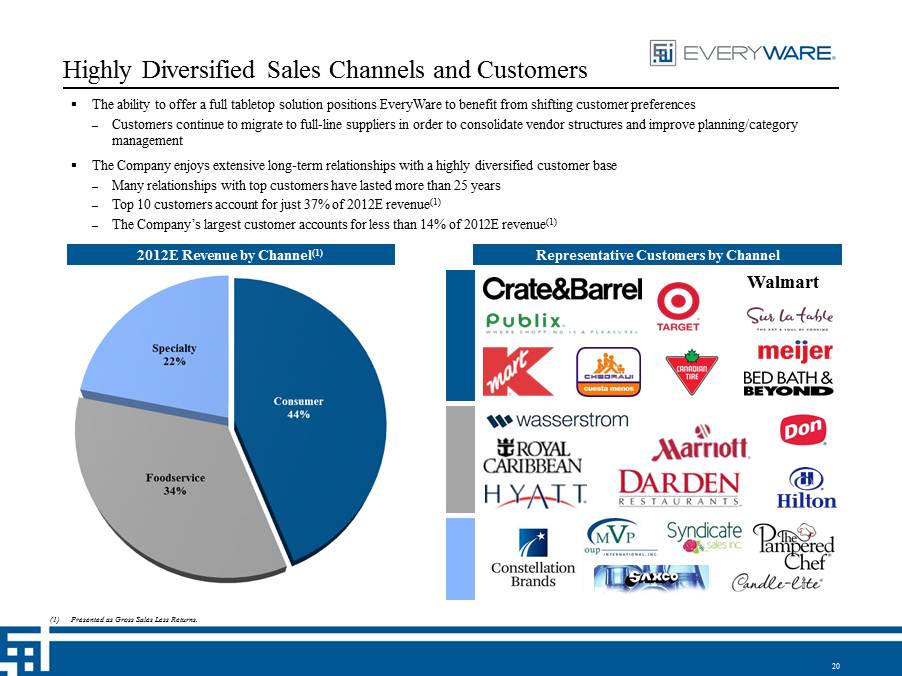
20 Highly Diversified Sales Channels and Customers ▪ The ability to offer a full tabletop solution positions EveryWare to benefit from shifting customer preferences – Customers continue to migrate to full - line suppliers in order to consolidate vendor structures and improve planning/category management ▪ The Company enjoys extensive long - term relationships with a highly diversified customer base – Many relationships with top customers have lasted more than 25 years – Top 10 customers account for just 37% of 2012E revenue (1) – The Company’s largest customer accounts for less than 14% of 2012E revenue (1) (1) Presented as Gross Sales Less Returns. 2012E Revenue by Channel (1) Representative Customers by Channel Walmart
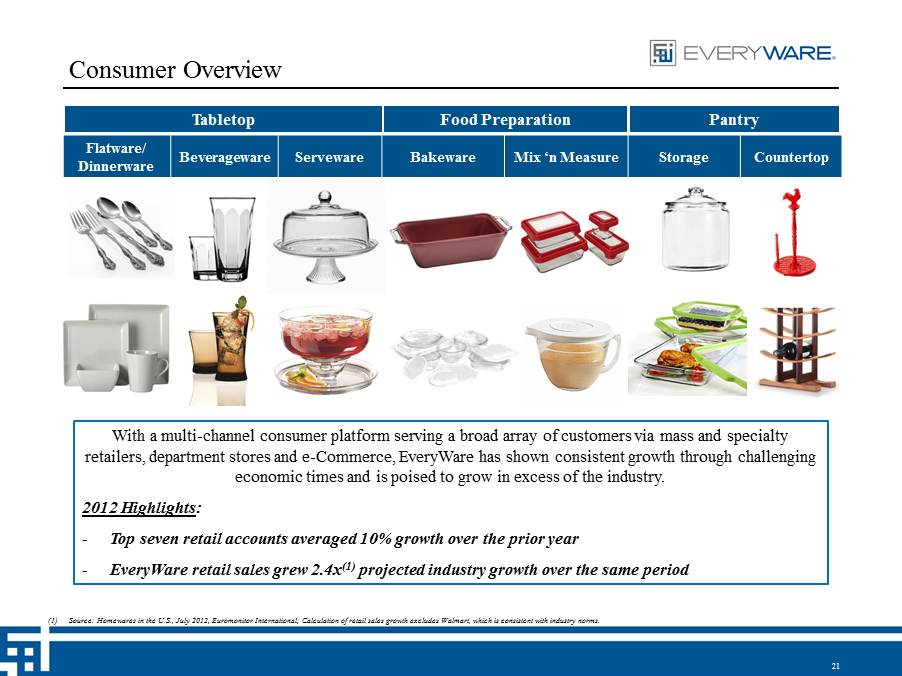
21 Consumer Overview With a multi - channel consumer platform serving a broad array of customers via mass and specialty retailers, department stores and e - Commerce, EveryWare has shown consistent growth through challenging economic times and is poised to grow in excess of the industry. 2012 Highlights : - Top seven retail accounts averaged 10% growth over the prior year - EveryWare retail sales grew 2.4x (1) projected industry growth over the same period (1) Source: Homewares in the U.S., July 2012, Euromonitor International; Calculation of retail sales growth excludes Walmart, which is consistent with industry norms. Flatware/ Dinnerware Beverageware Serveware Bakeware Mix ‘n Measure Storage Countertop Tabletop Food Preparation Pantry
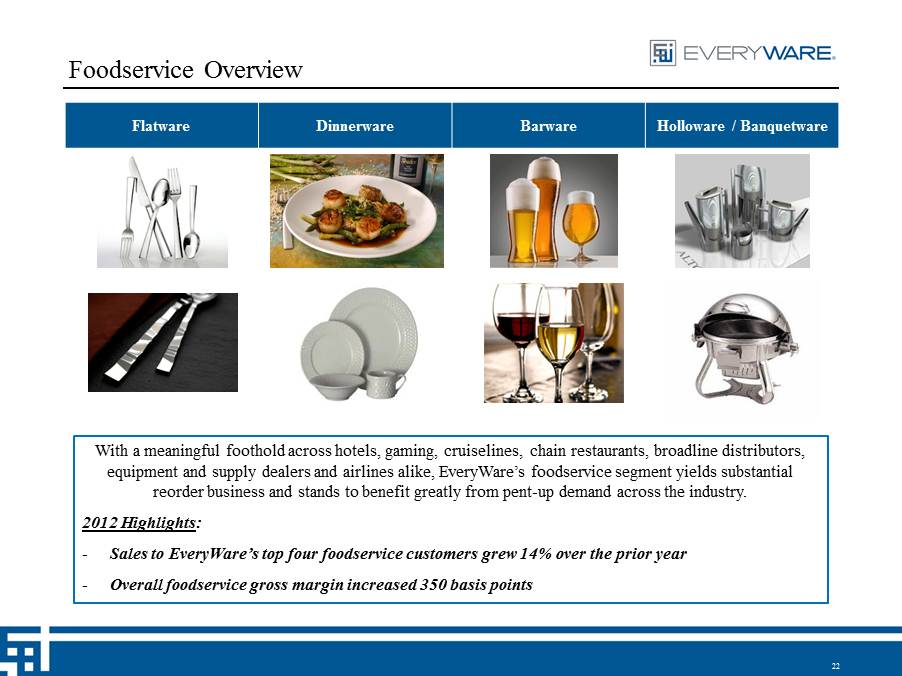
22 Foodservice Overview Flatware Dinnerware Barware Holloware / Banquetware With a meaningful foothold across hotels, gaming, cruiselines , chain restaurants, broadline distributors, equipment and supply dealers and airlines alike, EveryWare’s foodservice segment yields substantial reorder business and stands to benefit greatly from pent - up demand across the industry. 2012 Highlights : - Sales to EveryWare’s top four foodservice customers grew 14% over the prior year - Overall foodservice gross margin increased 350 basis points
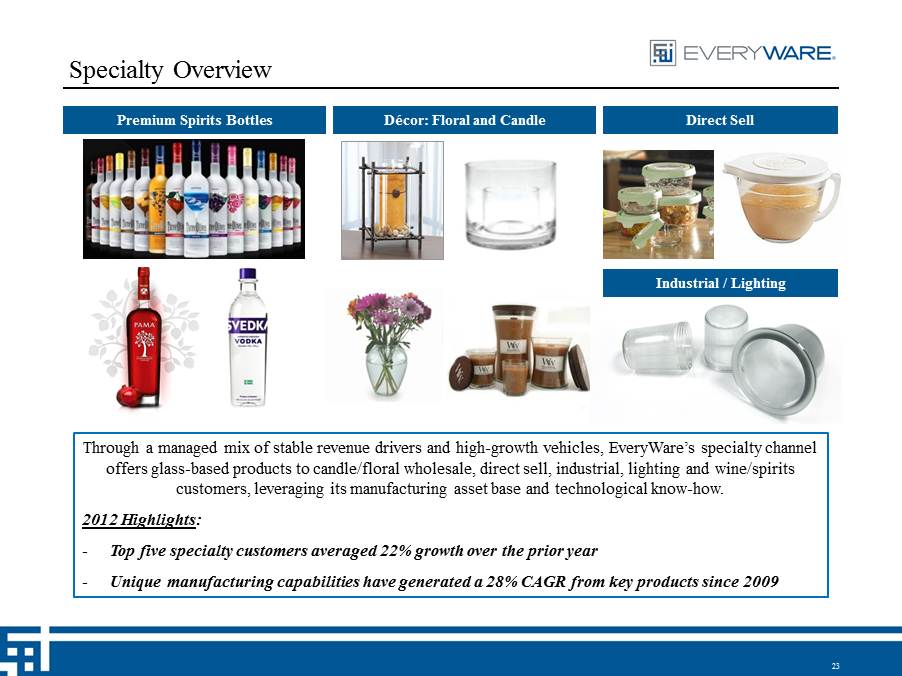
23 Specialty Overview Décor: Floral and Candle Premium Spirits Bottles Direct Sell Through a managed mix of stable revenue drivers and high - growth vehicles, EveryWare’s specialty channel offers glass - based products to candle/floral wholesale, direct sell, industrial, lighting and wine/spirits customers, leveraging its manufacturing asset base and technological know - how. 2012 Highlights : - Top five specialty customers averaged 22% growth over the prior year - Unique manufacturing capabilities have generated a 28% CAGR from key products since 2009 Industrial / Lighting
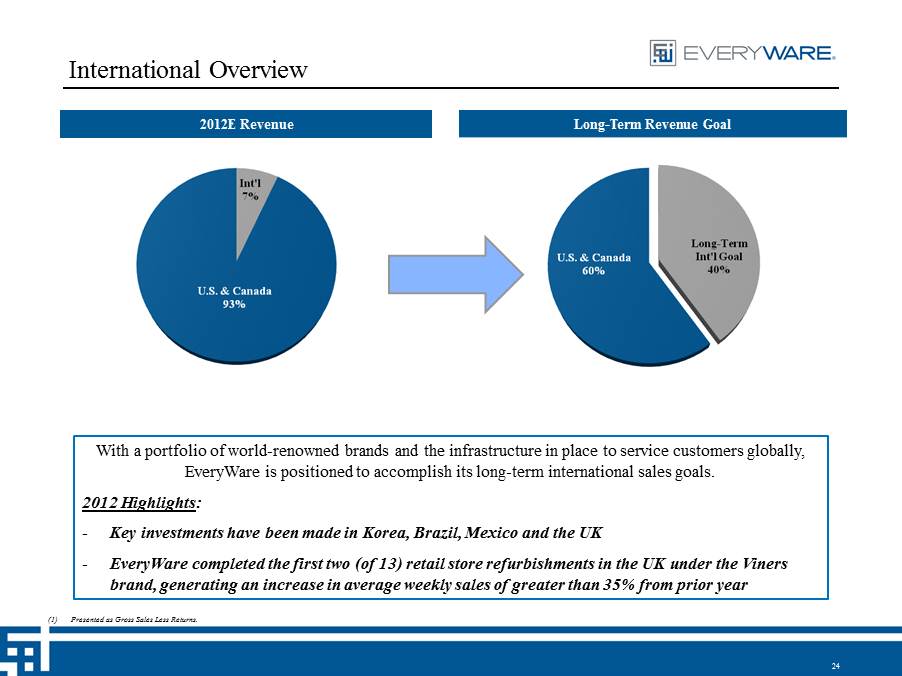
24 International Overview With a portfolio of world - renowned brands and the infrastructure in place to service customers globally, EveryWare is positioned to accomplish its long - term international sales goals. 2012 Highlights : - Key investments have been made in Korea, Brazil, Mexico and the UK - EveryWare completed the first two (of 13) retail store refurbishments in the UK under the Viners brand, generating an increase in average weekly sales of greater than 35% from prior year 2012E Revenue Long - Term Revenue Goal (1) Presented as Gross Sales Less Returns.
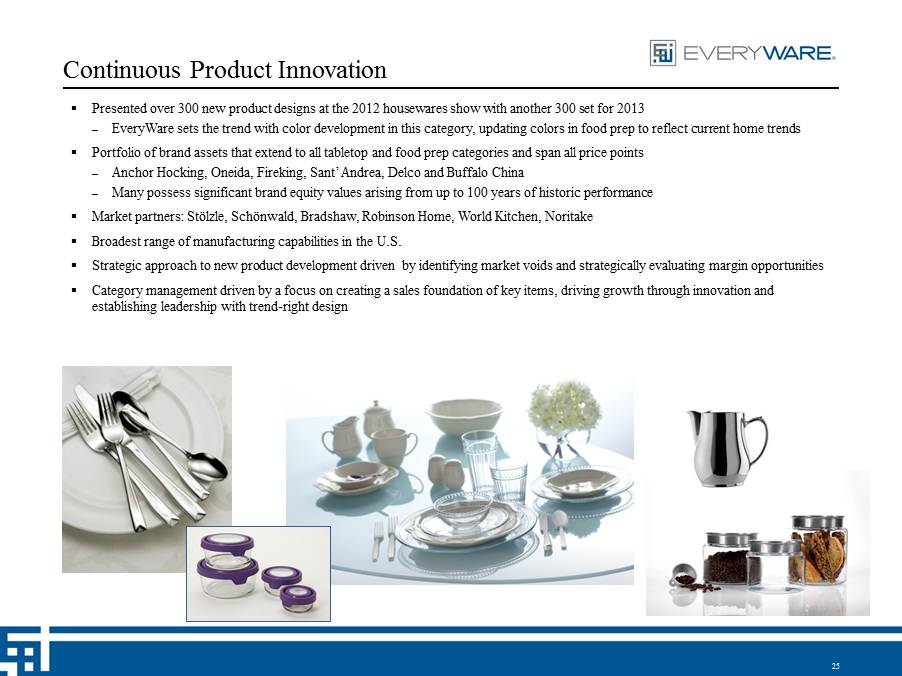
25 Continuous Product Innovation ▪ Presented over 300 new product designs at the 2012 housewares show with another 300 set for 2013 – EveryWare sets the trend with color development in this category, updating colors in food prep to reflect current home trends ▪ Portfolio of brand assets that extend to all tabletop and food prep categories and span all price points – Anchor Hocking, Oneida, Fireking, Sant’ Andrea, Delco and Buffalo China – Many possess significant brand equity values arising from up to 100 years of historic performance ▪ Market partners: Stölzle, Schönwald, Bradshaw, Robinson Home, World Kitchen, Noritake ▪ Broadest range of manufacturing capabilities in the U.S. ▪ Strategic approach to new product development driven by identifying market voids and strategically evaluating margin opportu nit ies ▪ Category management driven by a focus on creating a sales foundation of key items, driving growth through innovation and establishing leadership with trend - right design
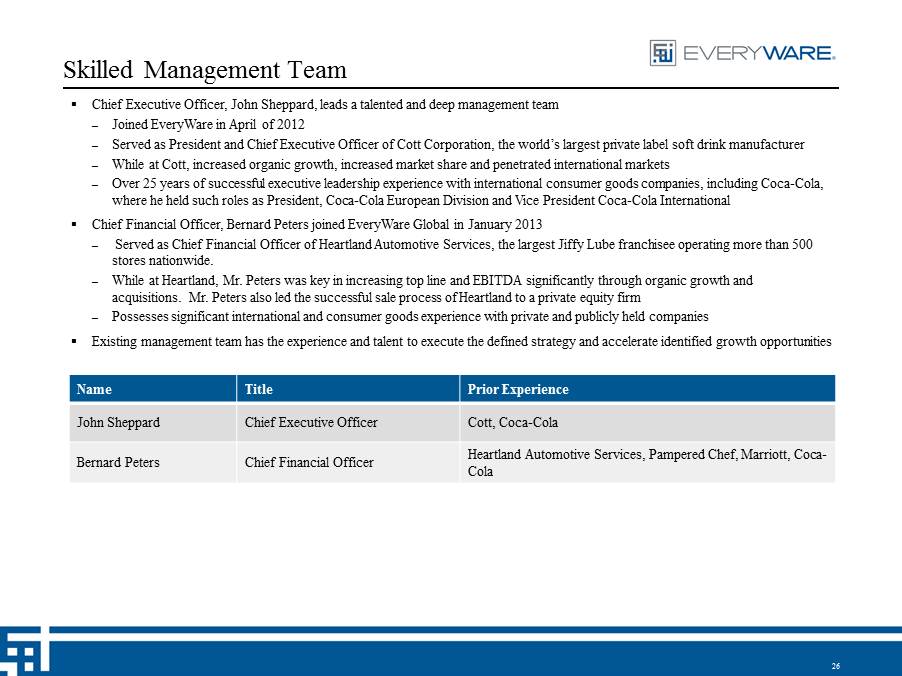
26 Skilled Management Team Name Title Prior Experience John Sheppard Chief Executive Officer Cott, Coca - Cola Bernard Peters Chief Financial Officer Heartland Automotive Services, Pampered Chef, Marriott, Coca - Cola ▪ Chief Executive Officer, John Sheppard, leads a talented and deep management team – Joined EveryWare in April of 2012 – Served as President and Chief Executive Officer of Cott Corporation, the world’s largest private label soft drink manufacture r – While at Cott, increased organic growth, increased market share and penetrated international markets – Over 25 years of successful executive leadership experience with international consumer goods companies, including Coca - Cola, where he held such roles as President, Coca - Cola European Division and Vice President Coca - Cola International ▪ Chief Financial Officer, Bernard Peters joined EveryWare Global in January 2013 – Served as Chief Financial Officer of Heartland Automotive Services, the largest Jiffy Lube franchisee operating more than 500 stores nationwide. – While at Heartland, Mr. Peters was key in increasing top line and EBITDA significantly through organic growth and acquisitions. Mr. Peters also led the successful sale process of Heartland to a private equity firm – Possesses significant international and consumer goods experience with private and publicly held companies ▪ Existing management team has the experience and talent to execute the defined strategy and accelerate identified growth oppor tun ities
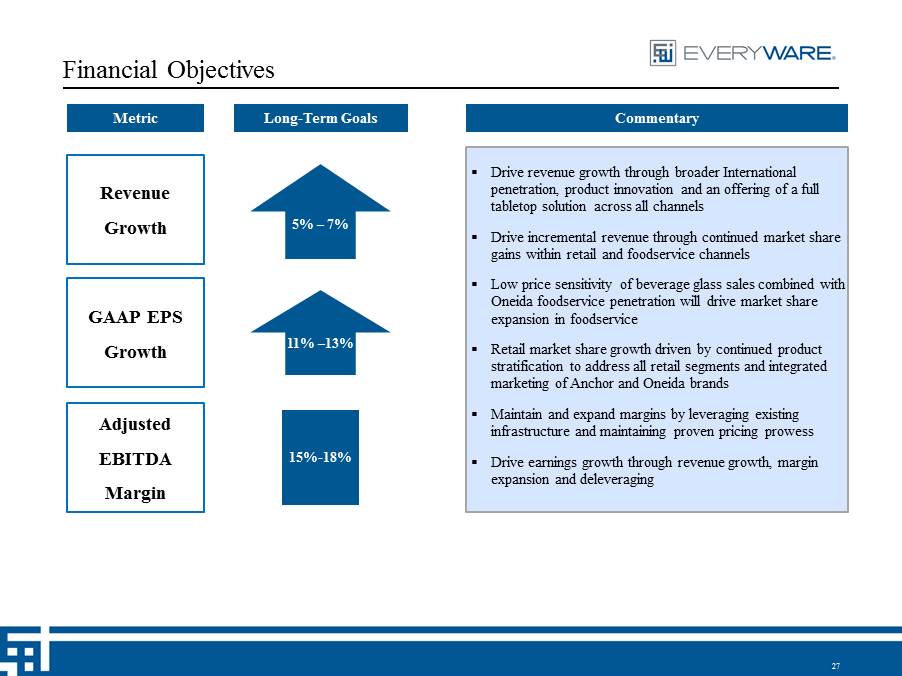
27 Financial Objectives Metric Long - Term Goals Revenue Growth GAAP EPS Growth Adjusted EBITDA Margin 5% – 7% 15% - 18% 11% – 13% Commentary ▪ Drive revenue growth through broader International penetration, product innovation and an offering of a full tabletop solution across all channels ▪ Drive incremental revenue through continued market share gains within retail and foodservice channels ▪ Low price sensitivity of beverage glass sales combined with Oneida foodservice penetration will drive market share expansion in foodservice ▪ Retail market share growth driven by continued product stratification to address all retail segments and integrated marketing of Anchor and Oneida brands ▪ Maintain and expand margins by leveraging existing infrastructure and maintaining proven pricing prowess ▪ Drive earnings growth through revenue growth, margin expansion and deleveraging
SECTION 4 ROI / EveryWare Business Combination 28
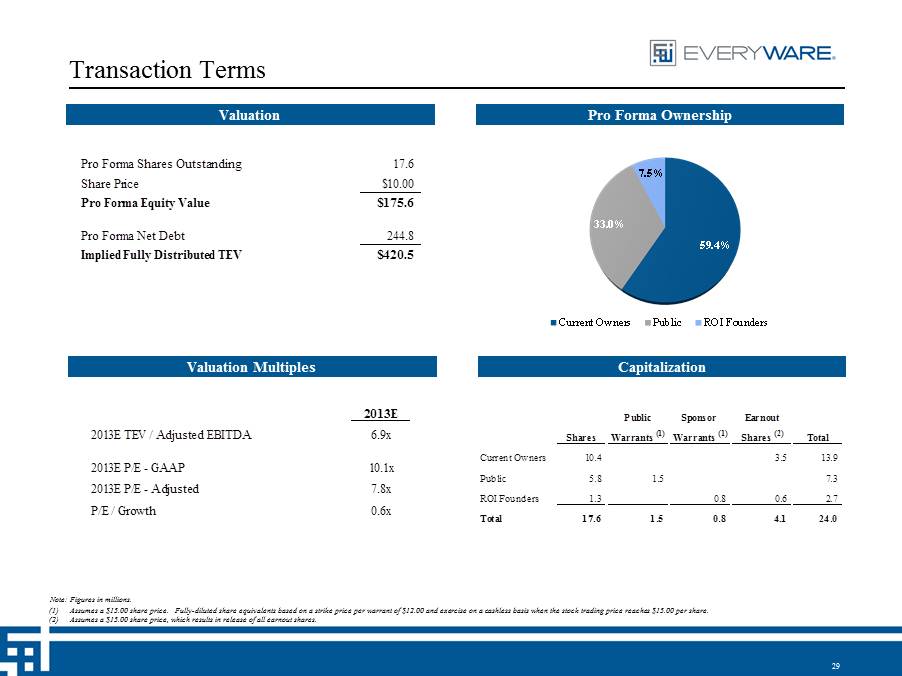
29 Transaction Terms Valuation Pro Forma Ownership (1) Assumes a $15.00 share price. Fully - diluted share equivalents based on a strike price per warrant of $12.00 and exercise on a cashless basis when the stock trading price reaches $15.00 per share. (2) Assumes a $15.00 share price, which results in release of all earnout shares. Valuation Multiples Capitalization Pro Forma Shares Outstanding 17.6 Share Price $10.00 Pro Forma Equity Value $175.6 Pro Forma Net Debt 244.8 Implied Fully Distributed TEV $420.5 2013E 2013E TEV / Adjusted EBITDA 6.9x 2013E P/E - GAAP 10.1x 2013E P/E - Adjusted 7.8x P/E / Growth 0.6x Public Sponsor Earnout Shares Warrants (1) Warrants (1) Shares (2) Total Current Owners 10.4 3.5 13.9 Public 5.8 1.5 7.3 ROI Founders 1.3 0.8 0.6 2.7 Total 17.6 1.5 0.8 4.1 24.0 59.4% 33.0% 7.5% Current Owners Public ROI Founders Note: Figures in millions.
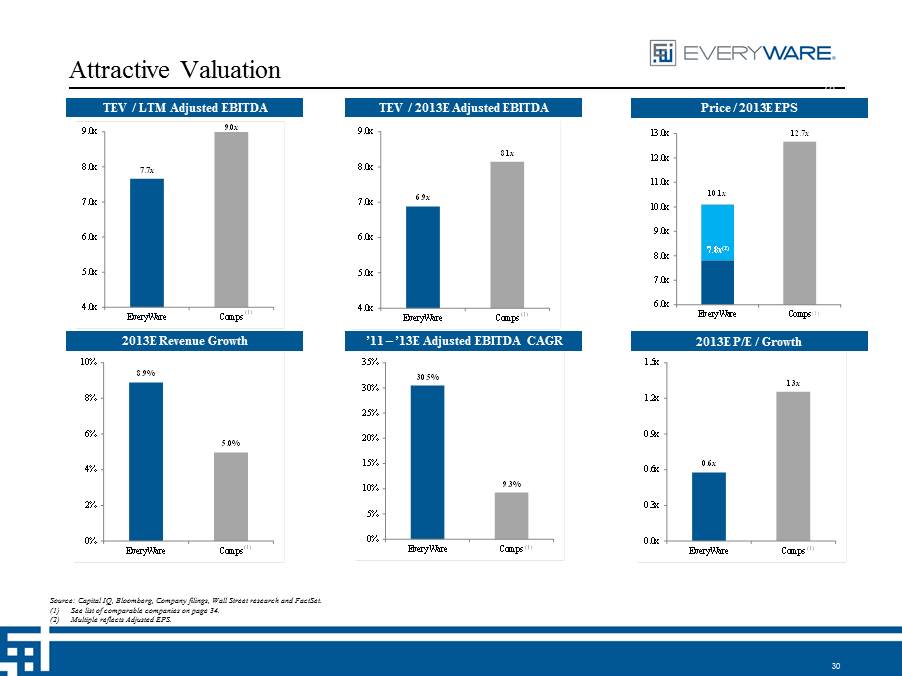
7.7x 9.0x 4.0x 5.0x 6.0x 7.0x 8.0x 9.0x EveryWare Comps (1) 30.5% 9.3% 0% 5% 10% 15% 20% 25% 30% 35% EveryWare Comps (1) 6.9x 8.1x 4.0x 5.0x 6.0x 7.0x 8.0x 9.0x EveryWare Comps (1) 8.9% 5.0% 0% 2% 4% 6% 8% 10% EveryWare Comps (1) 0.6x 1.3x 0.0x 0.3x 0.6x 0.9x 1.2x 1.5x EveryWare Comps (1) 30 Attractive Valuation Source: Capital IQ, Bloomberg, Company filings, Wall Street research and FactSet . (1) See list of comparable companies on page 34. (2) Multiple reflects Adjusted EPS. 2013E Revenue Growth (2) ’11 – ’13E Adjusted EBITDA CAGR 2013E P/E / Growth TEV / LTM Adjusted EBITDA TEV / 2013E Adjusted EBITDA Price / 2013E EPS 10.1x 12.7x 6.0x 7.0x 8.0x 9.0x 10.0x 11.0x 12.0x 13.0x EveryWare Comps 7.8x (2) (1)
Appendix 31
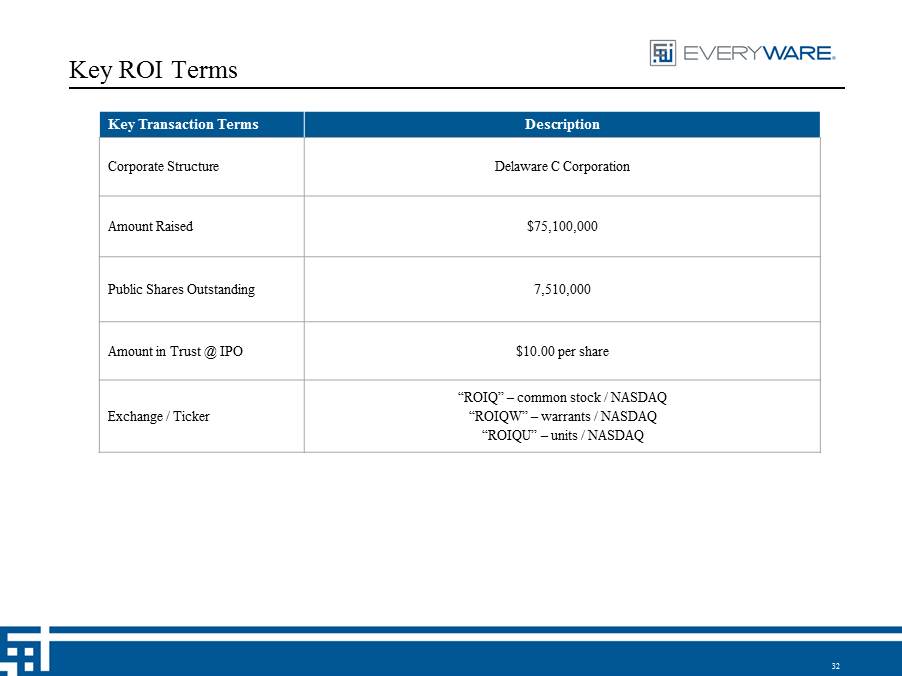
32 Key ROI Terms Key Transaction Terms Description Corporate Structure Delaware C Corporation Amount Raised $75,100,000 Public Shares Outstanding 7,510,000 Amount in Trust @ IPO $10.00 per share Exchange / Ticker “ROIQ” – common stock / NASDAQ “ROIQW” – warrants / NASDAQ “ROIQU” – units / NASDAQ
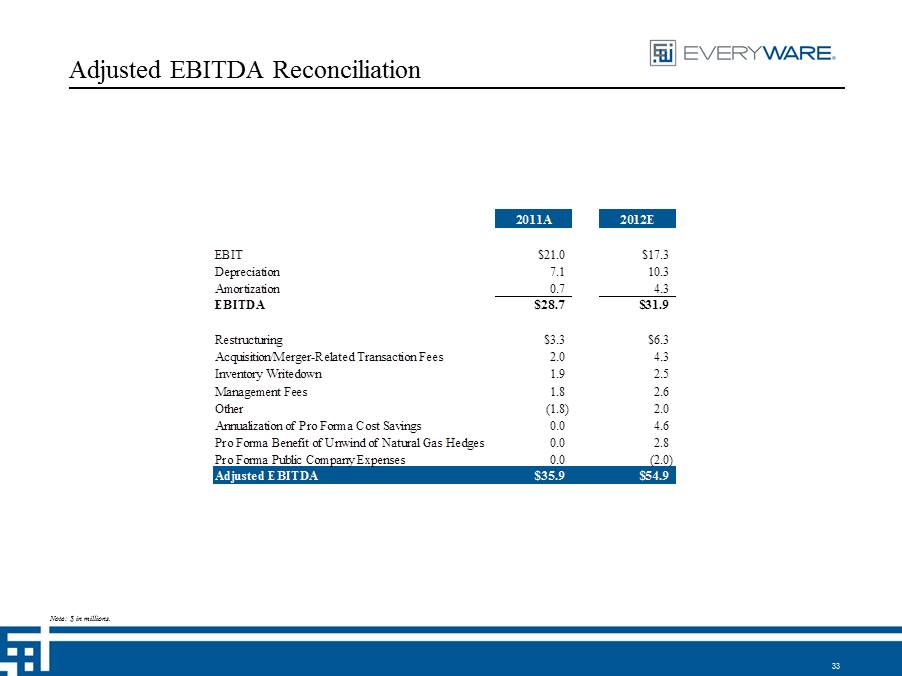
2011A 2012E EBIT $21.0 $17.3 Depreciation 7.1 10.3 Amortization 0.7 4.3 EBITDA $28.7 $31.9 Restructuring $3.3 $6.3 Acquisition/Merger-Related Transaction Fees 2.0 4.3 Inventory Writedown 1.9 2.5 Management Fees 1.8 2.6 Other (1.8) 2.0 Annualization of Pro Forma Cost Savings 0.0 4.6 Pro Forma Benefit of Unwind of Natural Gas Hedges 0.0 2.8 Pro Forma Public Company Expenses 0.0 (2.0) Adjusted EBITDA $35.9 $54.9 33 Adjusted EBITDA Reconciliation Note: $ in millions.
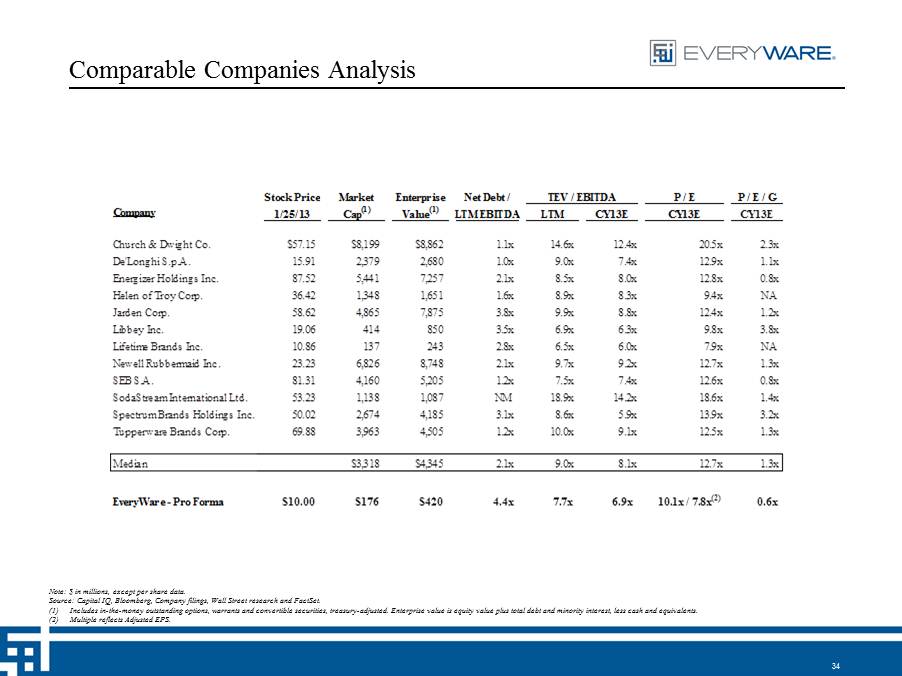
34 Comparable Companies Analysis Note: $ in millions, except per share data. Source: Capital IQ, Bloomberg, Company filings, Wall Street research and FactSet . (1) Includes in - the - money outstanding options, warrants and convertible securities, treasury - adjusted. Enterprise value is equity va lue plus total debt and minority interest, less cash and equivalents. (2) Multiple reflects Adjusted EPS. ($ millions, except per share data) Stock Price Market Enterprise Net Debt / P / E / G Company 1/25/13 Cap (1) Value (1) LTM EBITDA LTM CY13E CY13E CY13E Church & Dwight Co. $57.15 $8,199 $8,862 1.1x 14.6x 12.4x 20.5x 2.3x De'Longhi S.p.A. 15.91 2,379 2,680 1.0x 9.0x 7.4x 12.9x 1.1x Energizer Holdings Inc. 87.52 5,441 7,257 2.1x 8.5x 8.0x 12.8x 0.8x Helen of Troy Corp. 36.42 1,348 1,651 1.6x 8.9x 8.3x 9.4x NA Jarden Corp. 58.62 4,865 7,875 3.8x 9.9x 8.8x 12.4x 1.2x Libbey Inc. 19.06 414 850 3.5x 6.9x 6.3x 9.8x 3.8x Lifetime Brands Inc. 10.86 137 243 2.8x 6.5x 6.0x 7.9x NA Newell Rubbermaid Inc. 23.23 6,826 8,748 2.1x 9.7x 9.2x 12.7x 1.3x SEB S.A. 81.31 4,160 5,205 1.2x 7.5x 7.4x 12.6x 0.8x SodaStream International Ltd. 53.23 1,138 1,087 NM 18.9x 14.2x 18.6x 1.4x Spectrum Brands Holdings Inc. 50.02 2,674 4,185 3.1x 8.6x 5.9x 13.9x 3.2x Tupperware Brands Corp. 69.88 3,963 4,505 1.2x 10.0x 9.1x 12.5x 1.3x Median $3,318 $4,345 2.1x 9.0x 8.1x 12.7x 1.3x EveryWare - Pro Forma $10.00 $176 $420 4.4x 7.7x 6.9x 10.1x / 7.8x (2) 0.6x P / E TEV / EBITDA