Attached files
| file | filename |
|---|---|
| 8-K - FORM 8-K - IBERIABANK CORP | d473365d8k.htm |
| EX-99.1 - EXHIBIT 99.1 - IBERIABANK CORP | d473365dex991.htm |
 4Q12 Earnings Conference Call
Supplemental Presentation
Supplemental Presentation
January 24, 2013
January 24, 2013
Exhibit 99.2 |
| 2
Safe Harbor Language
Safe Harbor Language
To the extent that statements in this presentation and the accompanying press release relate to future
plans, objectives, financial results or performance of IBERIABANK Corporation, these statements
are deemed to be forward-looking statements within the meaning of the Private Securities
Litigation Reform Act of 1995. Such statements, which are based on management’s
current information, estimates and assumptions and the current economic environment, are
generally identified by the use of the words “plan”, “believe”, “expect”, “intend”,
“anticipate”, “estimate”, “project” or similar expressions.
IBERIABANK Corporation’s actual strategies and results in future periods may differ
materially from those currently expected due to various risks and uncertainties.
Actual results could differ materially because of factors such as the level of market volatility, our
ability to execute our growth strategy, including the availability of future FDIC-assisted
failed bank opportunities, unanticipated losses related to the integration of, and refinements
to purchase accounting adjustments for, acquired businesses and assets and assumed liabilities
in these transactions, adjustments of fair values of acquired assets and assumed liabilities
and of deferred taxes in acquisitions, credit risk of our customers, effects of the on-going
correction in residential real estate prices and reduced levels of home sales, sufficiency of our
allowance for loan losses, changes in interest rates, access to funding sources, reliance on
the services of executive management, competition for loans, deposits and investment dollars,
reputational risk and social factors, changes in government regulations and legislation,
increases in FDIC insurance assessments, geographic concentration of our markets and economic
conditions in these markets, rapid changes in the financial services industry, dependence on our
operational, technological, and organizational systems or infrastructure and those of third-party
providers of those services, hurricanes and other adverse weather events, the modest trading
volume of our common sock, and valuation of intangible assets. These and other factors
that may cause actual results to differ materially from these forward-looking statements
are discussed in the Company’s Annual Report on Form 10-K and other filings with the
Securities and Exchange Commission (the “SEC”), available at the SEC’s website,
http://www.sec.gov, and the Company’s website, http://www.iberiabank.com, under the
heading “Investor Information.” All information in this presentation and the
accompanying press release is as of the date of this release. The Company undertakes no
duty to update any forward-looking statement to conform to the statement to actual results or
changes in the Company’s expectations. Certain tabular presentations may not
reconcile because of rounding.
|
 33 Organic loan
growth: Core deposit growth:
Very modest 3-basis point net interest margin decline
Tax-equivalent revenues up $7 million, or 5% (20% annualized)
Good growth in service charge income and fee income businesses
Service
Charges
–
up
5%
compared
to
3Q12
Mortgage
–
second
highest
quarterly
production
level
in
our
history
Title
Insurance
–
second
highest
quarterly
revenue
in
past
five
years
Capital
Markets
–
good
profitability
in
fourth
quarter,
revenue
up
$1.2
million
Other influences on fourth quarter performance:
Closed/consolidated 8 branches (11 for the year)
Opened 7 branches (14 for the year)
Growth
in
excess
liquidity
–
Cash
&
Equivalents
of
$1
billion,
up
56%
Strong
asset
quality
in
our
legacy
franchise
and
capital
remains
stout
Non-operating: $2.2 million gain and $2.6 million in non-operating
expenses Introductory Comments
Introductory Comments
Fourth
Quarter
2012
–
Summary
Comments
$315 million since September 30, 2012 (+18% annualized)
$1.1 billion since year-end 2011 (+19% annualized)
$912 million since September 30, 2012 (+48% annualized)
$1.6 billion since year-end 2011 (+24% annualized)
|
 4
Financial Overview
Financial Overview
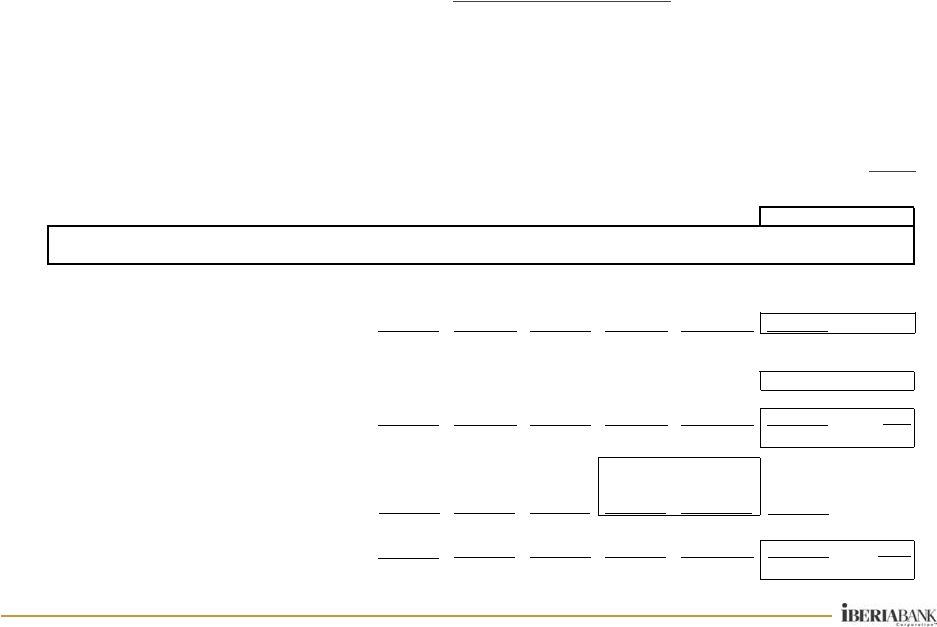
Performance Metrics –
Yields and Costs
•
Investment yield declined 13
bps due to 2.09%
•
Net covered loan yield up 13
bps as base yield improved;
offset the 3 bps decline in
non-covered loan yield
•
Interest bearing deposit
costs declined 5 bps;
continued future re-pricing
opportunities (next slide)
•
Average noninterest bearing
deposits up $155 million
(+9%)
•
Margin declined 3 basis
points to 3.55%
•
Decline due primarily to
investment portfolio roll-
down and excess liquidity
9/30/2012
12/31/2012
Investment Securities
2.22%
2.09%
(13)
bps
Covered Loans & Loss Share Receivable
5.42%
5.55%
13
bps
Noncovered Loans
4.55%
4.52%
(3)
bps
Loans & Loss Share Receivable
4.71%
4.70%
(1)
bps
Mortgage Loans Held For Sale
3.21%
2.96%
(25)
bps
Other Earning Assets
0.85%
0.61%
(24)
bps
Total Earning Assets
4.14%
4.06%
(8)
bps
Interest Bearing Deposits
0.58%
0.53%
(5)
bps
Short-Term Borrowings
0.21%
0.21%
(0)
bps
Long-Term Borrowings
3.10%
3.17%
7
bps
Total Interest Bearing Liabilities
0.69%
0.65%
(4)
bps
Net Interest Spread
3.45%
3.41%
(4)
bps
Net Interest Margin
3.58%
3.55%
(3)
bps
* Earning asset yields are shown on a fully taxable equivalent basis.
%/Basis Point
Change
For Quarter Ended: |
 5
Financial Overview
Financial Overview
Quarterly Re-pricing Schedule
•
$1.5 Billion in time deposits re-price over next 12 months at weighted average
0.74% rate •
During 4Q12, new and re-priced time deposits were booked at an average cost of
0.54% •
In 2012, retention rate of time deposits was 90% with average reduction in
rate of 46 basis points $ in millions
Note: Amounts exclude re-pricing of assets and liabilities from prior
quarters 1Q13
2Q13
3Q13
4Q13
1Q14
Cash Equivalents
Balance
771.9
$
-
$
-
$
-
$
-
$
Rate
0.46%
0.00%
0.00%
0.00%
0.00%
Investments
Balance
112.0
$
139.7
$
109.1
$
118.5
$
93.1
$
Rate
3.15%
2.56%
2.99%
2.70%
2.79%
Loans
Balance
4,164.7
$
425.6
$
378.2
$
321.4
$
276.7
$
Rate
3.68%
5.20%
5.11%
4.98%
4.41%
Time Deposits
Balance
450.8
$
425.9
$
368.3
$
292.8
$
144.8
$
Rate
0.73%
0.63%
0.75%
0.91%
1.32%
Borrowed Funds
Balance
437.1
$
37.7
$
2.3
$
1.0
$
0.5
$
Rate
1.17%
3.44%
4.48%
4.28%
3.72% |
 6
Financial Overview
Financial Overview
Interest Rate Risk Simulations
Source: Bancware model, as of December 31, 2012
* Assumes instantaneous and parallel shift in interest rates based on static
balance sheet •
Asset sensitive from an interest rate risk position
•
The degree of asset sensitivity is a function of the reaction of
competitors to changes in deposit pricing
•
Forward curve has a positive impact over 12 months
Base
Blue
Forward
Change In:
-200 bp*
-100 bp*
Case
+100 bp*
+200 bp*
Chip
Curve
Net Interest
Income
-1.7%
-0.8%
0.0%
3.8%
7.9%
-0.1%
0.6%
Economic
Value of
Equity
-9.4%
-9.2%
0.0%
8.5%
13.6%
-0.2%
-0.4% |
 7
Financial Overview
Financial Overview
Performance Metrics –
Quarterly Trends
•
Relatively stable
margin
•
Average earning
assets up $480
million (+4%)
•
T/E net interest
income up $3
million (+3%)
•
Provision of $5
million:
•
Net charge-offs:
$0.1 million (0.00%
annualized rate)
•
Covered and
acquired impaired
loan provision:
$4.5 million
•
All other provision
expense: $0.4
million
Legacy asset quality measures generally improved in 4Q12
Strong capital position compared to peers
Repurchased no shares in 4Q12; 46,692 shares remain under current
authorized program
12/31/2011
3/31/2012
6/30/2012
9/30/2012
12/31/2012
Net Income ($ in thousands)
17,357
$
19,393
$
12,560
$
21,234
$
23,208
$
9%
Per Share Data:
Fully Diluted Earnings
0.59
$
0.66
$
0.43
$
0.73
$
0.79
$
8%
Operating Earnings (Non-GAAP)
0.67
0.69
0.54
0.83
0.80
-4%
Pre-provision Operating Earnings (Non-GAAP)
0.77
0.68
0.73
0.92
0.91
-2%
Tangible Book Value
36.80
37.23
37.28
37.07
37.34
1%
Key Ratios:
Return on Average Assets
0.59%
0.67%
0.43%
0.69%
0.73%
4
bps
Return on Average Common Equity
4.65%
5.21%
3.36%
5.56%
6.02%
46
bps
Return on Average Tangible Common Equity (Non-GAAP)
6.72%
7.43%
4.86%
7.91%
8.62%
71
bps
Net Interest Margin (TE)*
3.62%
3.59%
3.59%
3.58%
3.55%
(3)
bps
Tangible Efficiency Ratio (TE)* (Non-GAAP)
75.2%
74.6%
78.2%
74.3%
73.2%
(110)
bps
Tangible Common Equity Ratio (Non-GAAP)
9.52%
9.64%
9.37%
9.01%
8.66%
(35)
bps
Tier 1 Leverage Ratio
10.45%
10.51%
10.42%
10.01%
9.70%
(31)
bps
Tier 1 Common Ratio (Non-GAAP)
13.55%
13.48%
12.97%
12.04%
11.74%
(30)
bps
Total Risk Based Capital Ratio
16.21%
16.10%
15.54%
14.54%
14.19%
(35)
bps
Net Charge-Offs to Average Loans**
0.31%
0.09%
0.07%
0.11%
0.01%
(10)
bps
Nonperforming Assets to Total Assets**
0.86%
0.83%
0.84%
0.81%
0.85%
4
bps
* Fully taxable equivalent basis.
** Excluding FDIC Covered Assets and acquired impaired loans.
%/Basis Point
Change
For Quarter Ended: |
 8
Financial Overview
Financial Overview
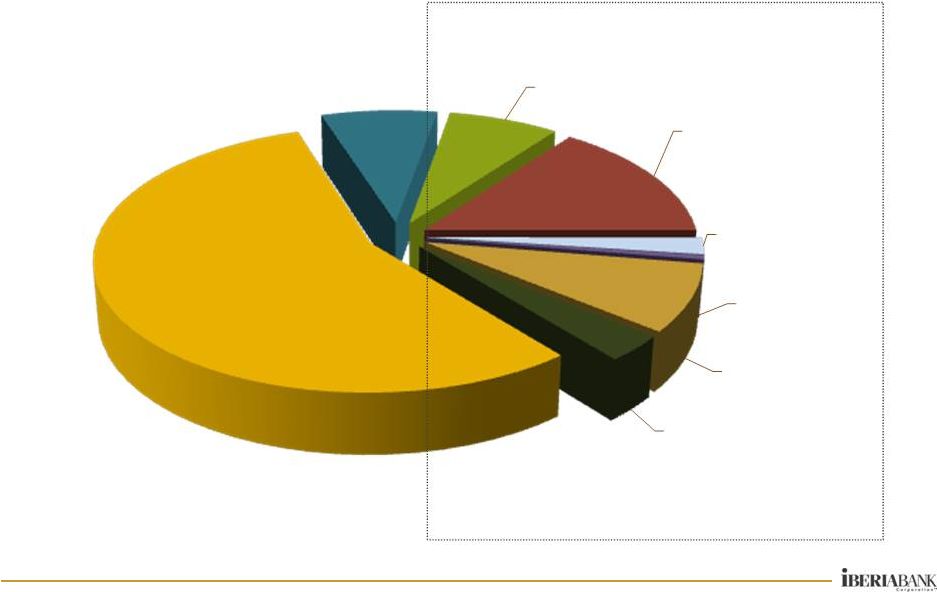
Low Risk Balance Sheet At December 31, 2012
36% Of Balance Sheet In Very Low Risk Components
8
Cash and
Equivalents,
7%
Investment
Securities,
15%
Mortgage
Loans Held
For Sale, 2%
Acquired
Loans
-
Fair
Value, 0.5%
Loans
-
FDIC
Covered, 8%
FDIC Loss
Share
Receivable,
3%
Loans -
Noncovered,
56%
Other Assets,
8% |
 9
Financial Overview
Financial Overview
Non-Interest Income Trends
Strong mortgage loan income continued in 4Q12
IBERIA Capital Partners revenues up $1.2 million
Continued rebound in service charge income (+5%)
Title insurance revenue continued to be solid
$2.2 million OMNI investment redemption gain
Total originations of $2.4 billion in
2012 (+46%)
4Q12 originations down 4%
Sales down 7% and 2012 total up
45% over 2011
$78 million annual revenues (up
73%); 4Q12 revenues down 1%
Small buyback costs
Pipeline of $241 million at year-end
and $256 million on January 11th
$21 million annual revenues (+16%)
Profitability up 12-fold over 2011
4Q12 revenues down 2%
Noninterest Income ($000s)
4Q11
1Q12
2Q12
3Q12
4Q12
$ Change
% Change
Service Charges on Deposit Accounts
6,613
$
5,980
$
6,625
$
6,952
$
7,295
$
343
$
5%
ATM / Debit Card Fee Income
1,997
2,024
2,166
2,377
2,412
35
$
1%
BOLI Proceeds and CSV Income
899
951
905
916
909
(7)
$
-1%
Mortgage Income
13,274
13,718
18,185
23,215
22,935
(280)
$
-1%
Gain (Loss) on Sale of Investments, Net
793
2,836
901
41
(4)
(45)
$
-110%
Title Revenue
4,846
4,533
5,339
5,623
5,492
(131)
$
-2%
Broker Commissions (includes Capital Markets)
2,457
3,060
3,102
3,092
4,192
1,100
$
36%
Other Noninterest Income
4,576
4,294
4,471
4,337
4,928
591
$
14%
Noninterest income excluding non-operating income
35,455
37,396
41,694
46,553
48,158
1,605
$
3%
Non-operating income
-
-
-
-
2,196
2,196
$
100%
Total Noninterest Income
35,455
$
37,396
$
41,694
$
46,553
$
50,354
$
3,801
$
8%
4Q12 vs. 3Q12 |
 10
Financial Overview
Financial Overview
Non-Interest Expense
•
Total expenses up $4 million, or 3%, in
4Q12
•
Merger-related costs of $1.2 million (-60%)
•
Other non-operating expenses of $1.4
million (down 10% compared to 3Q12 of
$1.6 million)
Linked
Quarter
increases
of:
Multiple loan and deposit campaigns
1.2
$
mil.
Business development
0.7
Seasonal property tax expense
0.4
FDIC insurance
0.4
Salary
expense
-
added
Houston
producers
0.4
Health care expense
0.3
Extra month of Florida Gulf salaries & occupancy
0.4
3.8
$
mil.
Noninterest Expense ($000s)
4Q11
1Q12
2Q12
3Q12
4Q12
$ Change
% Change
Mortgage Commissions
3,922
$
3,229
$
5,612
$
6,006
$
5,747
$
(259)
$
-4%
Hospitalization Expense
3,349
3,817
3,404
3,773
4,005
232
6%
Other Salaries and Benefits
44,039
47,522
48,011
49,270
50,675
1,405
3%
Salaries and Employee Benefits
51,310
$
54,568
$
57,028
$
59,049
$
60,426
$
1,377
$
2%
Credit/Loan Related
4,094
4,027
4,835
4,846
4,386
(460)
-9%
Occupancy and Equipment
12,498
12,677
12,852
13,500
14,413
914
7%
Amortization of Acquisition Intangibles
1,384
1,290
1,289
1,287
1,285
(2)
0%
All Other Noninterest Expense
25,987
26,373
27,105
26,611
30,328
3,717
14%
Nonint. Exp. (Ex-Non-Operating Exp.)
95,272
$
98,935
$
103,109
$
105,293
$
110,838
$
5,544
$
5%
Severance
206
219
1,053
712
370
(341)
$
-48%
Occupancy and Branch Closure Costs
-
-
2,743
284
711
427
150%
Consulting and Professional
193
220
1,661
574
339
(235)
-41%
Nonint. Exp. excluding Merger-Related
95,671
$
99,374
$
108,566
$
106,864
$
112,258
$
5,395
$
5%
Merger-Related Expenses
4,055
$
500
$
456
$
2,985
$
1,183
$
(1,802)
$
-60%
Total Noninterest Expense
99,726
$
99,873
$
109,022
$
109,848
$
113,441
$
3,592
$
3%
Tangible
Efficiency
Ratio
-
excluding
Non-op.
Exp.
72.2%
75.5%
74.4%
71.2%
72.5%
4Q12 vs. 3Q12 |
 11
Financial Overview
Financial Overview
Non-Operating Items –
4Q12
Acquisition and conversion-related costs of $1.2 million in 4Q12 ($0.03 EPS)
4Q12 Other non-operating expenses of $1.4 million ($0.03 EPS)
4Q12 Covered and acquired impaired loan provision of $4.5 million ($0.10
EPS),
all
other
provision
expense
equated
to
$0.4
million
($0.01
EPS)
Pre-tax
After-tax
Per share
Pre-tax
After-tax
Per share
Pre-tax
After-tax
Per share
Net Income (GAAP)
24,024
$
17,357
$
0.59
$
29,378
$
21,234
$
0.73
$
32,037
$
23,208
$
0.79
$
Merger-related expenses
4,055
2,636
0.09
2,985
1,940
0.07
1,183
769
0.03
Severance expenses
206
134
0.00
712
463
0.02
370
241
0.01
Occupancy expenses and branch closure expenses
-
-
-
284
185
0.01
711
462
0.02
Professional expenses and litigation settlements
193
125
0.00
574
373
0.01
339
220
0.01
Other noninterest income
-
-
-
-
-
-
(2,196)
(1,427)
(0.05)
Loss (Gain) on sale of investments
(793)
(515)
(0.02)
(41)
(27)
(0.00)
4
3
-
Operating earnings (Non-GAAP)
27,685
19,737
0.67
33,892
24,168
0.83
32,448
23,476
0.80
Covered and acquired impaired loan provision for credit losses
1,659
1,078
0.04
2,318
1,507
0.05
4,504
2,928
0.10
Other provision for credit losses
2,620
1,703
0.06
1,735
1,128
0.04
362
235
0.01
Pre-provision operating earnings (Non-GAAP)
31,964
$
22,518
$
0.77
$
37,945
$
26,802
$
0.92
$
37,314
$
26,639
$
0.91
$
(1) Per share amounts may not appear to foot due to rounding
(dollars in thousands)
For The Quarter Ended
December 31, 2011
September 30, 2012
December 31, 2012
Dollar Amount
Dollar Amount
Dollar Amount
(1)
RECONCILIATION OF NON-GAAP FINANCIAL MEASURES |
 12
•
Improve long-term operating efficiency, risk-
adjusted profitability, and long-term growth
prospects of franchise
Long-Term Initiatives
Long-Term Initiatives
Update
3Q12 cost of $1.3
million, or $0.03 EPS
4Q12 cost of $1.4
million, or $0.03 EPS
Benefit of $6 million
annually, or $0.13 EPS
Acquisition and
conversion related
costs of $1.2 million
pre-tax in 4Q12
Acquisition and
conversion related
costs are expected to
be immaterial in 1Q13
$ in millions
Expenses
2Q12
3Q12
4Q12
1Q13
Total
Branch Closure Cost - Phase 1
2.7
$
0.3
$
0.7
$
-
$
3.7
$
Branch Closure Cost - Phase 2
0.5
0.5
$
Severance Expense - Phase 1
1.0
0.4
0.3
-
1.7
$
Severance Expense - Phase 2
0.1
0.1
0.2
$
Professional Services
1.7
0.6
0.3
0.1
2.7
Total Expense
5.4
$
1.3
$
1.4
$
0.7
$
8.8
$
Benefits
2Q12
3Q12
4Q12
1Q13
Full Year
2013
Facilities Expense - Phase 1
0.0
$
0.2
$
0.2
$
0.9
$
Salary and Benefits - Phase 1
0.4
0.7
0.6
2.5
Facilities Expense - Phase 2
0.4
Salary and Benefits - Phase 2
0.3
Other
0.7
0.8
0.4
1.8
Total Benefits
1.1
$
1.6
$
1.2
$
5.9
$
2Q12
3Q12
4Q12
1Q13
Total
Merger Related Expenses
0.5
$
3.0
$
1.2
$
-
$
4.7
$ |
 13
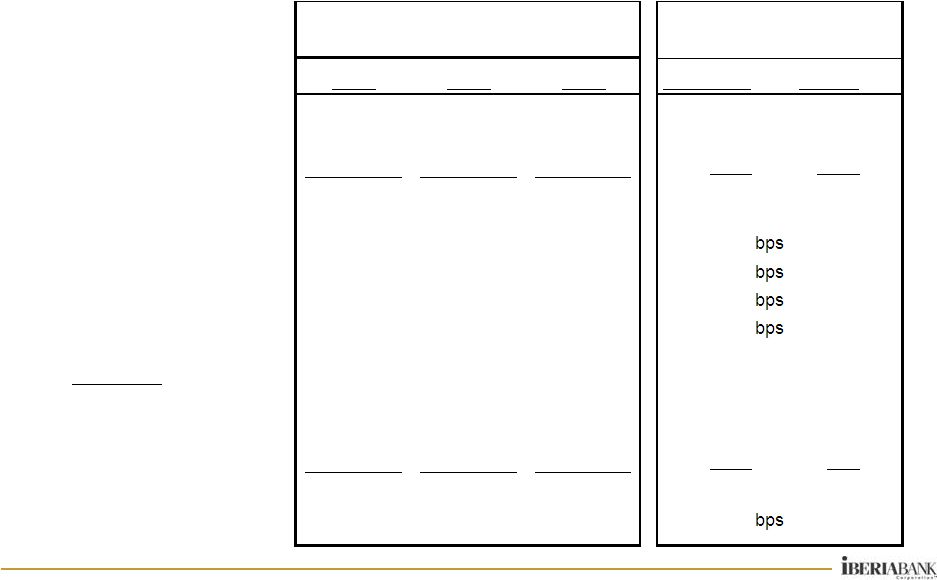
Asset Quality
Asset Quality
Legacy Portfolio
Asset Quality Summary
(Excludes FDIC covered assets and acquired impaired loans)
NPAs equated to 0.85%
of total assets, up 4 bps
compared to 3Q12
Total criticized loans
equal $354 million (25%
of Tier1 capital plus
ALLL); $231 million in
classified (-7% from
3Q12) and $122 million
special mention (-12%
from 3Q12)
Net Charge-offs of only
$91,000, or an
annualized rate of
0.01% of average loans
$0.4 million provision
for legacy franchise in
4Q12
($ thousands)
12/31/2011
9/30/2012
12/31/2012
Year/Year
Qtr/Qtr
Nonaccrual Loans
60,303
$
66,201
$
70,354
$
17%
6%
OREO
20,001
18,467
26,380
32%
43%
Accruing Loans 90+ Days Past Due
3,580
3,786
1,776
-50%
-53%
Nonperforming Assets
83,884
88,454
98,510
17%
11%
Past Due Loans
83,338
91,016
93,358
12%
3%
Classified Assets
205,920
247,923
231,586
12%
-7%
Nonperforming Assets/Assets
0.86%
0.81%
0.85%
(1)
bps
4
bps
NPAs/(Loans + OREO)
1.39%
1.26%
1.34%
(5)
bps
8
bps
Classified Assets/Total Assets
4.21%
3.62%
3.05%
(116)
bps
(59)
bps
(Past Dues & Nonaccruals)/Loans
1.38%
1.30%
1.27%
(11)
bps
(3)
bps
Provision For Credit Losses
2,620
$
1,735
$
362
$
-86%
-79%
Net Charge-Offs/(Recoveries)
4,622
1,923
91
-98%
-95%
Provision Less Net Charge-Offs
(2,002)
$
(188)
$
271
$
-114%
-244%
Net Charge-Offs/Average Loans
0.31%
0.11%
0.01%
(30)
bps
(10)
bps
Reserve For Credit Losses/Loans
1.24%
1.13%
1.08%
(16)
bps
(5)
bps
For Quarter Ended:
% or Basis Point Change |
 14
Asset Quality
Asset Quality
Total Portfolio Trends
($thousands)
Nonaccruals
719,236
$
567,006
$
540,867
$
-25%
-5%
OREO & Foreclosed
125,046
129,173
121,536
-3%
-6%
90+ Days Past Due
29,003
5,538
4,404
-85%
-20%
Nonperforming Assets
873,285
$
701,717
$
666,807
$
-24%
-5%
NPAs/Assets
7.43%
5.60%
5.08%
(235)
(52)
bps
NPAs/(Loans + OREO)
11.62%
8.39%
7.74%
(388)
(65)
bps
LLR/Loans
2.62%
2.45%
2.96%
34
51
bps
Net Charge-Offs/Loans
0.29%
0.10%
0.00%
(29)
(10)
bps
Past Dues:
30-89 Days Past Due
86,467
$
59,063
$
47,899
$
-45%
-19%
90+ days Past Due
29,003
5,538
4,404
-85%
-20%
Nonaccual Loans
719,236
567,006
540,867
-25%
-5%
Total 30+ Past Dues
834,706
$
631,607
$
593,170
$
-29%
-6%
% Loans
11.30%
7.67%
6.98%
(432)
(69)
bps
Qtr/Qtr
% or Basis Point Change
Total Portfolio
4Q11
3Q12
4Q12
Year/Year |
 15
Markets
Markets
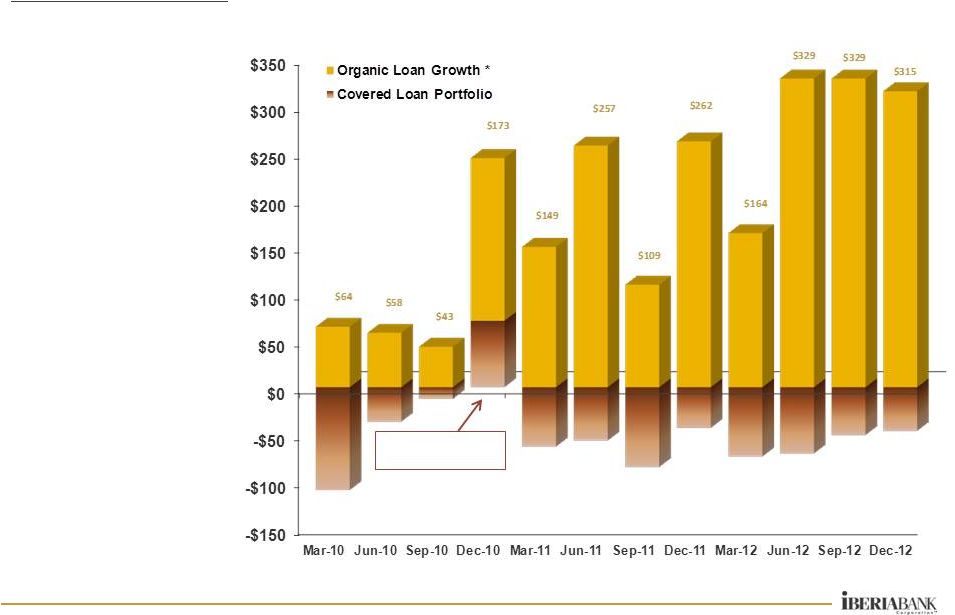
Loan Growth
Organic Loan Growth
$ in millions
4th Quarter 2012:
Sterling Bank FDIC-
Assisted Acquisition
•
•
•
•
$315 million, or
+4% (+18%
annualized)
Year of 2012:
$1.1 billion, or
+19%
Past 3 years:
$2.3 billion, or +55%
(+18% annualized)
The FDIC covered
loan portfolio
declined 35%, or
$578 million (a 12%
annualized rate)
* Organic loan growth excludes the outstanding balance of loans acquired in non-covered
transactions (e.g., OMNI, Cameron, and Florida Gulf) at the date of the acquisition in the respective acquisition periods |
 16
Markets
Markets
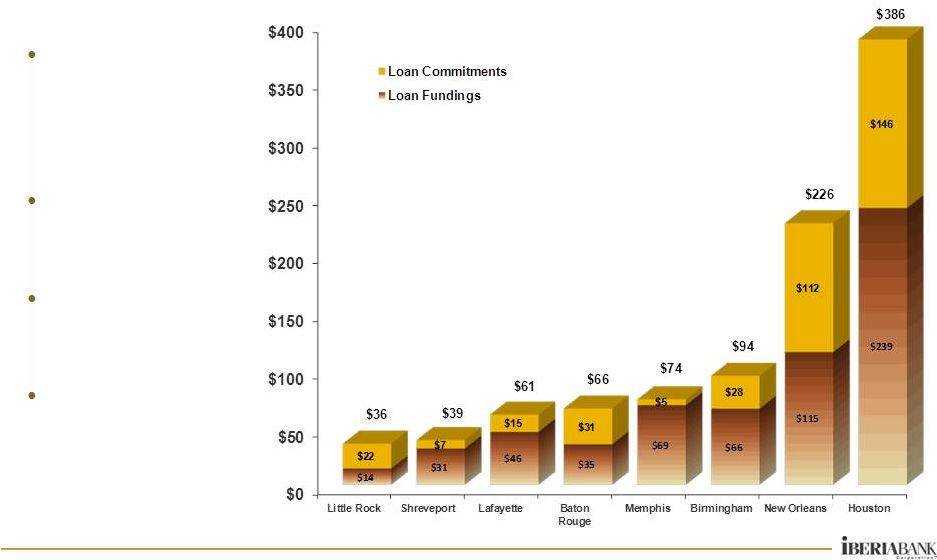
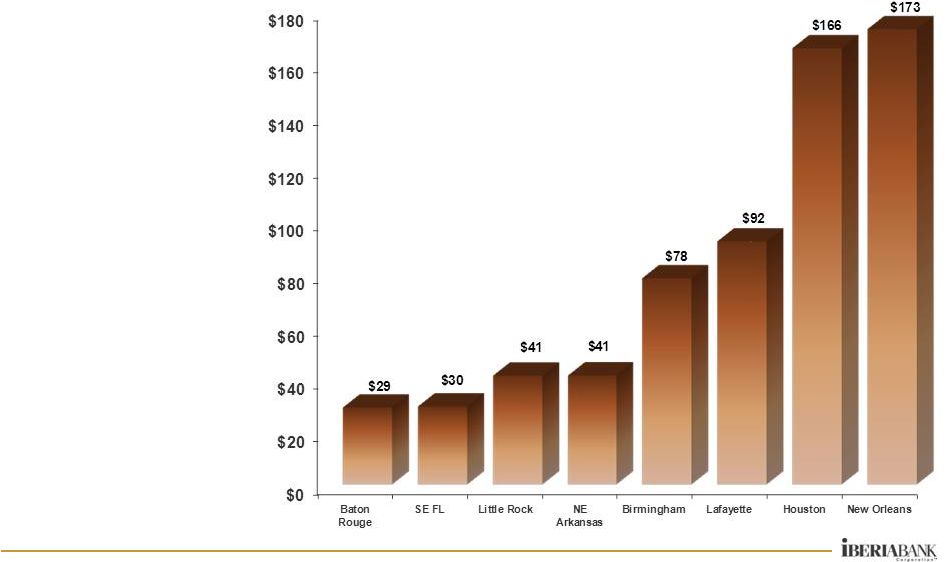
Loan Originations 4Q12 –Top Markets
$ in millions
$1.2 billion in total
funded loans and
unfunded loan
commitments
originated in 4Q12
Tremendous growth
in Houston and New
Orleans
Recently added new
team members in
Houston
Exceptional growth
in other markets in
which we have
invested heavily |
 17
Markets
Markets
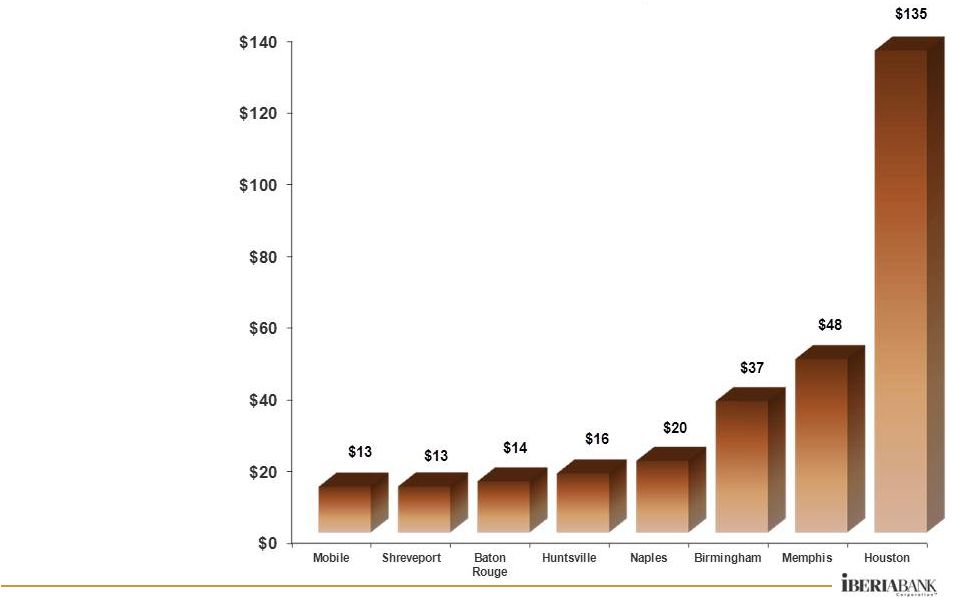
Net Loan Growth 4Q12 –Top Markets
$ in millions
•
Diversified strength
throughout our
franchise
•
Strong growth net
of loan pay-downs
•
Strongest markets
are Houston,
Memphis, and
Birmingham
•
Small business
lending is a
potential growth
engine |
 18
Excludes acquired deposits
Markets
Markets
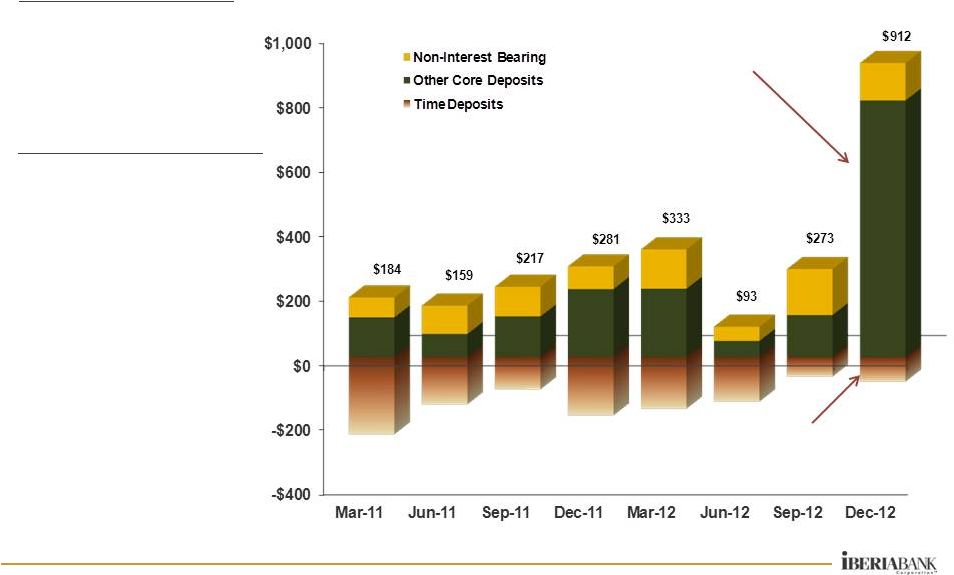
Organic Deposit Growth
$ in millions
Organic Deposit Growth
4th Quarter 2012:
•
Excluding wholesale
and seasonal
deposits, growth of
$525 million, or +5%
(+21% annualized)
Year of 2012:
•
$1.2 billion, or +13%
Past 3 years:
•
$1.4 billion, or +19 %
(+6 % annualized)
•
In 4Q12, $835
million, or +8%
(+34%
annualized)
Total Deposit Growth
Very strong transaction
account growth
Time deposit reduction
tempered by wholesale
deposit growth in 4Q12 |
 19
Markets
Markets
Core Deposit Growth 4Q12 –Top Markets
$ in millions
•
Balanced core
deposit growth
•
Extraordinary
strength in New
Orleans and
Houston
•
Good core deposit
growth throughout
the legacy franchise
and many newer
markets
•
Deposit pricing
remains favorable |
 20
Markets
Markets
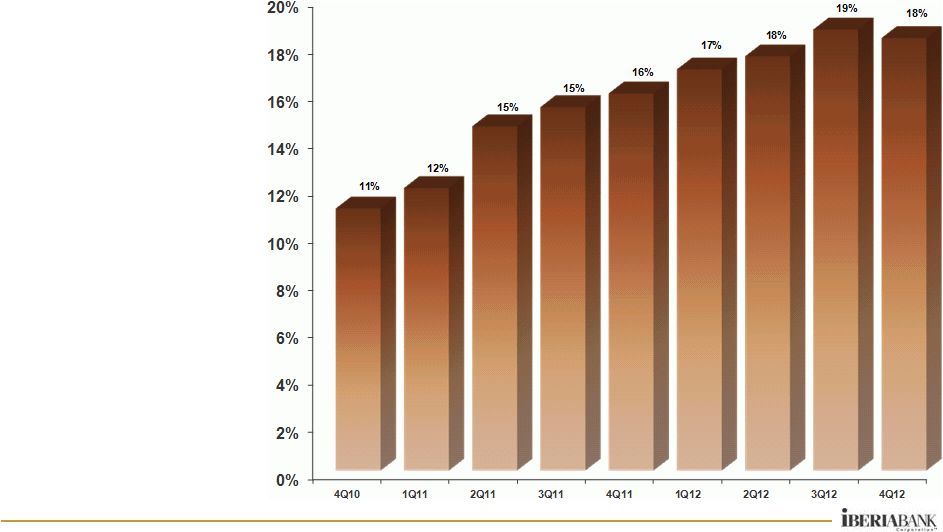
Non-Interest Bearing Deposit Growth
% of Total Deposits
•
Since 2010, total non-
interest bearing
deposits have
increased $1.1 billion
or +124% (+62%
annualized rate)
•
$116 million increase
in 4Q12, or +6%
(+25% annualized
rate)
•
Top 4Q12 noninterest
bearing deposit growth
markets include New
Orleans, Houston,
Southeast Florida,
Florida Keys,
Lafayette,
Birmingham, and
Shreveport |
| 21
Markets
Markets
4Q12 Highlights
•
Exceptional loan and deposit growth continues
•
Non-FDIC loan growth of $315 million came from a number of
markets and in both commercial and retail markets
•
Houston, New Orleans, Memphis and Baton Rouge showed strong
commercial
growth
–
concentrated
in
our
C&I
clients
•
Commercial loans originated and funded in 4Q12 totaled $503 million
with a mix of 33% fixed and 67% floating ($810 in commercial loan
commitments during the quarter)
•
Strong commercial pipeline of $527 million at year-end
•
Retail growth driven by increases in indirect lending and home equity
lines of credit –
arising from recent improvements in these businesses
•
Period-end core deposit growth of $912 million, with non-interest
bearing deposits up $116 million ($155 million linked quarter growth
on an average balance basis). |
| 22
Retail and Small Business
Retail and Small Business
4Q12 Progress
•
Completed closure and consolidation of 11 branches planned for
2012 and are on track to close 4 additional branches in the first
quarter of 2013
•
Since September 30, 2012, we opened seven new branch locations
in New Orleans (3), Birmingham, Houston, Baton Rouge, and Naples
•
Enhanced IBKC’s digital banking tools to better serve clients with the
launch of our online consumer deposit account opening process in
the fourth quarter of 2012
•
Experienced increases in both new small business clients and
checking account openings in 4Q12
•
Successful deposit campaign
•
Continued focused effort on direct and indirect consumer and small
business lending |
 23
Wealth And Capital Markets
Wealth And Capital Markets
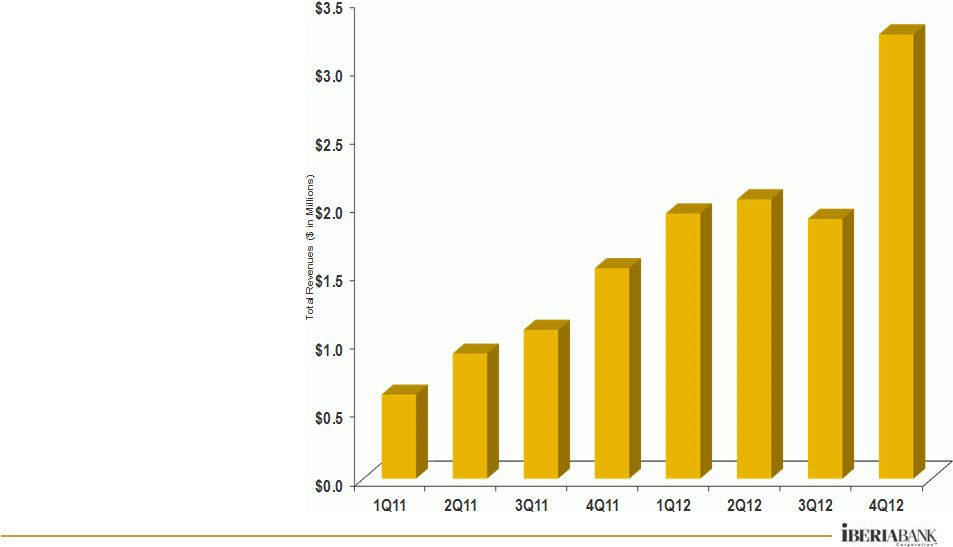
4Q12 Progress
•
ICP/IWA revenues of
$3.3 million (up 71%
compared to 3Q12)
•
IWA assets under
management increased
6%, to $955 million at
December 31, 2012
•
ICP investment banking
activity set a record in
4Q12, while brokerage
commissions continued
to grow
•
Research coverage on
61 public energy
companies
•
IFS revenue down 5%,
to $2.2 million,
compared to 3Q12
Total Quarterly Revenues |
 Appendix
24 |
 25
Appendix
Appendix
FDIC Covered Loan Portfolio Roll Forward
25
Average
Income /
Expense
Average
Yield
Average
Income /
Expense
Average
Yield
Average
Income /
Expense
Average
Yield
Average
Income /
Expense
Average
Yield
Covered Loans
1,293,160
52,019
15.968%
1,218,933
51,150
16.661%
1,153,954
55,400
18.878%
1,112,153
49,550
17.528%
Mortgage Loans
211,640
4,946
9.347%
196,969
5,128
10.414%
169,580
5,306
12.517%
155,989
5,318
13.636%
Indirect Automobile
-
-
0.000%
-
-
0.000%
(0)
-
0.000%
(0)
-
0.000%
Credit Card
901
14
6.199%
862
14
6.629%
853
14
6.746%
860
14
6.664%
Consumer
155,406
3,895
10.080%
150,236
4,324
11.577%
149,877
5,282
14.020%
148,001
5,308
14.267%
Line Of Credit-Consumer Loans
75,164
2,927
15.663%
72,370
2,953
16.410%
72,598
3,462
18.971%
69,910
3,661
20.831%
Commercial & Business Banking
850,519
40,238
18.719%
798,767
38,731
19.186%
761,048
41,335
21.257%
737,394
35,250
18.706%
Loans in Process
(469)
-
0.000%
(272)
-
0.000%
(3)
-
0.000%
(1)
-
0.000%
Overdrafts
0
-
0.000%
0
-
0.000%
0
-
0.000%
0
-
0.000%
FDIC Loss Share Receivable
573,776
(27,927)
-19.255%
508,443
(28,484)
-22.163%
448,746
(33,488)
-29.201%
411,328
(28,201)
-26.828%
Net Covered Loan Portfolio
1,866,937
24,092
5.142%
1,727,375
22,666
5.234%
1,602,700
21,912
5.416%
1,523,481
21,349
5.552%
Average
Income /
Expense
Average
Yield
Average
Income /
Expense
Average
Yield
Average
Income /
Expense
Average
Yield
Average
Income /
Expense
Average
Yield
Covered Loans
1,293,160
52,019
15.968%
1,218,933
51,150
16.661%
1,153,954
55,400
18.878%
1,112,153
49,550
17.528%
CapitalSouth Bank
198,491
6,203
12.416%
187,742
7,077
14.966%
169,584
6,480
15.034%
150,872
6,737
17.537%
Orion Bank
710,111
34,820
19.448%
673,068
33,586
19.801%
651,176
35,154
21.221%
641,252
29,720
18.235%
Century Bank
264,864
6,697
10.080%
255,610
6,134
10.080%
244,874
8,047
12.967%
232,967
7,137
12.108%
Sterling Bank
119,694
4,299
14.239%
102,513
4,353
16.829%
88,322
5,718
25.371%
87,063
5,956
26.806%
FDIC Loss Share Receivable
573,776
(27,927)
-19.255%
508,443
(28,484)
-22.163%
448,746
(33,488)
-29.201%
411,328
(28,201)
-26.828%
CapitalSouth Bank
49,433
(1,917)
-15.338%
44,503
(3,285)
-29.204%
40,443
(3,213)
-31.088%
35,811
(3,431)
-37.492%
Orion Bank
349,685
(21,626)
-24.466%
306,347
(21,149)
-27.311%
271,457
(22,983)
-33.130%
251,749
(17,944)
-27.892%
Century Bank
136,205
(2,380)
-6.913%
119,445
(1,911)
-6.329%
101,167
(3,875)
-14.987%
92,076
(3,200)
-13.601%
Sterling Bank
38,453
(2,004)
-20.621%
38,148
(2,139)
-22.181%
35,680
(3,417)
-37.472%
31,691
(3,625)
-44.761%
Net Covered Loan Portfolio
1,866,937
24,092
5.142%
1,727,375
22,666
5.234%
1,602,700
21,912
5.416%
1,523,481
21,349
5.552%
CapitalSouth Bank
247,924
4,286
6.882%
232,245
3,792
6.493%
210,027
3,267
6.133%
186,682
3,305
6.964%
Orion Bank
1,059,796
13,194
4.952%
979,415
12,436
5.033%
922,633
12,171
5.160%
893,002
11,776
5.121%
Century Bank
401,069
4,317
4.309%
375,055
4,224
4.495%
346,041
4,173
4.766%
325,044
3,937
4.804%
Sterling Bank
158,148
2,294
5.763%
140,661
2,214
6.236%
124,002
2,301
7.255%
118,754
2,331
7.681%
1Q2012
2Q2012
3Q2012
4Q2012
1Q2012
2Q2012
3Q2012
4Q2012 |