Attached files
| file | filename |
|---|---|
| 8-K - FORM 8-K - HOME LOAN SERVICING SOLUTIONS, LTD. | d474092d8k.htm |
 HLSS Servicer Advance Receivables Trust
Investor Presentation
Exhibit 99.1 |
 FORWARD-LOOKING STATEMENTS:
OUR PRESENTATION MAY CONTAIN CERTAIN FORWARD-LOOKING STATEMENTS THAT ARE MADE
PURSUANT TO THE SAFE HARBOR PROVISIONS OF THE FEDERAL SECURITIES LAWS.
THESE FORWARD-LOOKING STATEMENTS MAY BE IDENTIFIED BY A REFERENCE TO A
FUTURE PERIOD OR BY THE USE OF FORWARD-LOOKING TERMINOLOGY. THEY
MAY INVOLVE RISKS AND UNCERTAINTIES THAT COULD CAUSE THE COMPANY’S ACTUAL
RESULTS TO DIFFER MATERIALLY FROM THE RESULTS DISCUSSED IN THE FORWARD-LOOKING
STATEMENTS. NON-GAAP MEASURES:
OUR PRESENTATION CONTAINS REFERENCES TO SERVICING REVENUE AND SERVICING EXPENSE,
WHICH ARE NON-GAAP PERFORMANCE MEASURES. WE BELIEVE THESE NON-GAAP
PERFORMANCE MEASURES MAY PROVIDE ADDITIONAL MEANINGFUL COMPARISONS BETWEEN
CURRENT RESULTS AND RESULTS IN PRIOR PERIODS. NON-GAAP PERFORMANCE
MEASURES SHOULD BE VIEWED IN ADDITION TO, AND NOT AS AN ALTERNATIVE FOR, THE
COMPANY’S REPORTED RESULTS UNDER ACCOUNTING PRINCIPLES GENERALLY
ACCEPTED IN THE UNITED STATES.
Disclaimer
2 |
 Table
of Contents Agenda
1.
HLSS Overview
2.
Ocwen Overview
3.
HSART Master Trust Overview
4.
Appendices
3 |
 HLSS
Overview 4 |
 HLSS
Overview HLSS Overview
HLSS is an independent acquirer of high quality mortgage servicing assets
Mortgage servicing advances
Rights to fees from servicing non-agency mortgage loans (rights to MSRs)
HLSS launched in March 2012 using the $180.5mm in net proceeds from its IPO
and Private Placement to acquire rights to MSRs with $15.2bn UPB from
Ocwen Since the IPO, HLSS has raised an additional $730.6mm of total equity
in two follow-on offerings. Proceeds were primarily used to
purchase rights to MSRs and servicing advance assets from Ocwen with $67.5bn UPB
The company has engaged Ocwen to service the mortgage loans underlying its mortgage
servicing assets. HLSS does not intend to develop its own mortgage servicing
platform and does not originate or purchase mortgage loans The company’s
primary objective is to deliver attractive and consistent risk-adjusted returns to shareholders. HLSS intends
to distribute at least 90% of its net income over time to shareholders in the form
of a monthly cash dividend Company Overview
Remaining Ocwen portfolio includes similar assets with
approximately $29bn UPB available for purchase by HLSS
Purchase of Homeward and the announced acquisition of
ResCap by Ocwen will add $120bn in UPB to purchase
pipeline
HLSS will complete large bulk purchases using
proceeds from follow-on equity raises
HLSS will use cash flow from operations to purchase
MSR & servicing advances from Ocwen on a flow basis
Currently focused on the Alt-A and Subprime sectors
May consider purchasing from third-parties, but view
Ocwen-serviced
assets
as
a
priority
in
the
near-term
Growth Plan
Earned $6.6mm, or $0.37 per ordinary share, exceeding
guidance
Declared dividends totaling $5.9mm for the quarter, or
$0.30 per ordinary share
Increased UPB to $46.5bn and improved the ratio of
advances to UPB to 3.11%
Earnings include a $0.03 per share benefit from reduced
amortization due to several factors that reduced the
prepayment speed to 12.6% from 15.2% in the second
quarter
Third Quarter Financial Highlights
HLSS has built a portfolio of high quality mortgage servicing assets and continues to
grow through its strategic relationship with Ocwen
5 |
 July
August
March 2012
Gross proceeds of $196.6mm
from an IPO and Private
Placement and acquisition of
rights to MSRs with $15.2bn UPB
Acquired HomEq servicer
advance facility with $413.4mm of
servicer advance receivables
May 2012
Acquired rights to MSRs
with $2.9bn UPB
Included $92.2mm of
servicer advance
receivables
August 2012
Acquired rights to MSRs
with $2.1bn UPB
Included $68.2mm of
servicer advance
receivables
September 2012
Purchased rights to MSRs
with $21.2bn UPB
Included $702.7mm of
servicer advance
receivables
September 2012
Priced a follow-on
equity offering with
gross proceeds of
approximately
$249.9mm
September 2012
Acquired rights to MSRs
with $6.7bn UPB
Included $225.4mm of
servicer advance
receivables
June
May
April
March
October
September
Portfolio Acquisitions and Milestones
HLSS has steadily acquired the rights to MSRs and related servicer advances from
Ocwen which continue to be serviced by Ocwen via servicing/subservicing
agreements HLSS Overview
HLSS has acquired $3.2bn of servicer advance receivables since its IPO in March
2012 November
December
December 2012
Priced a follow-on equity
offering with gross
proceeds of approximately
$480.7mm
December 2012
Acquired rights to MSRs with
$34.6bn UPB
Included $1.7bn of servicer
advance receivables
6 |
 Veteran management team with extensive mortgage servicing experience
HLSS Overview
HLSS Leadership Team
Served as Chairman since the
inception of HLSS
Chairman of Ocwen since September
1996 and Altisource since 2009
CEO of Ocwen Financial from
January 1988 to May 1998
Managing General Partner of The
Oxford Financial Group (predecessor
of Ocwen) from 1983 to 1995
William C. Erbey
Served as a director since October
2011 and was appointed President in
March 2012
Previously served as CFO and Chief
Accounting Officer and EVP at Ocwen
Financial, Ocwen Asset Management
and Ocwen Loan Servicing
Duties included directing Ocwen's
Advance Facility
John P. Van Vlack
Serves
as
CFO
and
SVP
Previously served as VP of Ocwen
Financial
Duties included directing Ocwen's
Advance Facility
Previously held several positions at
AT&T, including CFO of National
Business Markets, Online Markets
and BellSouth Community
Technologies
James E. Lauter
Serves as Treasurer and SVP
Previously served as Senior VP and
Treasurer of Ocwen Financial
Worked at Ocwen since 1995,
primarily in Treasury, Capital Markets
and Servicing Acquisitions
Previously employed by Deloitte as a
Senior Analyst on the CMO team
New York Certified Public Accountant
Richard Delgado
General
Counsel
and
SVP
Previously served as Senior VP and
Deputy General Counsel of Ocwen
Financial
Duties included directing transactional
legal matters
Served as Associate General Counsel
at Fannie Mae prior to joining Ocwen
Michael J. McElroy
SVP of Investor Relations and Capital
Markets
Previously served as investment
banker at UBS and J.P. Morgan
Duties included capital raising for
financial services companies,
including Ocwen
Ran Alternative Capital Markets
group at UBS
Bryon E. Stevens
7 |
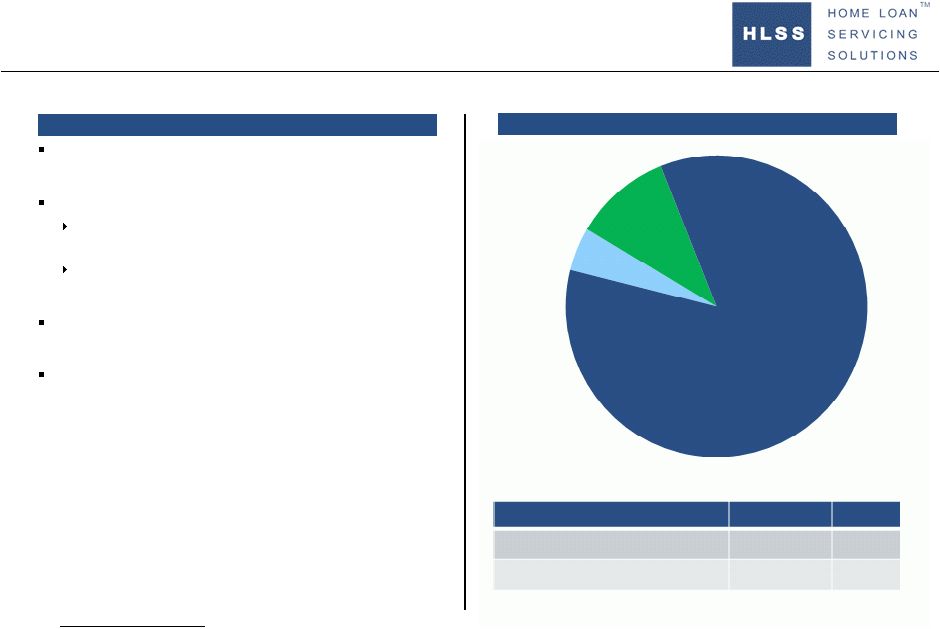 Cash
& Reserves
$79.1
($ in Millions)
(1)
Rights to
MSRs
$177.7
Servicing
Advances
$1,446.1
HLSS has Limited Asset Valuation Risk
90% of assets are Servicing Advances or Cash which are
carried at par and have no valuation risk
10% of assets have a stable valuation history
Rights to MSRs represent the present value of future
servicing fees, less expenses
Minimal correlation between prepayment speed and
interest rates on non-agency mortgages
Ocwen has never experienced a valuation impairment
holding similar assets
If loan proceeds are ever insufficient, recovery is from
collections on other loans in RMBS trust
HLSS Overview
September 30, 2012
Servicing Advances Risk
8
1.
Reserves associated with the Advance Financing Facility
The bulk of HLSS Assets are servicing advances
Total Assets
Servicing Advances &
Cash
1,525.2
90%
MSRs
177.7
10%
$1,702.9
100% |
 $46.5 Billion
UPB
$44.8 Billion
$1.7 Billion
96.3% Downside
Protection
HLSS Assets
Assets are a 4% First-Priority Claim
No credit risk due to over
collateralization
Advances are recovered at “top-of-
the-waterfall”
from loan proceeds
If loan proceeds are ever
insufficient, recovery is from
collections on other loans in RMBS
trust
Over
Collateralization
Overview
(1)
HLSS Overview
~96.3%
decline
in
real
estate
value
would
be
required
to
impair
HLSS’
assets
9
1.
Balance as of September 30, 2012 |
 HLSS
expects to be a regular issuer in the Term ABS markets as it continues to acquire servicing
advance assets from Ocwen
HLSS Overview
HLSS Term Note Issuance Program
Ocwen's purchase of Homeward in Dec 2012 and announced acquisition of ResCap will
add $120bn in similar available assets
HLSS intends to continue acquiring rights to MSRs and the associated servicing
advance assets held by Ocwen through ongoing flow transactions and bulk
purchases Developing efficient funding sources for the servicer advance
assets will be a key focal point, and HLSS intends to access the Term ABS
markets frequently with multiple issuances expected per year On December 26,
2012, in connection with the acquisition of the rights to MSRs with approximately
$34.6bn UPB, HLSS amended and upsized its existing HLSS Master Trust servicer
advance facility HLSS
purchased
$1.74bn
in
servicing
advances
and
related
pooling
and
servicing
agreements
$1.6bn VFN capacity used to fund the purchase
10
Ocwen has an existing portfolio of servicing rights of more than $29bn in securitized non-agency
UPB available for purchase and continues to seek more acquisition opportunities |
 HLSS
Overview HLSS Term Note Issuance Program
HLSS
is
expected
to
continue
its
presence
in
the
Term
ABS
market
in
order
to
efficiently
finance
future acquisitions of servicing advance assets and refinance existing notes as they
mature 11
1.
This includes VFN committed amount as of January 23, 2013
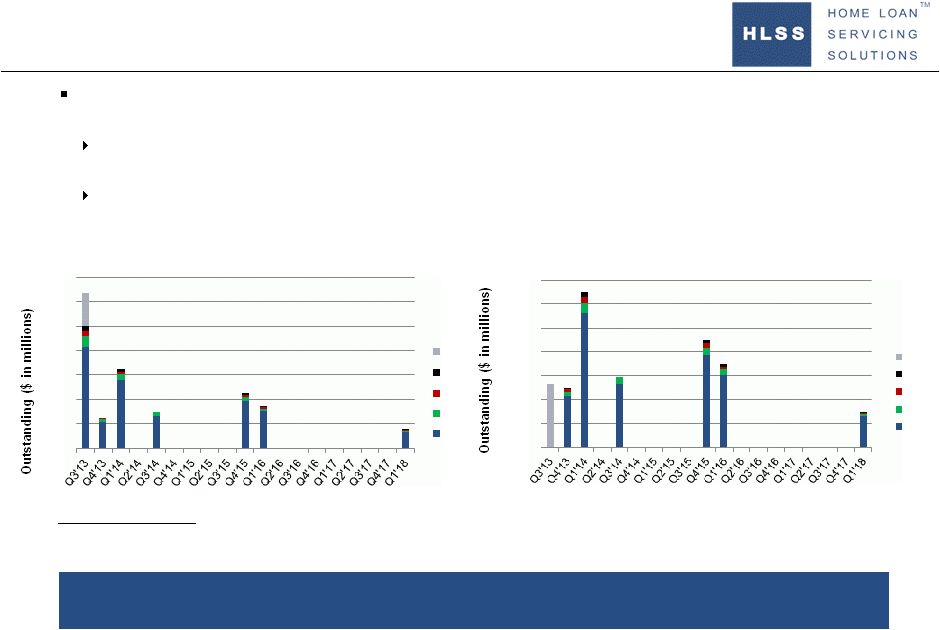
0
100
200
300
400
500
600
700
A-1+
BBB
A
AA
AAA
0
200
400
600
800
1,000
1,200
1,400
A-1+
BBB
A
AA
AAA
HSART Maturity Distribution (ex. VFNs)
Quarter
Quarter
On January 22, 2013, HLSS issued a series of term notes that were utilized to
refinance VFN balances associated with the December bulk purchase
The issuance successfully refinanced more costly VFN financing within the master
trust servicer advance facility
$1.15bn of combined one-year, three-year and five-year medium term
notes rated AAA to BBB (S&P) –
Marked the first 5yr offered note secured by servicing advance receivables
(“SAR”) HSART Maturity Distribution (includes VFN)
(1) |
 Ocwen Overview
12 |
 The
HLSS-Ocwen subservicing relationship allows HLSS to benefit from Ocwen’s industry
expertise and previous experience servicing the assets
Ocwen Overview
HLSS-Ocwen Subservicing Relationship
HLSS
has
engaged
Ocwen
to
service
the
HLSS
portfolio. Ocwen is also expected to be engaged
as subservicer on foreseeable future asset
acquisitions
The majority of Ocwen’s subservicing fee is
structured as an incentive fee which rewards
collateral performance thereby reducing HLSS’
cost of advance financing
All current HLSS assets were acquired from
Ocwen. As a result, Ocwen has substantial
previous experience servicing the HLSS portfolio
HLSS does not have and does not intend to
develop
its
own mortgage servicing platform
Ocwen has begun to migrate to a fee-for service
model with lower leverage and lower balance
sheet requirements
HLSS-Ocwen Relationship Overview
Pure play mortgage servicer with $5.1bn in market
capitalization
(1)
Ocwen services loans across all 50 states, the District
of Columbia and two U.S. territories providing
geographic diversification for its servicing portfolio
Servicing portfolio of 805,427 loans and real estate
assets with $127bn UPB as of Sept 30, 2012
Ocwen has completed over 200,000 loan
modifications since January 2008
20+ years of innovation in loss mitigation
#1 in servicing quality in third party studies of
servicers
Low cost, scalable servicing platform and technology
Ocwen Servicing Highlights
1.
As
of
Jan
22,
2013,
based
upon
a
share
price
of
$37.77
and
outstanding
shares
of
135.0mm.
13 |
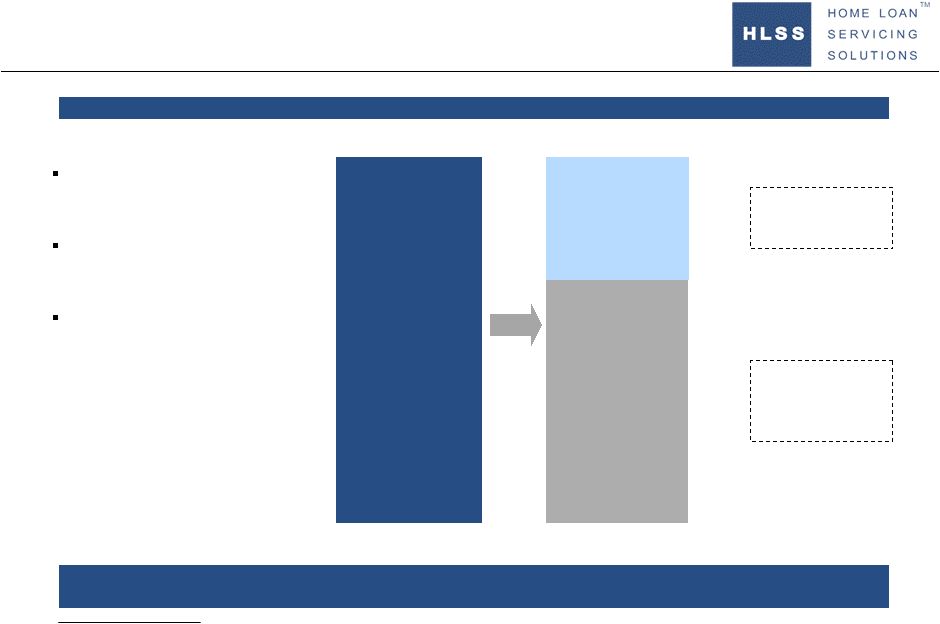 19
bps Subservicing Fee
paid to Ocwen
13 bps Incentive
Fee
6 bps
Base Fee
~70%
Downside
Protection
~30%
Base Fee
Incentive fee establishes an effective floor on yield while maintaining upside
potential Subservicing Fee Adjusts to
Support Targeted Yield
HLSS’
largest expense can be
reduced by up to 70% to stabilize
earnings
Protects against higher interest
expense if Servicing Advances
increase
HLSS benefits from lower interest
expense if Servicing Advances
decrease
Subservicing
Fee
(1)
14
1.
Amounts
based
on
49
bps
servicing
fee
earned
and
30
bps
retained
fee
in
Q3.
The
incentive
fee
is
the
servicing
fee
minus
the
base
fee
and
the
retained
fee
Ocwen Overview |
 Ocwen
Overview Global Servicing Platform
Ocwen
employs
over
6,000
professionals
and
staff
worldwide
(1)
Houston, TX
Bangalore, India
Mumbai, India
Montevideo,
Uruguay
Atlanta, GA
West Palm Beach, FL
St. Croix, US
Virgin Islands
1.
As of December 31, 2012.
Mount Laurel, NJ
Dallas, TX
Pune, India
15 |
 Ocwen
Overview Ocwen Servicing Portfolio History
Performance and Proven Ability to Ramp Up
Date
Portfolio
Number of Loans
UPB ($bn)
Days to Board
2009 Q3
Freddie
Mac
-
TBW
DQ
Loan
Subservicing
24,000
$4.2
11 days
2009 Q3
to 2010 Q3
Freddie
Mac
-
TBW
DQ
Loan
-
Monthly
Flow
1,500
to 5,000
Varied
30 days
2009 Q4
Undisclosed
-
Subprime
Subservicing
62,000
$9.6
45 days
2010 Q1
Saxon
-
MSR
Purchase
36,000
$6.7
45 days
2010 Q3
HomEq
-
MSR
Purchase
134,000
$22.3
90 days
2011 Q2
Undisclosed
-
Subprime
Subservicing
13,000
$3.2
45 days
2011 Q3
Litton -
MSR Purchase
156,000
$ 23.2
90 days
2011 Q4
Litton -
MSR Purchase
87,000
$14.7
150 days
2012 Q2
Saxon
and
JPMorgan
Chase
-
MSR
Purchases
104,000
$20.2
90 days
2012 Q2
Bank
of
America
-
MSR
Purchase
53,000
$10.7
90 days
2012 Q2
Aurora
Bank
-
MSR
Purchase
3,316
$1.8
75 days
2012 Q2
Large
Bank
Subservicing
-
Held
For
Investment
Loans
9,000
$1.8
120 days
2012 Q3
Fannie
Mae
/
Freddie
Mac
–
MSR
Purchases
1,700
$0.3
45 days
2012 Q3
Fannie
Mae
–
MSR
Purchases
7,100
$2.2
45 days
16
Ocwen has a successful history of boarding and managing mortgage servicing portfolios |
 Ocwen
Overview Ocwen Servicing Portfolio Update
Litton
Acquisition meeting or exceeding pro forma expectations
Delinquencies have been reduced substantially since boarding, 6 point drop in
delinquencies Boarded approximately 240,000 loans of which 1/3 were 60+days
delinquent while quickly improving performance and proving the scalability
of Ocwen’s servicing platform Saxon
MSR portfolio of approximately $22.2bn UPB of Agency and Non-Agency mortgages
acquired April 2, 2012 Also
included
acquisition
of
subservicing
agreements
relating
to
$2.7bn
UPB
of
Agency
and
Non-Agency
mortgages
Ocwen already sub-serviced approximately $9.9bn of this UPB
Acquisition already showing good results in delinquency and advance
reduction JPM Chase
Acquired MSRs for approximately $8.0bn UPB of non-prime loans on April 2,
2012 Simultaneous
close
of
104,000
Saxon
and
Chase
loans
demonstrates
the
flexibility
and
scalability
of
Ocwen’s
platform
Aurora Commercial Portfolio
Acquired servicing of 3,316 commercial mortgage loans with $1.8bn UPB on May 31,
2012 Bank of America
Boarding
completed
for
the
GSE
portfolio
of
$10.7bn
UPB
acquired
on
May
22,
2012
Homeward
Acquired Homeward Residential Holdings, Inc., existing origination and residential
mortgage loan servicing platform of approximately $77bn in UPB on December
27, 2012 ResCap
Pending acquisition of mortgage servicing and origination platform assets of
Residential Capital, LLC (expected to close in Q1 2013)
$203.7bn in UPB consists of $126.6bn in MSRs, $31bn in subservicing and $46bn in
master servicing Genworth
Announced acquisition of Genworth Financial Home Equity Access, Inc. reverse
mortgage business 17 |
 For acquired portfolios, superior loss mitigation processes enable Ocwen to reduce
delinquency rates and advances Ocwen Overview
Ocwen Servicing Effectiveness
90+ Days Delinquent by Portfolio
(1)
Advances as a % of UPB
(2)
1.
Based on UPB where Ocwen is required to make servicer advances as of
9/30/2012. 2.
HomEq and some other advances are not on Ocwen’s books due to transfer to
HLSS. 18
18%
23%
28%
33%
38%
43%
48%
Legacy Ocwen
Saxon
HomEq
Litton
Saxon New
Chase
0%
1%
2%
3%
4%
5%
6%
7%
8%
9%
Legacy Ocwen
Saxon
HomEq
Litton
Saxon-New
Chase
Reducing delinquencies and advances creates value through lower capital requirements,
lower interest expense and lower operating costs
|
 Ocwen
Overview Ocwen Servicing Portfolio Details
Residential Assets Serviced
Unpaid Principal Balance
Performing Loans
(1)
94,726,687
$
74.5%
71,900,689
$
70.4%
52,071,145
$
70.5%
Non-Performing Loans
26,639,871
21.0%
24,097,130
23.6%
15,903,038
21.5%
Non-Performing Real Estate
5,700,122
4.5%
6,201,403
6.1%
5,912,208
8.0%
Total Residential Assets Serviced
(2)
127,066,680
$
100.0%
102,199,222
$
100.0%
73,886,391
$
100.0%
HLSS Assets Serviced by Ocwen
81,089,850
$
63.8%
Loan Count
Performing Loans
(1)
640,690
79.5%
516,923
77.0%
367,213
76.6%
Non-Performing Loans
134,445
16.7%
123,584
18.4%
82,204
17.2%
Non-Performing Real Estate
30,292
3.8%
31,116
4.6%
29,748
6.2%
Total Residential Assets Serviced
(2)
805,427
100.0%
671,623
100.0%
479,165
100.0%
Percent of total UPB
Servicing Portfolio
86.5%
77.0%
69.4%
Subservicing Portfolio
13.5%
23.0%
30.6%
Non-Performing, Excl. FHLMC
(4)
18.6%
27.9%
27.3%
Average CPR
September 30, 2012
December 31, 2011
December 31, 2010
14.7%
14.4%
12.7%
($ in thousands)
19
(3)
Ocwen reduced delinquencies even with adding highly delinquent portfolios
1.
Performing
loans
include
those
loans
that
are
current
(less
than
90
days
past
due)
and
those
loans
for
which
borrowers
are
making
scheduled
payments
under
loan
modification,
forbearance
or
bankruptcy plans. We consider all other loans to be non-performing.
2.
Subprime loans represent the largest category, or strata, of residential loans that
we service. At September 30, 2012, we serviced 609,304 subprime loans with a UPB of $93,212,794. This
compares to 548,504 subprime loans with a UPB of $84,726,233 at December 31, 2011
and 350,633 subprime loans with a UPB of $54,897,375 at June 30, 2011.
3.
Includes
the
Dec
26
asset
transfer.
4.
Excludes Freddie Mac loans serviced under special servicing agreements where we have
no obligation to advance. th |
 HSART Master Trust Overview
20 |
 HSART Structural Summary
Master Trust Overview
Cross collateralized receivables pool backing all series consists of approximately
$3.2bn in advances related to approximately $79bn in UPB on 771
non-agency PSAs Seven series have been issued thus far, and six are
currently outstanding: HSART Master Trust Overview
21
Series:
2012
VF1
2012
VF2
2012
VF3
2012
T2 1&3yr
2013
T1
2012
MM1
Note Holder
Barclays
Credit
Suisse
WFB
ABS
Investors
ABS
Investors
WFB
($ in Millions)
Lowest
Rating
BBB
BBB
BBB
BBB
BBB
AA
$1,150.0
$293.5
$3,143.5
Current HSART Master Trust
Total
Variable Funding Notes
Medium Term Notes
2a-7
Max
Capacity
$400.0
$300.0
$300.0
$700.0
HSART is structured as a master trust facility that provides HLSS the flexibility to periodically
issue different debt “Series” secured by a common collateral set |
 Master Trust Receivables Distribution
HSART Master Trust Overview
HSART Collateral Base
22
Receivable Type
Advance Rate Estimate
(BBB)
1
Receivable Balance
2
% of
Receivables
Non-Judicial P&I
95.40%
445,828,154.28
$
13.86%
Non-Judicial Escrow
94.40%
390,653,453.57
12.14%
Non-Judicial Corporate
94.15%
177,410,031.85
5.51%
Judicial P&I
93.40%
794,610,865.77
24.70%
Non-Judicial Deferred Servicing Fees
92.65%
13,842,311.28
0.43%
Judicial Corporate
90.65%
335,432,593.39
10.43%
Judicial Escrow
89.65%
1,037,470,410.95
32.24%
Judicial Deferred Servicing Fees
85.15%
22,269,055.69
0.69%
Total Receivable Amount
92.28%
3,217,516,876.78
$
100.00%
1
Advance Rates vary by series due to interest expense differentials
2
Receivables balance as of December 26, 2012
Receivables Distribution |
 Capital Structure
HSART Series 2013 –
T1
Marketing Summary
HSART Master Trust Overview
23
Class
Rating (S&P)
Note Balance
Advance Rates
Whisper Yield
Priced Yield
WAL
Repay Date
# of Accounts
A-1-T1
AAA(sf)
$ 562,355,000
79.84%
1.00%
0.90%
19
B-1-T1
AA(sf)
44,887,000
86.21%
1.40%
1.25%
3
C-1-T1
A(sf)
22,303,000
89.38%
Low/Mid 2%
1.65%
8
D-1-T1
BBB(sf)
20,455,000
92.28%
Low 3%
2.50%
12
Total
650,000,000
$
1.00%
Class
Rating (S&P)
Note Balance
Advance Rates
Whisper Yield
Priced Yield
WAL
Repay Date
# of Accounts
A-2-T1
AAA(sf)
$ 302,807,000
79.84%
1.65%
1.50%
16
B-2-T1
AA(sf)
24,170,000
86.21%
Low 2%
1.75%
9
C-2-T1
A(sf)
12,010,000
89.38%
Low 3%
2.50%
12
D-2-T1
BBB(sf)
11,013,000
92.28%
Low 4%
3.25%
14
Total
350,000,000
$
1.61%
Class
Rating (S&P)
Note Balance
Advance Rates
Whisper Yield
Priced Yield
WAL
Repay Date
# of Accounts
A-3-T1
AAA(sf)
$ 129,774,000
79.84%
Low/Mid 2%
2.30%
11
B-3-T1
AA(sf)
10,359,000
86.21%
Low 3%
2.75%
6
C-3-T1
A(sf)
5,147,000
89.38%
Low 4%
3.50%
10
D-3-T1
BBB(sf)
4,720,000
92.28%
5.00%
4.50%
10
Total
150,000,000
$
2.44%
Cumulative Total
1,150,000,000
$
1.70%
1
1
Duration WA COF
Five Year
4.98
1/16/2018
One Year
0.98
1/15/2014
Three Year
2.98
1/15/2016 |
 HSART 2012
–
T2 vs. HSART 2013
–
T1
HSART Series 2013 –
T1
Marketing Summary
HSART Master Trust Overview
24
Overview
Approximately 25% of allocations were distributed to investors who did not
participate in the October transaction The 5 year group alone was allocated
to 21 unique investors creating a new duration data point for SAR issuers and investors to reference
Account Type
HSART 2012 - T2
HSART 2013 - T1
Invest Manager
12
24
Insurance
9
10
Bank
2
6
Hedge Fund
6
5
State
2
2
Prop Desk
2
N/A
Utilities
1
N/A
Total
34
47
Number of Accounts
Top 5 Accounts
57.22%
Top 5 Accounts
53.85%
Top 10 Accounts
80.91%
Top 10 Accounts
69.43%
Remaining Accounts
19.09%
Remaining Accounts
30.57%
Top Accounts
HSART 2012 - T2
HSART 2013 - T1
Account Type
Total Allocation
% of Allocation
Invest Manager
$ 77,798,000
58.62%
Insurance
43,107,000
27.80%
Hedge Fund
31,659,000
11.97%
Bank
2,500,000
1.61%
Total
$ 155,064,000
100.00%
Sub Allocation Distribution
47 unique accounts participated in the offering compared with 34 in the HSART 2012 – T2 term
offering
$288,792,000
$861,208,000
HSART Investors
First time HSART Investor
Previous HSART Investor
Rating
1 Year
3 Year
5 Year
Total
AAA
19
16
11
29
AA
3
9
6
11
A
8
12
10
18
BBB
12
14
10
21
Total
1
42
34
21
47
1
Number of unique accounts
Number of Accounts
Account Type
Total Allocation
% of Allocation
Invest Manager
$ 771,162,000
77.55%
Bank
100,000,000
10.06%
Insurance
63,774,000
6.41%
Hedge Fund
34,500,000
3.47%
State
25,000,000
2.51%
Total
994,436,000
100.00%
Senior Allocation Distribution |
 Advances in excess of the below established thresholds are excluded from the
collateral base calculation thereby reducing the effective Advance
Rate Target Amortization Events
Earlier
of
the
related
expected
repayment
date
or
the
occurrence
of
the
following
events:
The
interest
coverage
ratio
is
<
5x
as
determined
on
the
payment
date
and
the
two
(2)
proceeding
payment
dates
Servicer
termination
events
on
servicing
agreements
represents
>
15%
of
all
eligible
servicing
agreements
included
in
the
facility
Monthly reimbursement rate < 8.00%
Rating downgrade on any outstanding classes of Offered Notes within the
series Investor Protections
HSART Investor Protections
Collateral Value Exclusions
HSART Master Trust Overview
Test
Threshold
Advance Ratio
>100%
UPB Ratio
>20%
Market Value Ratio
>20%
Low UPB and mortgage loan sublimit
>2%
Middle UPB and mortgage loan sublimit
>8%
Single PSA funded limit
>15%
Total receivables balance associated with any one REMIC cannot exceed 15% of all master trust
receivables funded
Explanation
For each designated PSA, Stressed non-recoverable advances divided by scheduled P&I
remittances for a given month cannot exceed 100%
For each designated PSA, advances divided by unpaid principal balance of such loan cannot exceed
20%
For each designated PSA, advances divided by the net property value of underlying properties
cannot exceed 20%
Advances from PSAs with UPB < $10MM or < 50 mortgage loans cannot exceed 2% of total master
trust receivables
Advances from PSAs with UPB > $10MM but < $25MM or > 50 but < 125 mortgage loans
cannot exceed 8% of total master trust receivables
25
Facility Eligible Receivables and Servicing Agreements
Criteria includes but not limited to:
Mortgage loan is secured by a first lien on the property
PSAs
provide
for
“first-in,
first-out”
or
“FIFO”
reimbursement
of
advances
PSAs provide for pool level or top of the waterfall non-recoverability
provisions Minimum UPB and loan count of $1mm and 15 mortgage loan,
respectively |
 Revolving Period
For
any
class
or
series,
commences
on
the
issuance
date
and
ends
on
the
earlier
to
occur
of
(i)
a
targeted
amortization
event
and
(ii)
an early amortization event
MTN
Holders
–
Interest
only
period
for
MTNs,
no
principal
is
due
or
paid
For
any
class
or
series,
commences
upon
the
occurrence
of
a
targeted
amortization
event.
During
a
TAP
for
any
class
or
series,
new
receivables are still funded while collections are used to amortize such class or
series on a scheduled basis MTN
Holders
-
As
currently
structured,
all
existing
and
newly
issued
MTNs
will
have
identical
targeted
amortization
triggers.
Once
triggered, MTN holders will be contractually entitled to a six-month repayment
of principal which are to be paid from collections. In the event,
collections are unable to support the scheduled amortization of all notes in TAP, the full transaction would enter the early
amortization period described below
For
all
classes
within
the
HSART
facility,
commences
upon
the
occurrence
of
an
early
amortization
event.
During
the
EAP,
new
advances are not funded and all collections are used to fully turbo all
outstandings series on a pro-rata and pari passu basis MTN
Holders
–
Upon
an
early
amortization
event,
all
Series
are
allocated
a
pro-rata
portion
of
collections
according
to
their
respective “Invested Amounts”. Classes within each Series are paid
sequentially according to seniority Transaction Phases
HSART Transaction Phases
HSART Master Trust Overview
26
Targeted Amortization Period (“TAP”)
Facility Early Amortization Period (“EAP”) |
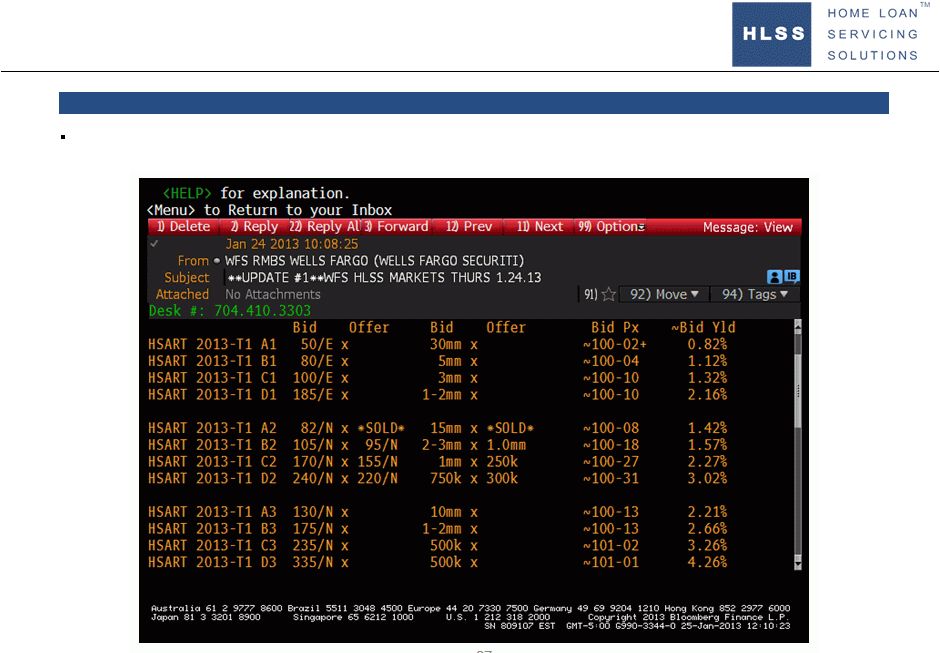 HSART Market Making
The uniform nature of the master trust medium term notes will likely result in
increased flow and liquidity as new issuances are brought to market and the
outstanding HSART footprint grows HSART Master Trust Overview
HSART Market Making
27 |
 Appendices
28 |
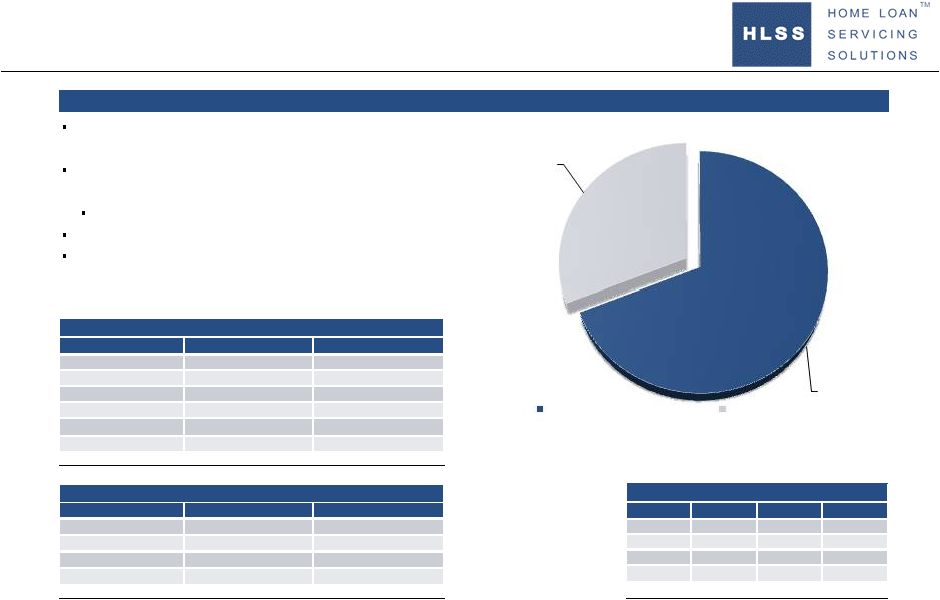
 HSART Series 2012 -
T2
Marketing Summary
Capital Structure
29
Appendices
Class
Rating (S&P)
Initial Note
Balance
Advance
Rates
Pre-Marketing Yield
Indications
Priced Yield
WAL
1
Principal
Window
Expected
Repayment
Date
Number of
Accounts
A-1
AAA
$215,067,000
78%
1.75%
1.35%
15
B-1
AA
$17,807,000
85%
2.50%
1.75%
5
C-1
A
$8,903,000
88%
4.00%
3.25%
11
D-1
BBB
$8,223,000
91%
4.75%
4.00%
9
Total
$250,000,000
1.53%
A-2
AAA
$387,121,000
78%
2.50%
2.00%
14
B-2
AA
$32,053,000
85%
3.25%
2.50%
9
C-2
A
$16,026,000
88%
5.00%
4.00%
13
D-2
BBB
$14,800,000
91%
5.75%
5.00%
12
Total
$450,000,000
2.21%
Cumulative Total
700,000,000
2.10%
2
1
Weighted average life to Expected Maturity Date
2
Duration weighted average cost of funds
Series 2012 -
T2 Term Notes
1.00
12-12
3.00
36-36
10/15/2013
10/15/2015
$ |
 34
total accounts were allocated bonds with investment managers and insurance
companies representing the majority of the order book The
continued
pursuit
of
yield
in
high
quality
cash
flows
helped to
bring in new SAR investor interest
First time SAR investors accounted for 31% of the order book
Three accounts put in for the full deal size
No
explicit
guidance
from
accounts
that
the
“S&P
only”
profile
caused
any material value concession
HSART Series 2012 -
T2
Investor Composition
Series
–
T2
Investor
Composition
30
Appendices
Account Type
Total Allocation
% of Allocation
Invest Mgmt
$335,121,000
55.65%
Insurance
$148,567,000
24.67%
Bank
$75,000,000
12.45%
State
$25,500,000
4.23%
Hedge Fund
$14,000,000
2.32%
Utilities
$4,000,000
0.66%
Total Senior
$602,188,000
100.00%
Senior Allocation Distribution
Account Type
Total Allocation
% of Allocation
Invest Mgmt
$45,736,000
46.76%
Insurance
$30,500,000
31.18%
Hedge Fund
$18,326,000
18.74%
Prop Desk
$3,250,000
3.32%
Total Subs
$97,812,000
100.00%
Sub Allocation Distribution
Rating
1 Year
3 Year
Total
1
AAA
15
14
23
AA
5
9
10
A
11
13
17
BBB
9
12
13
Total
1
24
24
34
1
Total number of unique accounts
Number of Accounts
$216,999,000
$483,001,000
New SAR Investors
Previous SAR Investor
New SAR Investor |
 HLSS Servicer Advance Receivables Trust |