Attached files
| file | filename |
|---|---|
| 8-K - CALGON CARBON CORP. 8-K - CALGON CARBON Corp | a50497767.htm |
Exhibit 99.1
Defining Calgon Carbon’s Relevant Market Space Municipal Drinking Water and Disinfection Byproduct Regulatory Compliance in the United States Presented by [Name Here] Calgon Carbon Corporation 2012
Forward-Looking Information Safe Harbor This presentation contains historical information and forward-looking statements. Forward-looking statements typically contain words such as “expect,” “believe,” “estimate,” “anticipate,” or similar words indicating that future outcomes are uncertain. Statements looking forward in time, including statements regarding future growth and profitability, price increases, cost savings, broader product lines, enhanced competitive posture and acquisitions, are included in the company’s most recent Annual Report pursuant to the “safe harbor” provision of the Private Securities Litigation Reform Act of 1995. They involve known and unknown risks and uncertainties that may cause the company’s actual results in future periods to be materially different from any future performance suggested herein. Further, the company operates in an industry sector where securities values may be volatile and may be influenced by economic and other factors beyond the company’s control. Some of the factors that could affect future performance of the company are higher energy and raw material costs, costs of imports and related tariffs, labor relations, capital and environmental requirements, changes in foreign currency exchange rates, borrowing restrictions, validity of patents and other intellectual property, and pension costs. In the context of the forward-looking information provided in this presentation, please refer to the discussions of risk factors and other information detailed in, as well as the other information contained in the company’s most recent Annual Report. 2
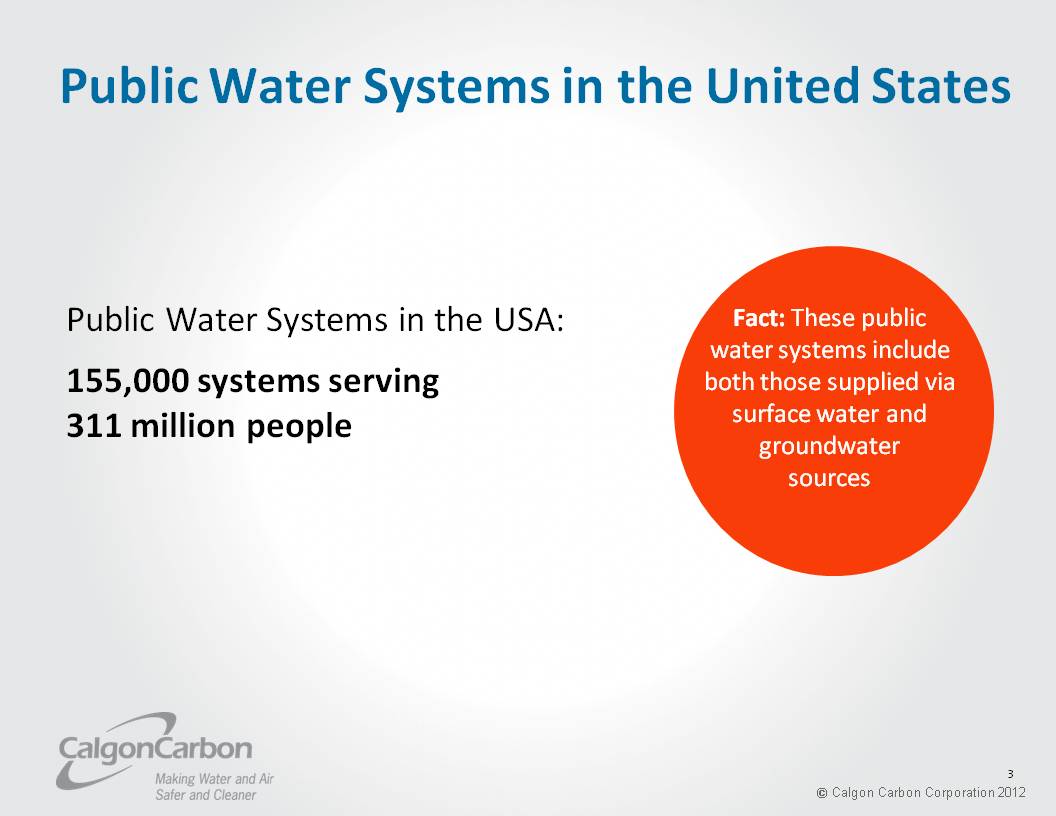
Public Water Systems in the United States Public Water Systems in the USA: 155,000 systems serving 311 million people Fact: These public water systems include both those supplied via surface water and groundwater sources 3
Public Water Systems in the United States Of these 155,000 systems, only a portion are relevant to Calgon Carbon… To establish the relevant portion of the market, we first focus on the 52,000 Community Water Systems which serve 292 million people 4
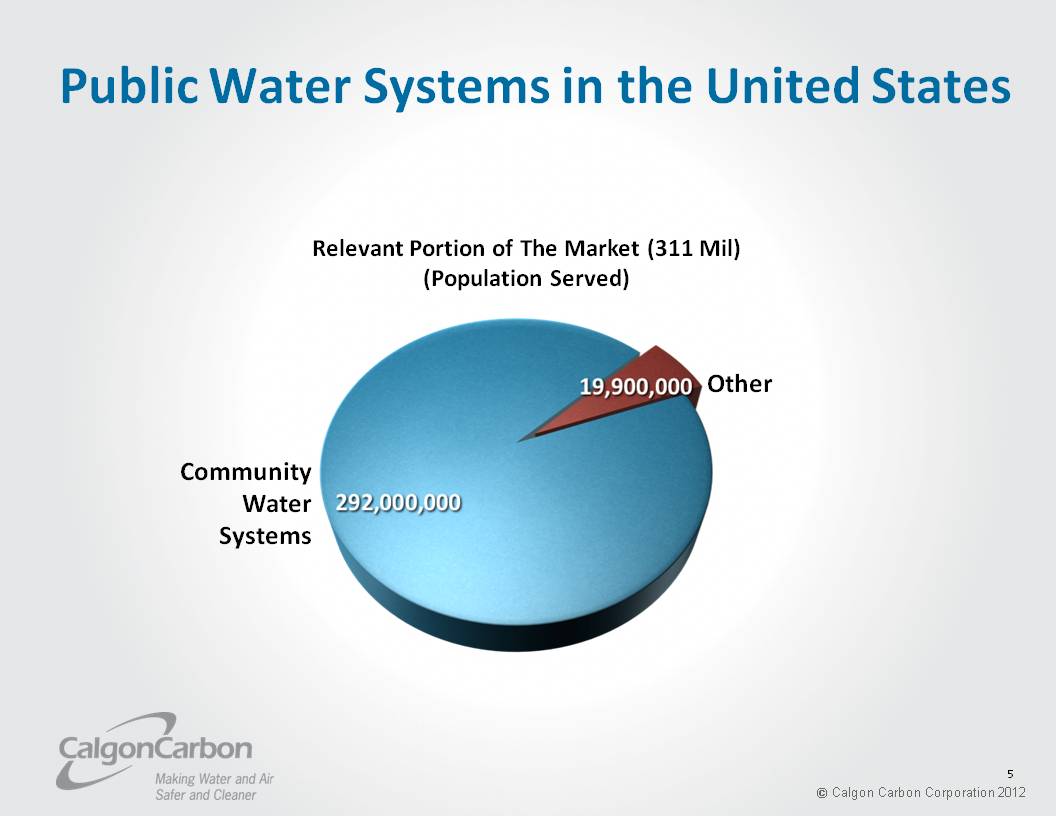
Public Water Systems in the United States Relevant Portion of The Market (311 Mil) (Population Served) Community Water Systems 292,000,000 Other 19,900,000 5
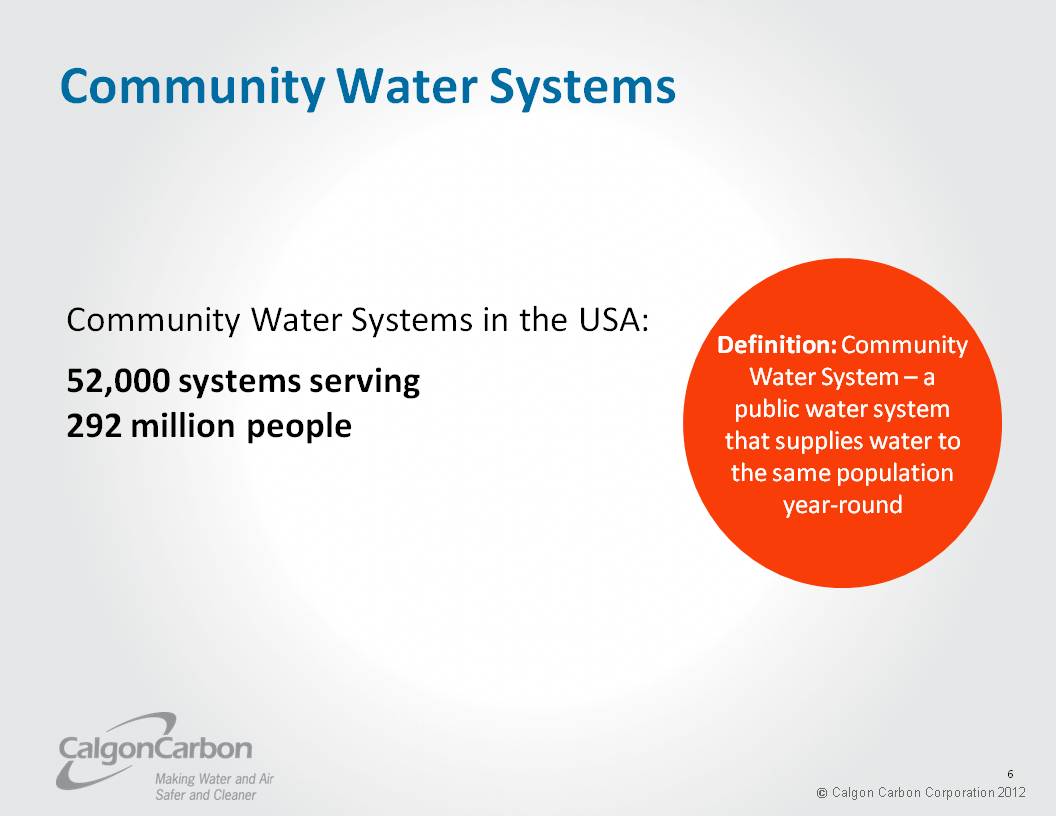
Community Water Systems Community Water Systems in the USA: 52,000 systems serving 292 million people Definition: Community Water System – a public water system that supplies water to the same population year-round 6
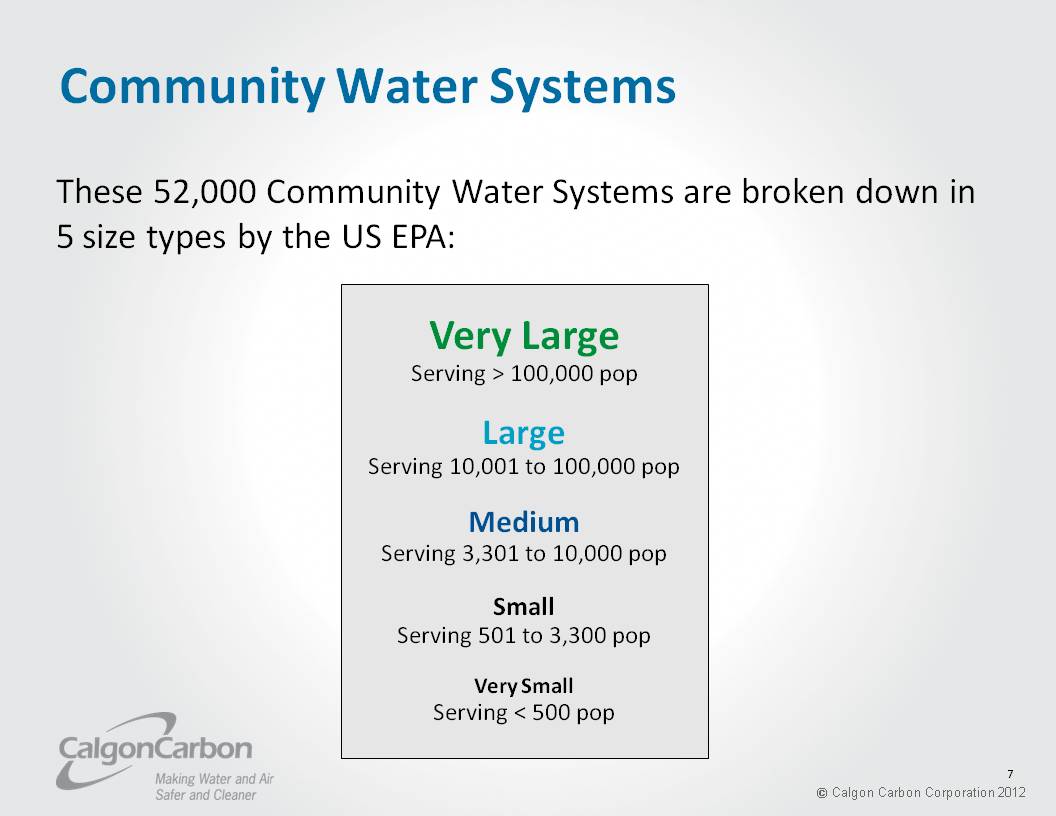
Community Water Systems These 52,000 Community Water Systems are broken down in 5 size types by the US EPA: Very Large Serving > 100,000 pop Large Serving 10,001 to 100,000 pop Medium Serving 3,301 to 10,000 pop Small Serving 501 to 3,300 pop Very Small Serving < 500 pop 7
Community Water Systems We want to next focus on the Very Large, Large, and Medium Systems, which are the ones Calgon Carbon is best suited to pursue 8
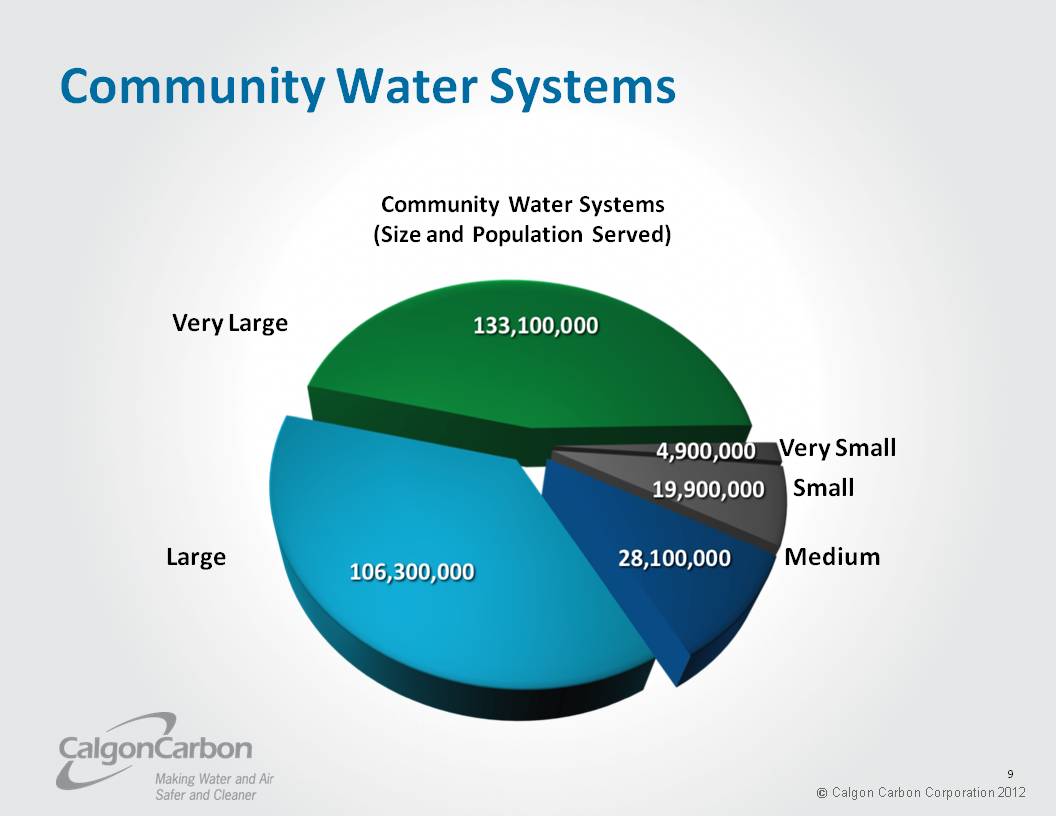
Community Water Systems Community Water Systems (Size and Population Served) Very Large 133,100,000 Large 106,300,000 Medium 28,100,000 Small 19,900,000 Very Small 4,900,000 9
Community Water Systems Calgon Carbon’s RELEVANT municipal drinking water market space: 8,900 systems serving 267,500,000 (86% of the population) 10
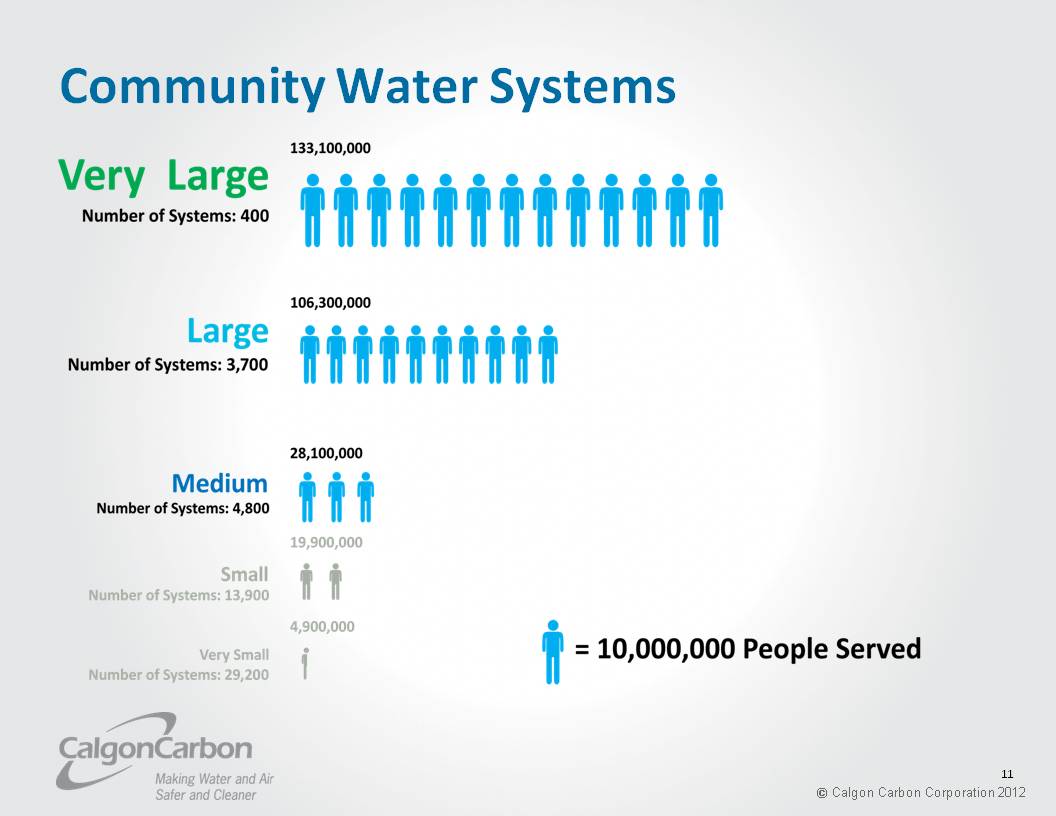
Community Water Systems Very Large 133,100,000 Number of Systems: 400 Large 106,300,000 Number of Systems: 3,700 Medium 28,100,000 Number of Systems: 4,800 Small 19,900,000 Number of Systems: 13,900 Very Small 4,900,000 Number of Systems: 29,200 11
Community Water Systems Next, we want to further refine our focus to the systems which must address our primary market driver, compliance with the Stage 2 Disinfectants and Disinfection Byproducts Rule (DBPR) But first, what is a Disinfection By-Product (DBP)? 12
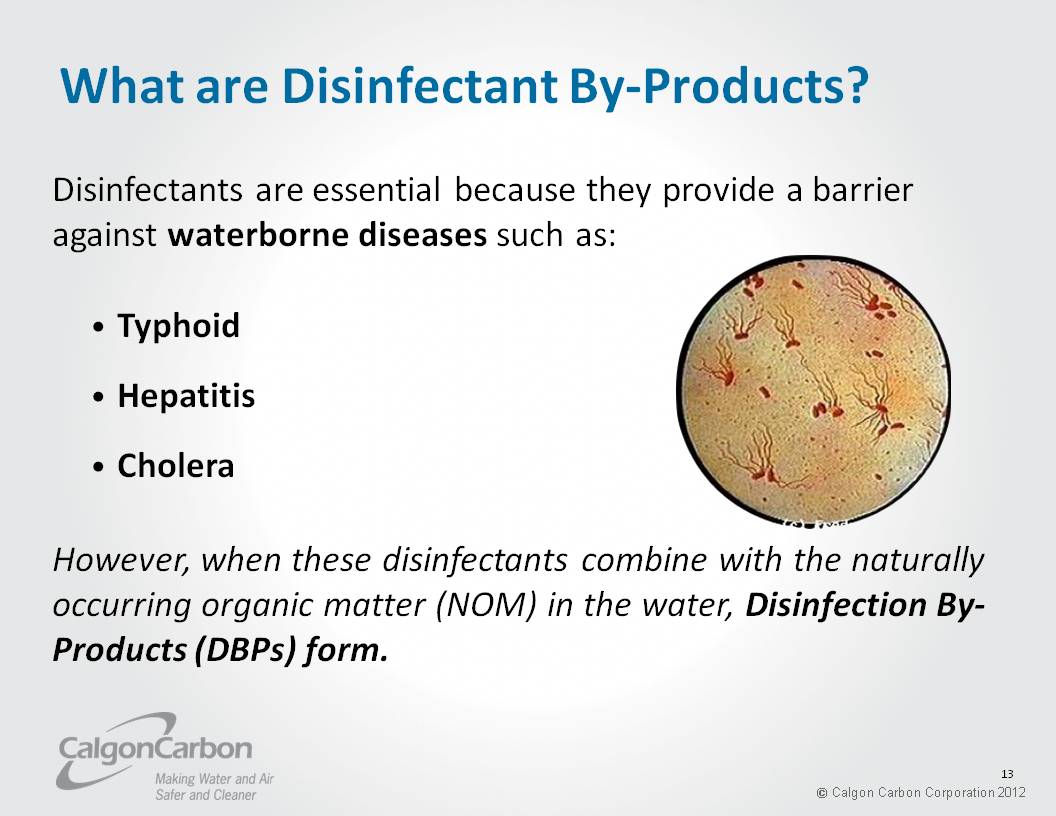
What are Disinfectant By-Products? Disinfectants are essential because they provide a barrier against waterborne diseases such as: Typhoid Hepatitis Cholera However, when these disinfectants combine with the naturally occurring organic matter (NOM) in the water, Disinfection By-Products (DBPs) form. 13
Why are DBPs Regulated? Increased Health Risks Cancer Bladder, Anal, Intestinal Reproductive and Developmental Effects Spontaneous abortion Birth defects Growth delay 14
Disinfection By-Products and our Market Space DBPs are primarily a surface water issue! Some groundwater sources which are under the influence of surface water can have DBP issues Some groundwater sources with naturally high levels of organic matter (e.g. Texas, Florida) can also have DBP issues Our DBP market space is defined by the surface water portion of the Community Water Systems in the United States In the Very Large / Large / Medium US EPA size categories 15
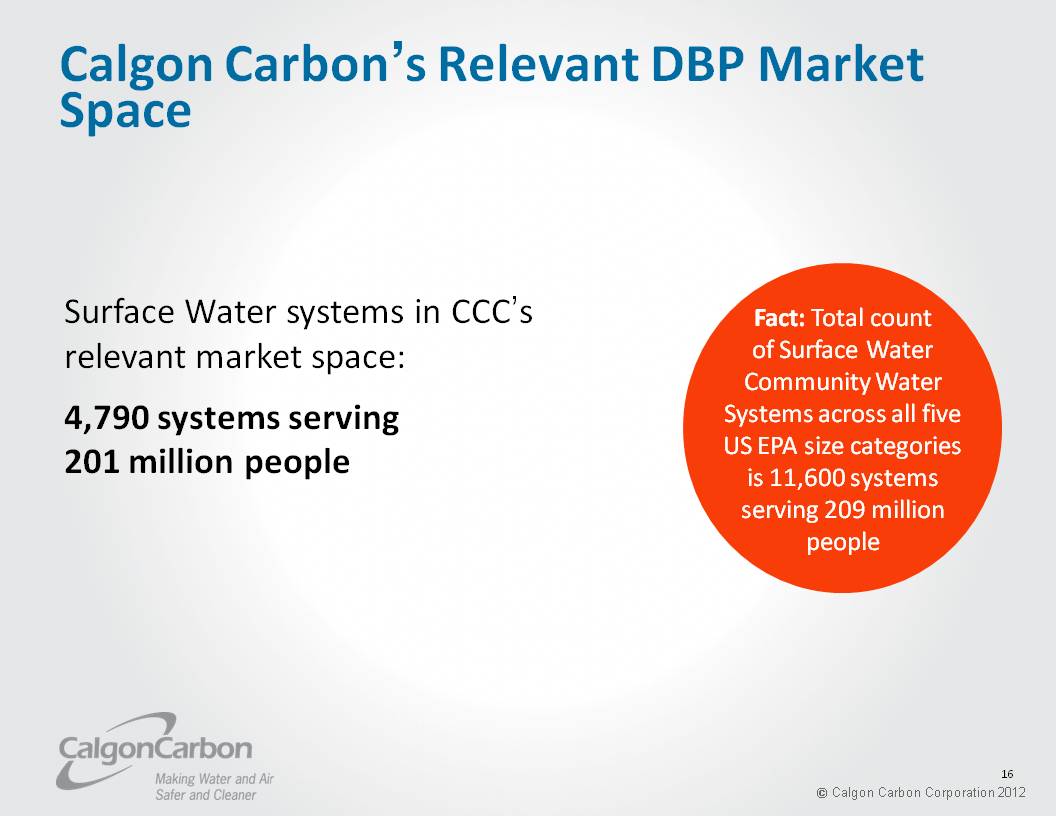
Calgon Carbon’s Relevant DBP Market Space Surface Water systems in CCC’s relevant market space: 4,790 systems serving 201 million people Fact: Total count of Surface Water Community Water Systems across all five US EPA size categories is 11,600 systems serving 209 million people 16
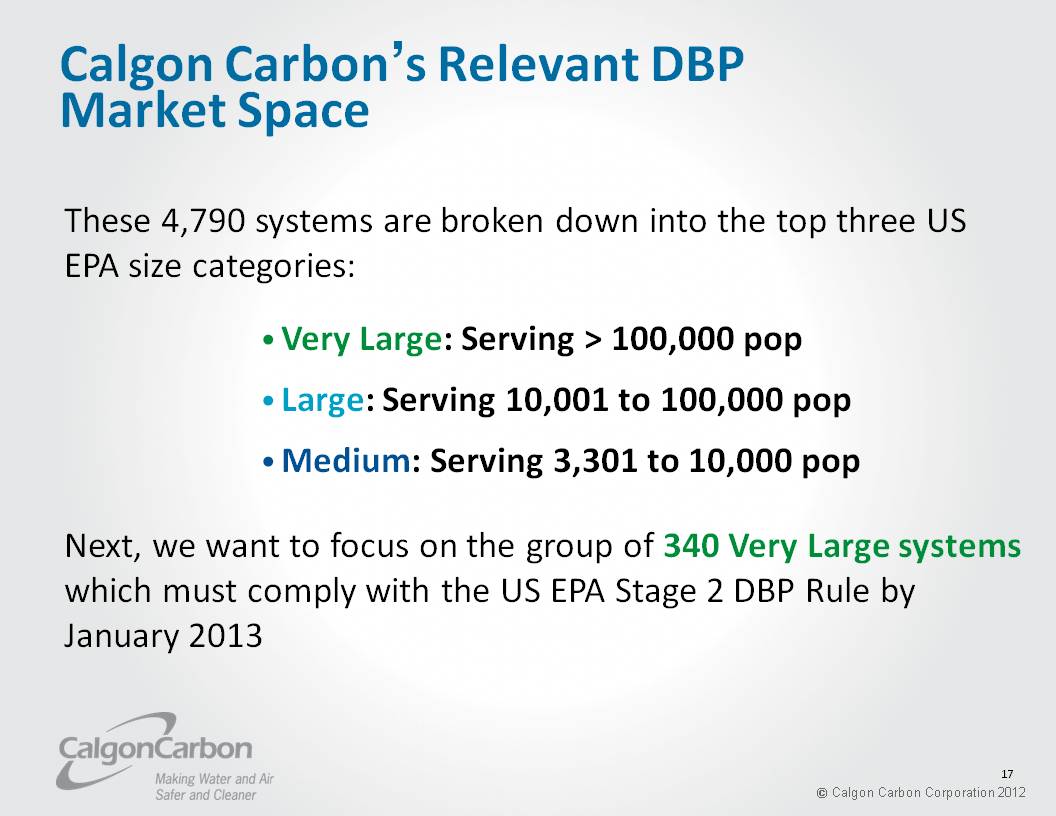
Calgon Carbon’s Relevant DBP Market Space These 4,790 systems are broken down into the top three US EPA size categories: Very Large: Serving > 100,000 pop Large: Serving 10,001 to 100,000 pop Medium: Serving 3,301 to 10,000 pop Next, we want to focus on the group of 340 Very Large systems which must comply with the US EPA Stage 2 DBP Rule by January 2013 17
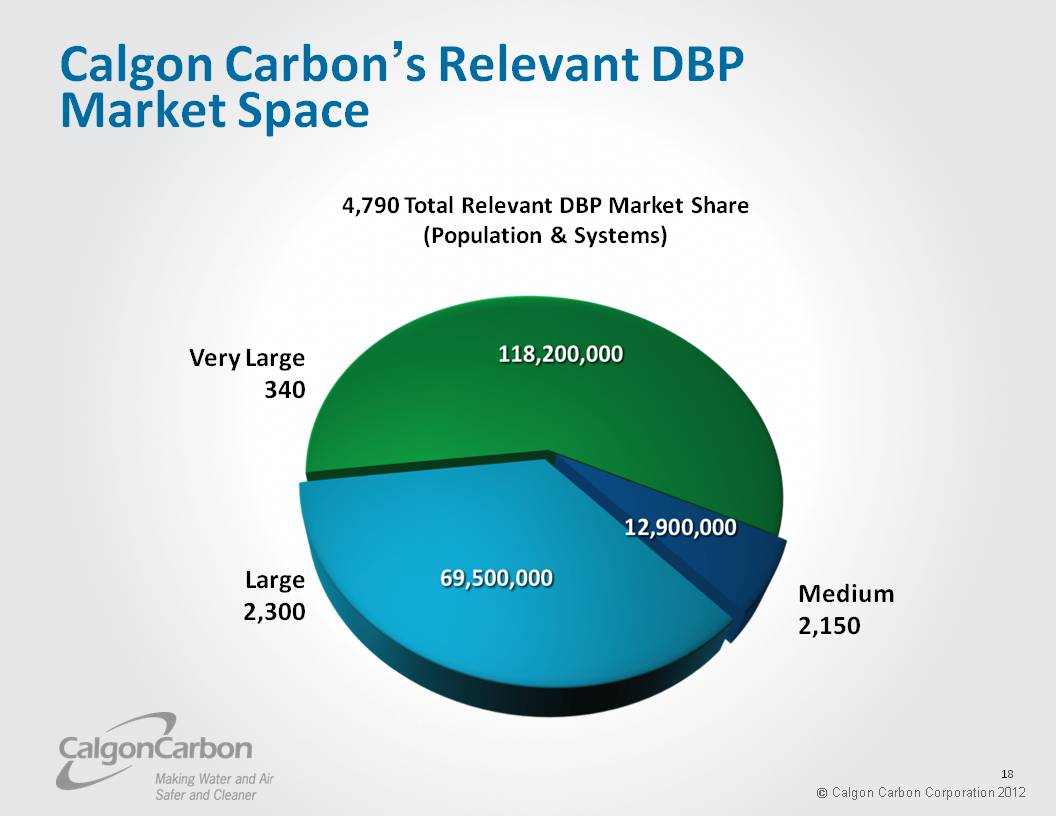
Calgon Carbon’s Relevant DBP Market Space 4,790 Total Relevant DBP Market Share (Population & Systems) Medium 2,150 12,900,000 Large 2,300 69,500,000 Very Large 340 118,200,000 18
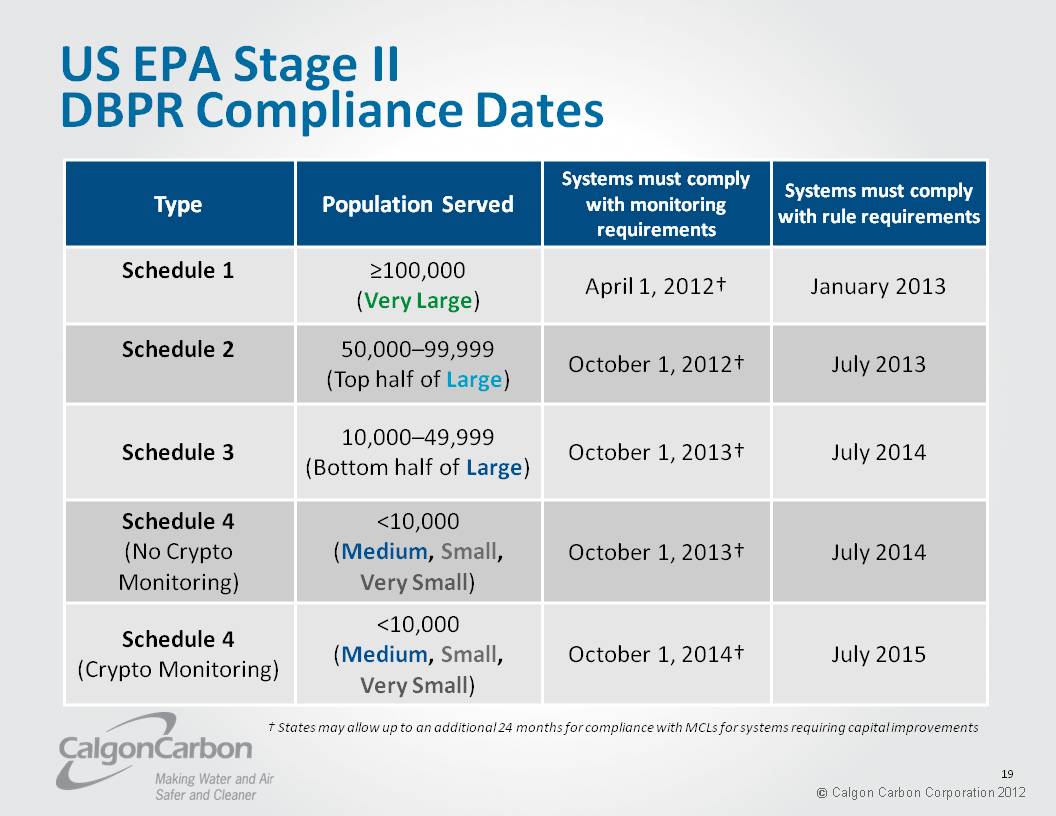
US EPA Stage II DBPR Compliance Dates Type Population Served Systems must comply with monitoring requirements Systems must comply with rule requirements Schedule 1 ≥100,000 (Very Large) April 1, 2012 January 2013 Schedule 2 50,000-99,999 (Top half of Large) October 1, 2012 July 2013 Schedule 3 10,000-49,999 (Bottom half of Large) October 1, 2013 July 2014 Schedule 4 (No Crypto Monitoring) <10,000 (Medium, Small, Very Small) October 1, 2013 July 2014 Schedule 4 (Crypto Monitoring) <10,000 (Medium, Small, Very Small) October 1, 2014 July 2015 States may allow up to an additional 24 months for compliance with MCLs for systems requiring capital improvements 19
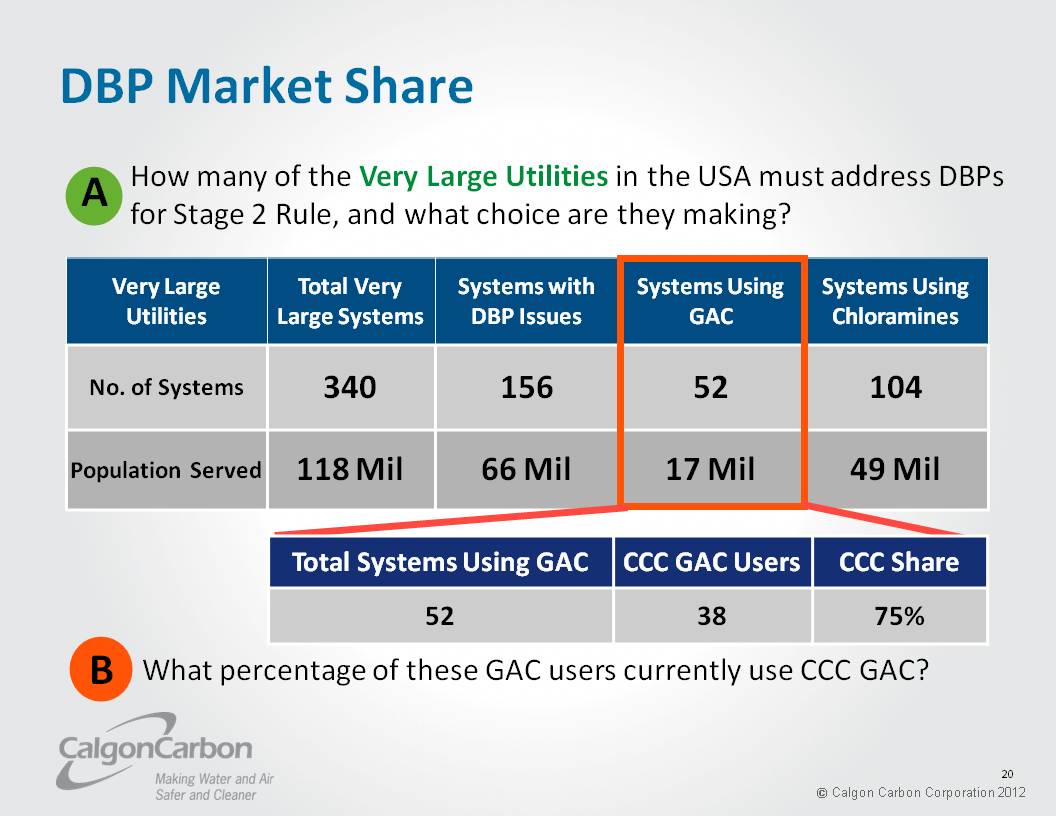
DBP Market Share A How many of the Very Large Utilities in the USA must address DBPs for Stage 2 Rule, and what choice are they making? Very Large Utilities Total Very Large Systems Systems with DBP Issues Systems Using GAC Systems Using Chloramines No. of systems 340 156 52 104 Population Served 118 Mil 66 Mil 17 Mil 49 Mil Total Systems Using GAC CCC GAC Users CCC Share 52 38 75% B What percentage of these GAC users currently use CCC GAC? 20
Growth of GAC in Municipal Drinking Water Market DBP regulation has already begun to have an impact on the GAC marketplace, and will continue for some years to come, with projected growth through 2017 Graph on the following slide includes both virgin and custom reactivated pounds 21
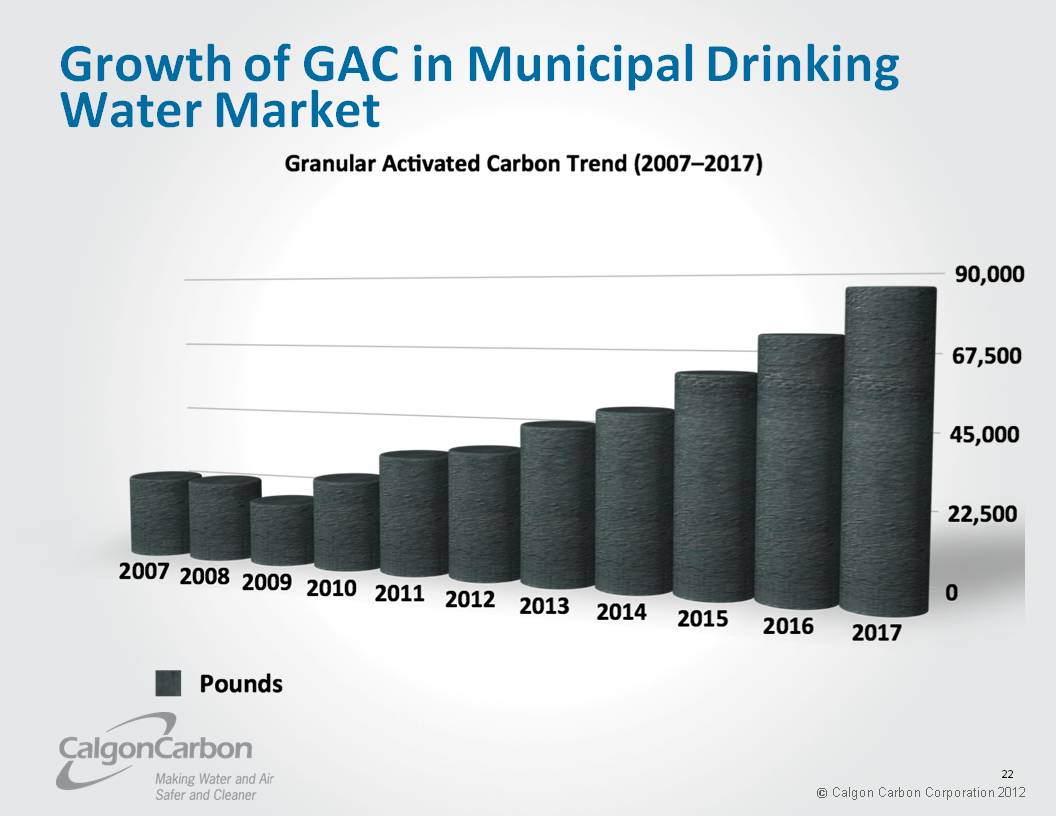
Growth of GAC in Municipal Drinking Water Market Granular Activated Carbon Trend (2007-2017) 22
DBP Market Opportunity Our main market opportunity is to target Very Large Utilities that: A) Do not use GAC B) Use chloramines for disinfection C) Are therefore candidates for GAC adoption if chloramine use becomes untenable due to political pressure and/or new regulations The same criteria used for Very Large Utilities will be applied to target Large and Medium municipalities 23
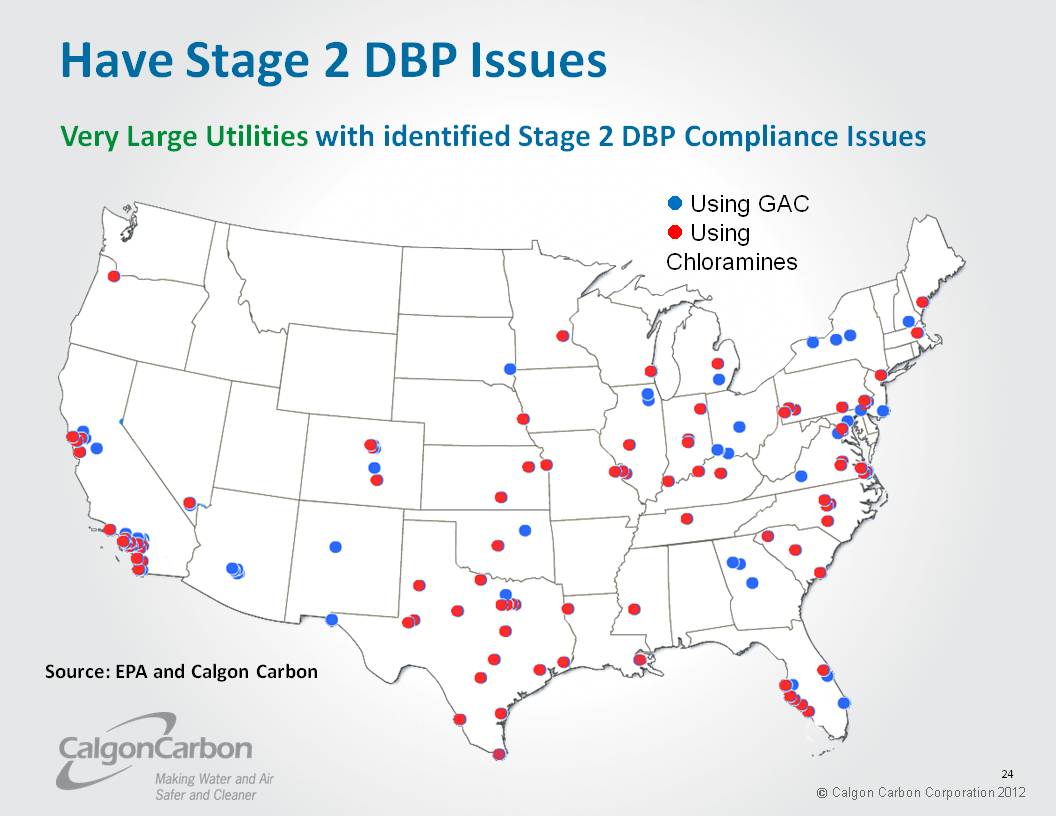
Have Stage 2 DBP Issues Very Large Utilities with identified Stage 2 DBP Compliance Issues Using GAC Using Chloramines Source: EPA and Calgon Carbon 24
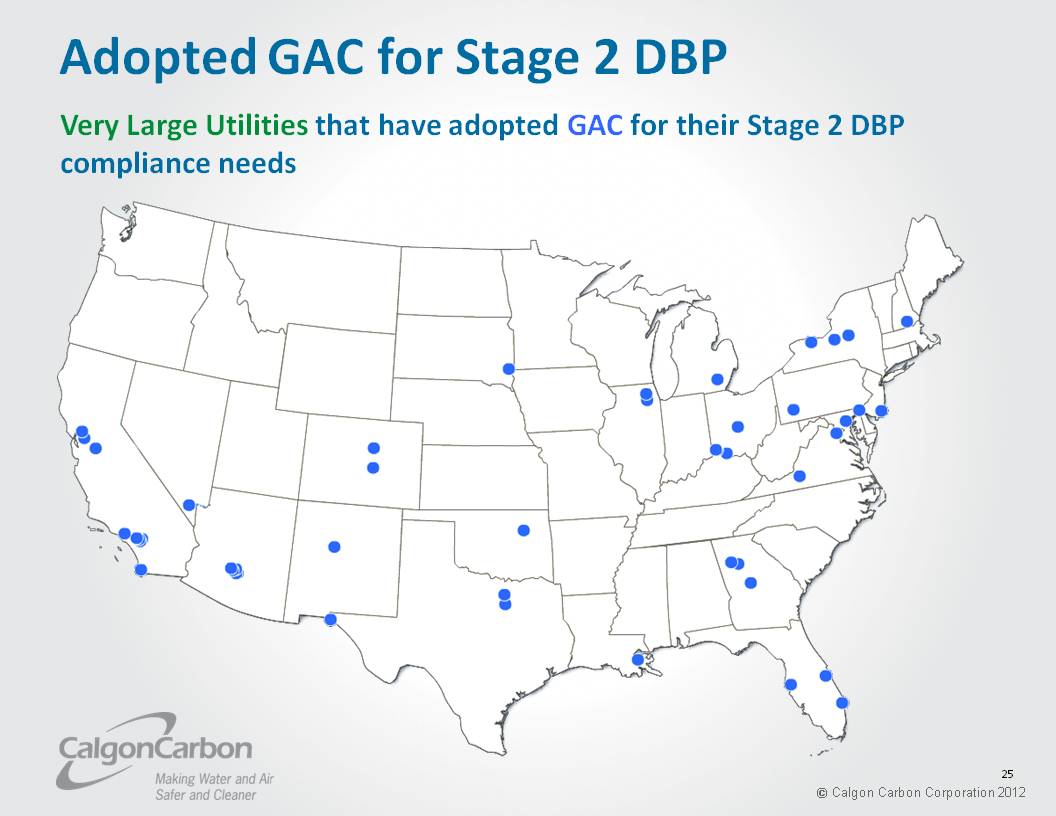
Adopted GAC for Stage 2 DBP Very Large Utilities that have adopted GAC for their Stage 2 DBP compliance needs 25
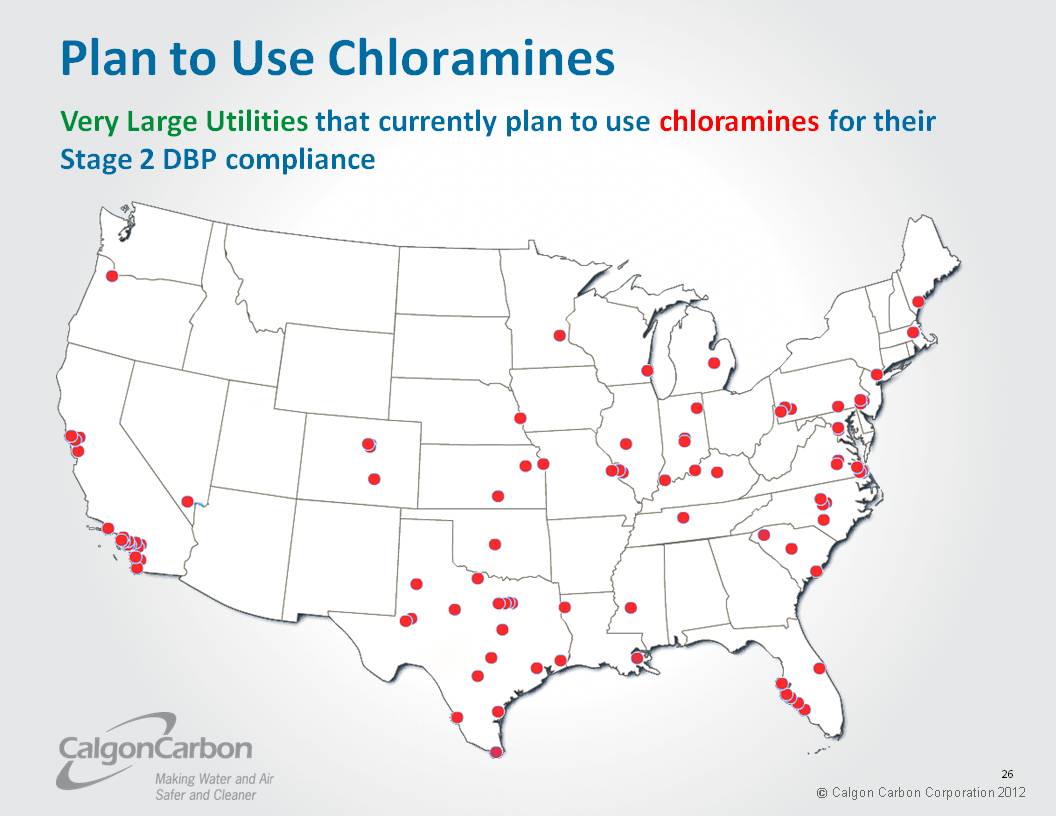
Plan to Use Chloramines Very Large Utilities that currently plan to use chloramines for their Stage 2 DBP compliance 26
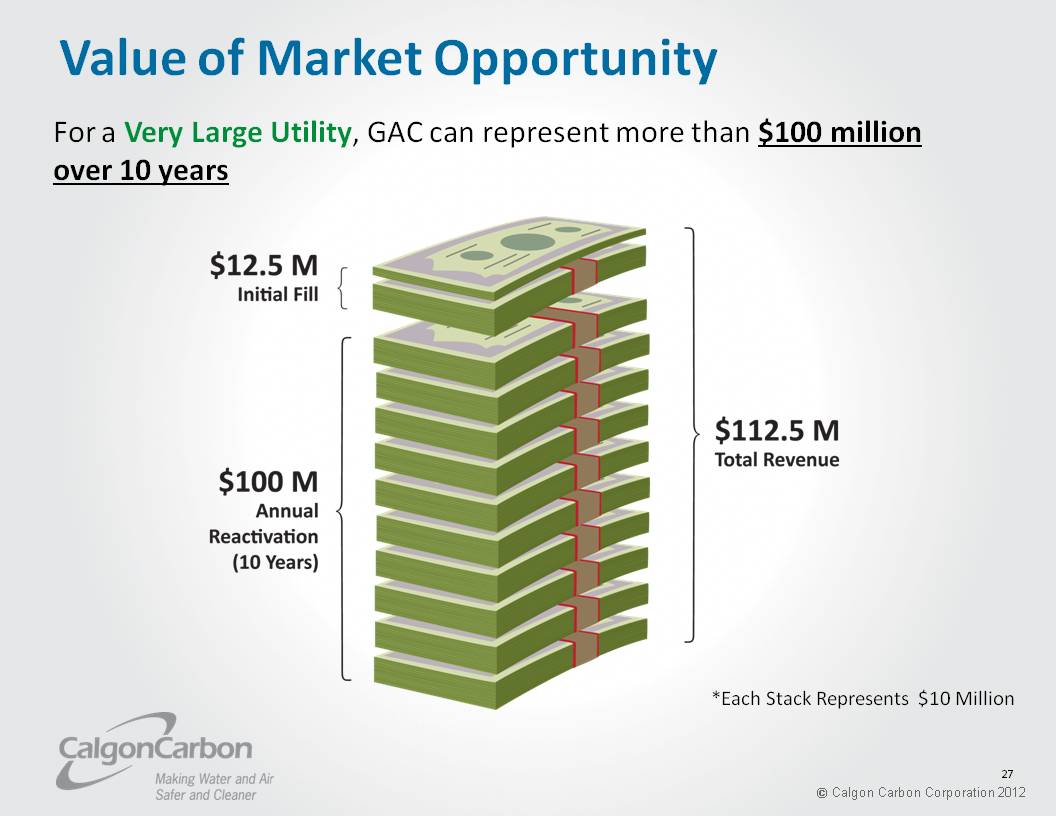
Value of Market Opportunity For a Very Large Utility, GAC can represent more than $100 million over 10 years $12.5 M Initial Fill $100 M Annual Reactivation (10 Years) $112.5 M Total Revenue *Each Stack Represents $10 Million 27
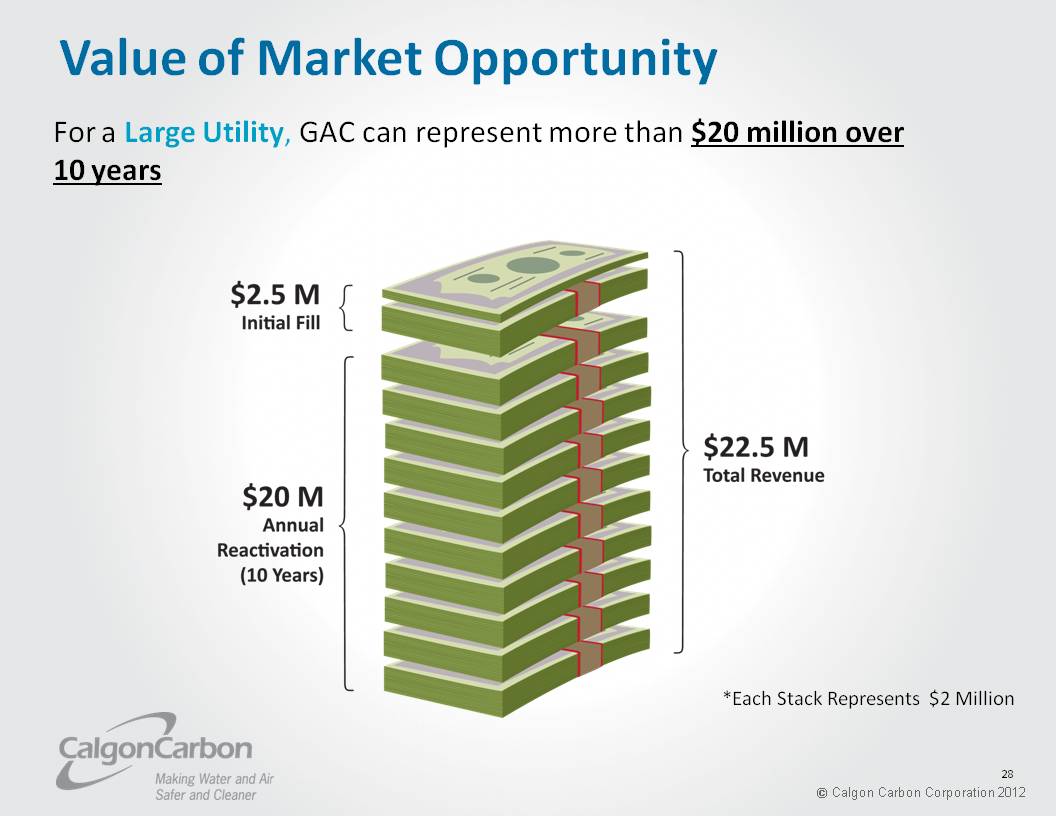
Value of Market Opportunity For a Large Utility, GAC can represent more than $20 million over 10 years $2.5 M Initial Fill $20 M Annual Reactivation (10 Years) $22.5 M Total Revenue *Each Stack Represents $2 Million 28
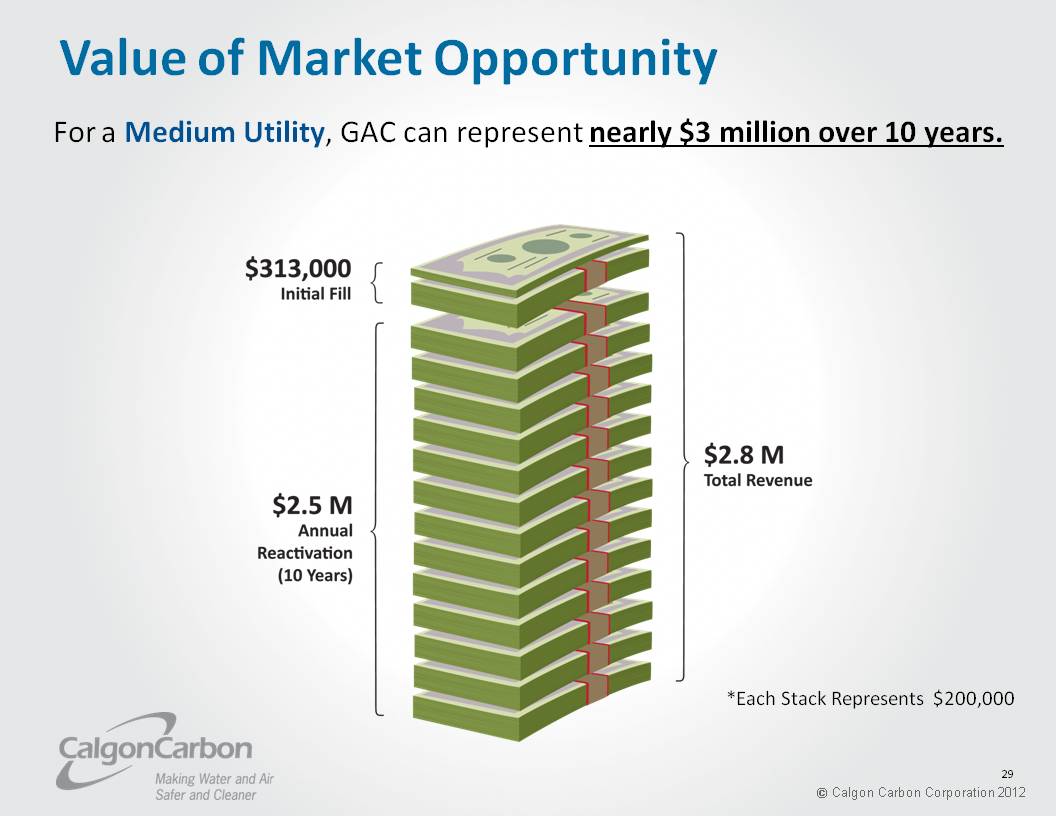
Value of Market Opportunity For a Medium Utility, GAC can represent nearly $3 million over 10 years. $313,000 Initial Fill $2.5 M Annual Reactivation (10 Years) $2.8 M Total Revenue *Each Stack Represents $200,000 29
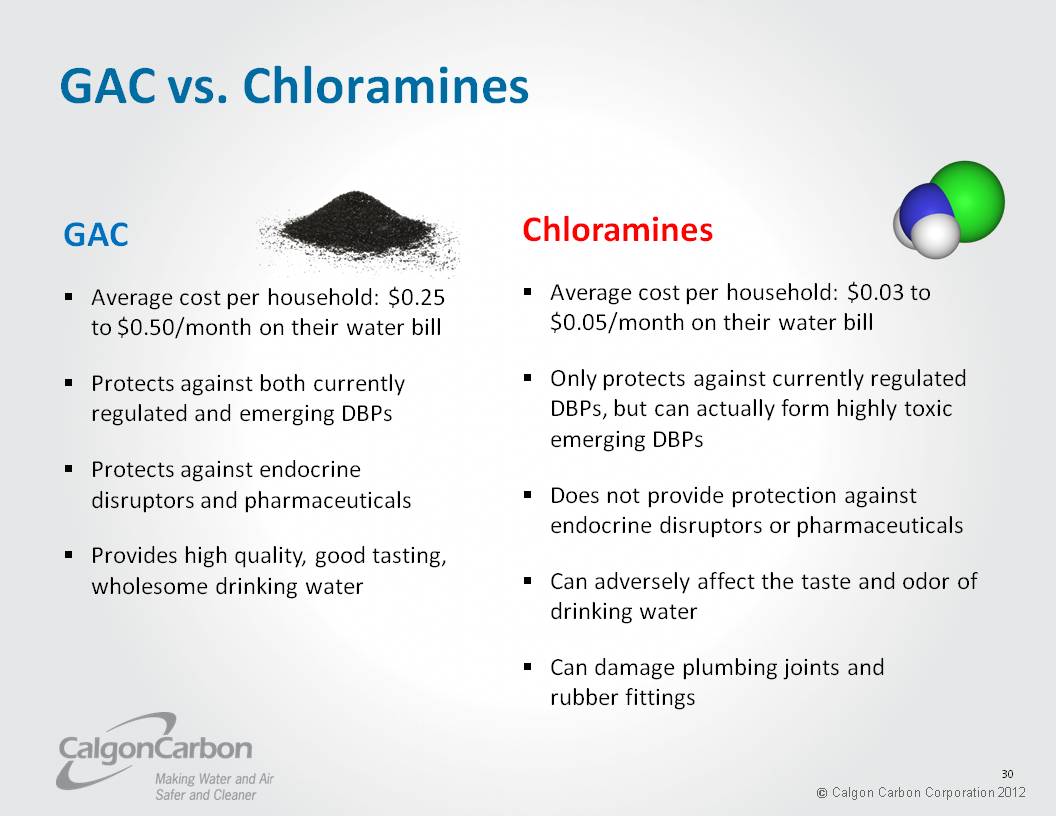
GAC vs. Chloramines GAC Average cost per household: $0.25 to $0.50/month on their water bill Protects against both currently regulated and emerging DBPs Protects against endocrine disruptors and pharmaceuticals Provides high quality, good tasting, wholesome drinking water Chloramines Average cost per household: $0.03 to $0.05/month on their water billOnly protects against currently regulated DBPs, but can actually form highly toxic emerging DBPs Does not provide protection against endocrine disruptors or pharmaceuticalsCan adversely affect the taste and odor of drinking water Can damage plumbing joints and rubber fittings 30
Calgon Carbon DBP Value Proposition For surface water utilities struggling to treat multiple contaminants and comply with various regulations, Calgon Carbon Corporation can provide a single product with related services that simultaneously solves all of these treatment challenges. 31
Calgon Carbon DBP Value Proposition Calgon Carbon’s FILTRASORB® brand activated carbon effectively removes taste and odor compounds, regulated and emerging disinfection by-products and their organic precursors, and pesticides. It also provides a barrier against endocrine disrupting compounds and pharmaceuticals—performance that no other single activated carbon product can deliver. 32
Calgon Carbon DBP Value Proposition FILTRASORB®, coupled with custom potable reactivation, delivers this simultaneous treatment performance at a lifecycle cost 10% to 50% lower than any other activated carbon product in the industry, while also reducing greenhouse gas emissions as much as 80%, compared to the use of other virgin activated carbons. 33
What are we doing to educate and influence the market? 34
Sales and Marketing There are four groups to whom we “sell”: The Municipality The ultimate user of our products. They operate the drinking water facilities. The Consulting Engineers They work for the municipality and often specify and select the products that will be purchased by the municipality. 35
Sales and Marketing There are four groups to whom we “sell”: (cont.) The Regulators Both federal and state water regulators establish and enforce water regulations that drive our business. The Contractors The municipality contracts with construction companies to build and expand their water treatment facilities, generally in accordance with the specifications prepared by the Consulting Engineers. 36
Sales and Marketing Calgon Carbon uses a differentiation strategy as its primary approach to the municipal market, employing a low cost strategy only when necessary case studies, and reference lists of previous installations to emphasize superior performance and experience Face-to-Face Sales Calls Visits to municipal facilities, consulting engineers’ offices, and contractors’ offices 37
Sales and Marketing Seminars Stage live regional technical seminars to educate and influence utilities, consultants, and regulators; Introducing webinars to augment live seminarsTrade Shows and Conferences Attend, present, and exhibit at regional and national trade shows to promote our products Government Affairs Meet with legislators and regulators to advance our agenda 38
Sales and Marketing Publication/Presentation of Articles and Technical Paperssome authored by CCC, others authored by third partiesDirect Mail Campaigns Mail information to lists of municipalities and consulting engineers to inform and generate business opportunities Web Site Information provided to potential sales contacts 39
Copyrighted Materials This educational information is protected by U.S. and international copyright laws. Reproduction, distribution, display, and use of the educational information without written permission of the presenter is prohibited. 40

Questions? Thank you for your attention Calgon Carbon Corporation 2012 41