Attached files
| file | filename |
|---|---|
| 8-K - FORM 8-K - HOME LOAN SERVICING SOLUTIONS, LTD. | d445641d8k.htm |
Exhibit 99.1
HLSS HOME LOAN TM
SERVICING
SOLUTIONS
J.P. Morgan
SMid Cap Conference
November 28, 2012
HLSS HOME LOAN TM
SERVICING
SOLUTIONS
FORWARD-LOOKING STATEMENT:
Our presentation may contain certain forward-looking statements that are made pursuant to the Safe Harbor provisions of the federal securities laws. These forward-looking statements may be identified by a reference to a future period or by the use of forward-looking terminology. They may involve risks and uncertainties that could cause the company’s actual results to differ materially from the results discussed in the forward-looking statements.
NON-GAAP MEASURES:
Our presentation contains references to cash generated available for distribution, cash generated available for reinvestment, servicing revenue and servicing expense, which are non-GAAP performance measures. We believe these non-GAAP performance measures may provide additional meaningful comparisons between current results and results in prior periods. Non-GAAP performance measures should be viewed in addition to, and not as an alternative for, the Company’s reported results under accounting principles generally accepted in the United States.
2
HLSS Overview
HLSS HOME LOAN TM
SERVICING
SOLUTIONS
Business
Value Proposition
Growth Plan
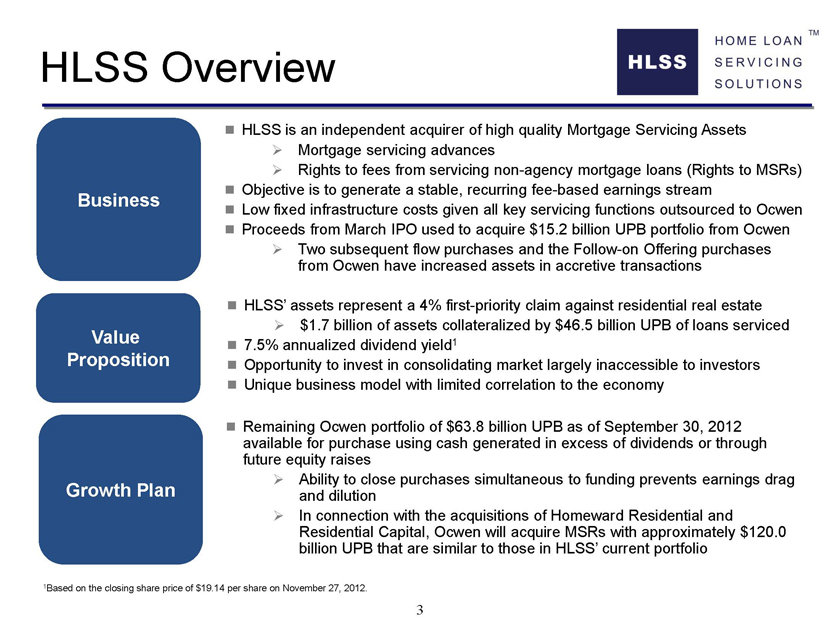
HLSS is an independent acquirer of high quality Mortgage Servicing Assets
Mortgage servicing advances
Rights to fees from servicing non-agency mortgage loans (Rights to MSRs)
Objective is to generate a stable, recurring fee-based earnings stream
Low fixed infrastructure costs given all key servicing functions outsourced to Ocwen
Proceeds from March IPO used to acquire $15.2 billion UPB portfolio from Ocwen
Two subsequent flow purchases and the Follow-on Offering purchases from Ocwen have increased assets in accretive transactions
HLSS’ assets represent a 4% first-priority claim against residential real estate
$1.7 billion of assets collateralized by $46.5 billion UPB of loans serviced
7.5% annualized dividend yield1
Opportunity to invest in consolidating market largely inaccessible to investors
Unique business model with limited correlation to the economy
Remaining Ocwen portfolio of $63.8 billion UPB as of September 30, 2012 available for purchase using cash generated in excess of dividends or through future equity raises
Ability to close purchases simultaneous to funding prevents earnings drag and dilution
In connection with the acquisitions of Homeward Residential and Residential Capital, Ocwen will acquire MSRs with approximately $120.0 billion UPB that are similar to those in HLSS’ current portfolio
1Based on the closing share price of $19.14 per share on November 27, 2012.
3
Leadership Team
HLSS HOME LOAN TM
SERVICING
SOLUTIONS
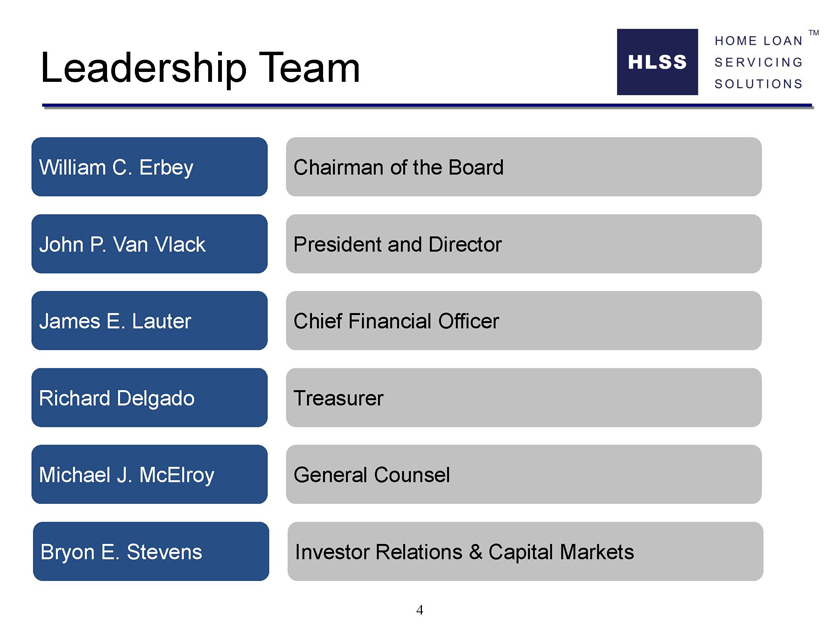
William C. Erbey Chairman of the Board
John P. Van Vlack President and Director
James E. Lauter Chief Financial Officer
Richard Delgado Treasurer
Michael J. McElroy General Counsel
Bryon E. Stevens Investor Relations & Capital Markets
4
Q3 Highlights
HLSS HOME LOAN TM
SERVICING
SOLUTIONS
Earned net income of $6.572 million, or $0.37 per share, in the third quarter of operations
Earnings include a $0.03 per share benefit from reduced amortization due to several factors that reduced the prepayment speed to 12.6% from 15.2% in the second quarter
Gross proceeds of $249.9 million from a follow-on offering of 16.388 million common shares priced at $15.25 per share
Net Book value per share increased to $13.67 from $12.82 at June 30, 2012 due primarily to accretion from the follow-on offering
Purchases of mortgage servicing assets representing $29.9 billion of unpaid principal balance (“UPB”)
Ending UPB of $46.5 billion and advance to UPB ratio of 3.11%
5
Limited Valuation Risk
HLSS HOME LOAN TM
SERVICING
SOLUTIONS
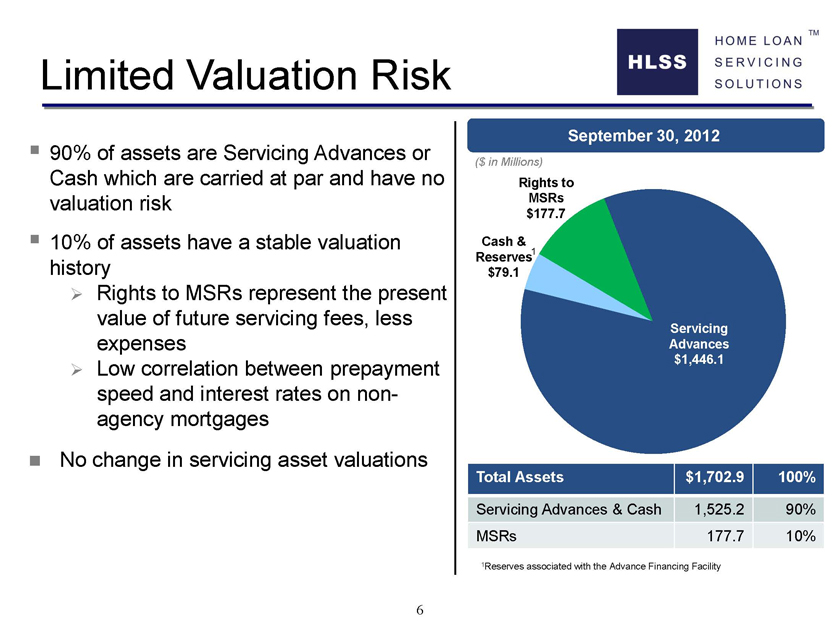
? 90% of assets are Servicing Advances or Cash which are carried at par and have no valuation risk? 10% of assets have a stable valuation history? Rights to MSRs represent the present value of future servicing fees, less expenses? Low correlation between prepayment speed and interest rates on nonagency mortgages? No change in servicing asset valuations
September 30, 2012
($ in Millions)
Rights to MSRs $177.7
Cash & Reserves1 $79.1
Servicing Advances $1,446.1
Total Assets $1,702.9 100%
Servicing Advances & Cash 1,525.2 90%
MSRs 177.7 10%
1Reserves associated with the Advance Financing Facility
6
Note Issuance Reduces Costs and Increases Tenor
HLSS HOME LOAN TM
SERVICING
SOLUTIONS
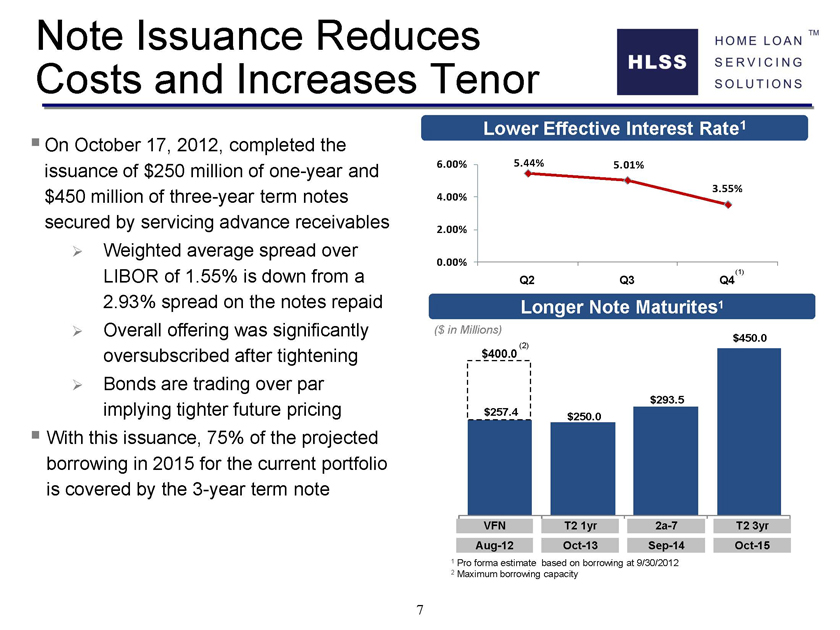
On October 17, 2012, completed the issuance of $250 million of one-year and $450 million of three-year term notes secured by servicing advance receivables
Weighted average spread over LIBOR of 1.55% is down from a 2.93% spread on the notes repaid
Overall offering was significantly oversubscribed after tightening
Bonds are trading over par implying tighter future pricing
With this issuance, 75% of the projected borrowing in 2015 for the current portfolio is covered by the 3-year term note
Lower Effective Interest Rate1
6.00%
4.00%
2.00%
0.00%
5.44%
5.01%
3.55%
(1)
Q2 Q3 Q4
Longer Note Maturites1
($ in Millions)
$400.0(2)
$257.4
$250.0
$293.5
$450.0
VFN T2 1yr 2a-7 T2 3yr
Aug-12 Oct-13 Sep-14 Oct-15
1 Pro forma estimate based on borrowing at 9/30/2012
2 Maximum borrowing capacity
7
Ocwen Contract Ties Servicing Fees to Advance Ratio
HLSS HOME LOAN TM
SERVICING
SOLUTIONS
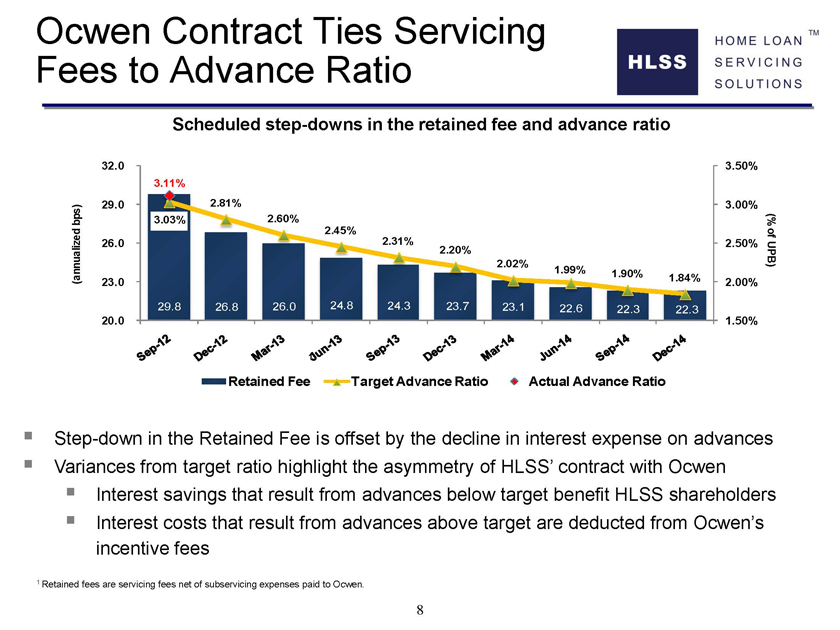
Scheduled step-downs in the retained fee and advance ratio
(annualized bps)
32.0
29.0
26.0
23.0
20.0
3.11%
3.03%
29.8
Sep-12
2.81%
26.8
Dec-12
2.60%
26.0
Mar-13
2.45%
24.8
Jun-13
2.31%
24.3
Sep-13
2.20%
23.7
Dec-13
2.02%
23.1
Mar-14
1.99%
22.6
Jun-14
1.90%
22.3
Sep-14
1.84%
22.3
Dec-14
3.50%
3.00%
2.50%
2.00%
1.50%
(% of UPB)
Retained Fee Target Advance Ratio Actual Advance Ratio
? Step-down in the Retained Fee is offset by the decline in interest expense on advances? Variances from target ratio highlight the asymmetry of HLSS’ contract with Ocwen? Interest savings that result from advances below target benefit HLSS shareholders? Interest costs that result from advances above target are deducted from Ocwen’s incentive fees
1 Retained fees are servicing fees net of subservicing expenses paid to Ocwen.
8
Components of Income
HLSS HOME LOAN TM
SERVICING
SOLUTIONS
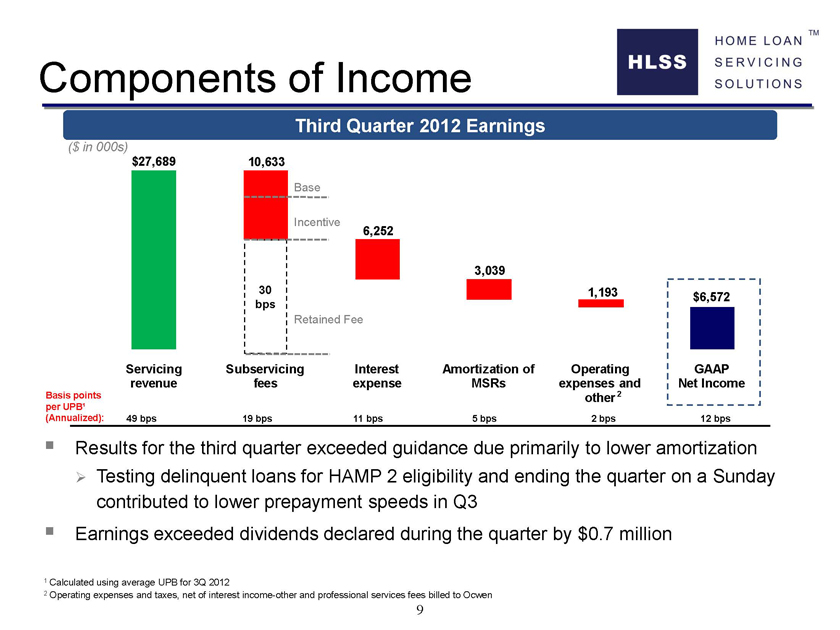
Third Quarter 2012 Earnings
($ in 000s)
$27,689
10,633
30 bps
Base
Incentive
Retained Fee
6,252
3,039
1,193
$6,572
GAAP
Net Income
Servicing Subservicing Interest Amortization of Operating
revenue fees expense MSRs expenses and
Basis points other 2
per UPB¹
(Annualized): 49 bps 19 bps 11 bps 5 bps 2 bps
12 bps
? Results for the third quarter exceeded guidance due primarily to lower amortization ? Testing delinquent loans for HAMP 2 eligibility and ending the quarter on a Sunday contributed to lower prepayment speeds in Q3? Earnings exceeded dividends declared during the quarter by $0.7 million
1 Calculated using average UPB for 3Q 2012
2 Operating expenses and taxes, net of interest income-other and professional services fees billed to Ocwen
9

Components of Cash Flow
HLSS HOME LOAN TM
SERVICING
SOLUTIONS
Third Quarter 2012 Cash Flow
($ in 000s)
$6,572
3,039
11,399
1,044
$22,054
5,898
4x Dividend Coverage
$16,156
Net Income Amortization of Decrease in Changes in Cash Dividends Cash
MSRs advance other assets / generated declared Reinvested
haircut1 liabilities available for
distribution
?Cash generated available for distribution remained at 4x the dividends declared?Cash reinvested of $16.2 million allowed HLSS to replenish and grow its servicing portfolio through flow purchases from Ocwen
1 Servicing advances, excluding the follow-on transactions, decreased by $10.3 million while borrowing increased by $1.1 million as the increase in the borrowing rate more than offset the decline in advances.
10
Accretive Follow-on Offering
HLSS HOME LOAN TM
SERVICING
SOLUTIONS
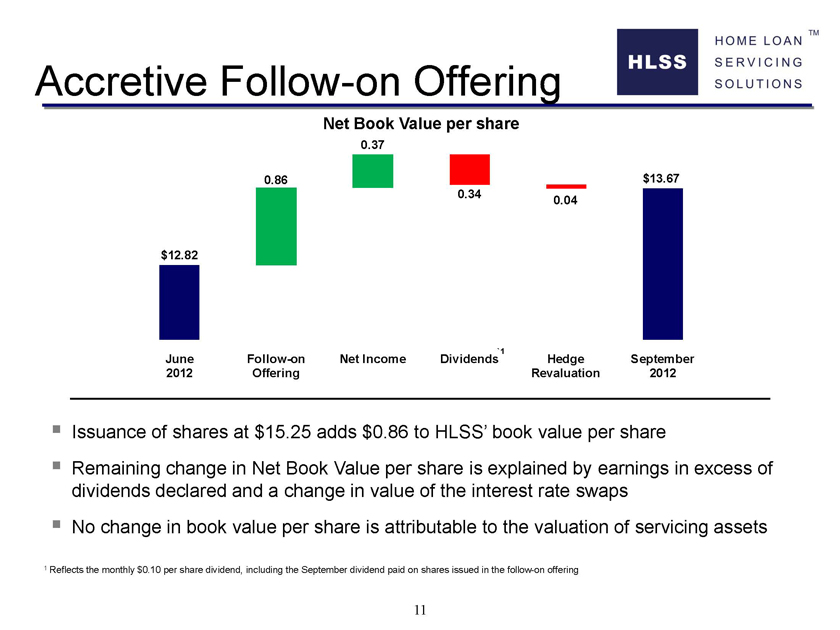
Net Book Value per share
$12.82
June 2012
0.86
Follow-on Offering
0.37
Net Income
0.34
1
Dividends
0.04
Hedge Revaluation
$13.67
September 2012
? Issuance of shares at $15.25 adds $0.86 to HLSS’ book value per share
? Remaining change in Net Book Value per share is explained by earnings in excess of dividends declared and a change in value of the interest rate swaps? No change in book value per share is attributable to the valuation of servicing assets
1 Reflects the monthly $0.10 per share dividend, including the September dividend paid on shares issued in the follow-on offering
11