Attached files
| file | filename |
|---|---|
| 8-K - 8-K - NELNET INC | nni93012form8-k.htm |
| EX-99.1 - PRESS RELEASE - NELNET INC | nni9302012earningsrelease.htm |
For Release: November 8, 2012
Media Contact: Ben Kiser, 402.458.3024
Investor Contact: Phil Morgan, 402.458.3038
Nelnet, Inc. supplemental financial information for the third quarter 2012
(All dollars are in thousands, except per share amounts, unless otherwise noted)
The following information should be read in connection with Nelnet, Inc.'s (the “Company's”) press release for third quarter 2012 earnings, dated November 8, 2012, and the Company's Quarterly Report on Form 10-Q for the quarter ended September 30, 2012.
This earnings supplement contains forward-looking statements and information that are based on management’s current expectations as of the date of this document. Statements that are not historical facts, including statements about the Company’s plans and expectations for future financial condition, results of operations or economic performance, or that address management’s plans and objectives for future operations, and statements that assume or are dependent upon future events, are forward-looking statements. The words “may,” “should,” “could,” “would,” “predict,” “potential,” “continue,” “expect,” “anticipate,” “future,” “intend,” “plan,” “believe,” “estimate,” “assume,” “forecast,” “will,” and similar expressions, as well as statements in future tense, are intended to identify forward-looking statements.
The forward-looking statements are based on assumptions and analysis made by management in light of management’s experience and its perception of historical trends, current conditions, expected future developments, and other factors that management believes are appropriate under the circumstances. These statements are subject to known and unknown risks, uncertainties, assumptions, and other factors that may cause the actual results and performance to be materially different from any future results or performance expressed or implied by such forward-looking statements. These factors include, among others, the risks and uncertainties set forth in the “Risk Factors” section included in the Company’s Annual Report on Form 10-K for the year ended December 31, 2011 and subsequent Quarterly Reports on Form 10-Q, and include such risks and uncertainties as:
• | risks related to the Company's student loan portfolio, such as interest rate basis and repricing risk resulting from the fact that the interest rate characteristics of the Company's student loan assets do not match the interest rate characteristics of the funding for those assets, the risk of loss of floor income on certain student loans originated under the Federal Family Education Loan Program (the “FFEL Program” or “FFELP”) of the U.S. Department of Education (the “Department”), risks related to the use of derivatives to manage exposure to interest rate fluctuations, and potential losses from loan defaults, changes in prepayment rates, guaranty rates, loan floor rates, and credit spreads; |
• | risks related to the Company's funding requirements, including the Company's ability to maintain credit facilities or obtain new facilities, the ability of lenders under the Company's credit facilities to fulfill their lending commitments under these facilities, the Company's ability to satisfy debt obligations secured by student loan assets and related collateral, and changes in the general interest rate environment and in the securitization markets for education loans, which may increase the costs or limit the availability of financings necessary to purchase, refinance, or continue to carry education loans; |
• | risks from changes in the student loan and educational credit and services marketplace resulting from the implementation of, or changes in, applicable laws, regulations, and government programs, including the discontinuance of private sector student loan originations under the FFEL Program effective July 1, 2010, and new regulations effective July 1, 2011 that could affect enrollment at for-profit schools, the uncertain nature of the potential impact of the Department's loan consolidation initiative or similar consolidation programs, and the Company’s ability to maintain or increase volumes under its loan servicing contract with the Department to service federally-owned student loans and to comply with servicing agreements with third-party customers for the service of loans under the Federal Direct Loan and FFEL Programs; |
• | risks from changes in the demand or preferences for educational financing and related services by educational institutions, students, and their families; |
• | uncertainties inherent in forecasting future cash flows from student loan assets and related asset-backed securitizations; |
• | risks associated with litigation, complex government regulations, changes in general economic conditions (which have recently led to higher rates of student loan defaults), changes in credit market conditions, and related party transactions; and |
• | uncertainties inherent in the estimates and assumptions about future events that management is required to make in the preparation of the Company's consolidated financial statements. |
All forward-looking statements contained in this report are qualified by these cautionary statements and are made only as of the date of this document. Although the Company may from time to time voluntarily update or revise its prior forward-looking statements to reflect actual results or changes in the Company’s expectations, the Company disclaims any commitment to do so except as required by securities laws.
1
Condensed Consolidated Statements of Income (unaudited)
Three months ended | Nine months ended | ||||||||||||||
September 30, 2012 | June 30, 2012 | September 30, 2011 | September 30, 2012 | September 30, 2011 | |||||||||||
Interest Income: | |||||||||||||||
Loan interest | $ | 150,528 | 150,988 | 156,955 | 454,574 | 433,247 | |||||||||
Investment interest | 1,140 | 1,055 | 672 | 3,290 | 2,254 | ||||||||||
Total interest income | 151,668 | 152,043 | 157,627 | 457,864 | 435,501 | ||||||||||
Interest expense: | |||||||||||||||
Interest on bonds and notes payable | 66,402 | 67,476 | 60,866 | 203,175 | 164,227 | ||||||||||
Net interest income | 85,266 | 84,567 | 96,761 | 254,689 | 271,274 | ||||||||||
Less provision for loan losses | 5,000 | 7,000 | 5,250 | 18,000 | 14,250 | ||||||||||
Net interest income after provision for loan losses | 80,266 | 77,567 | 91,511 | 236,689 | 257,024 | ||||||||||
Other income (expense): | |||||||||||||||
Loan and guaranty servicing revenue | 53,285 | 52,391 | 42,549 | 155,164 | 124,697 | ||||||||||
Tuition payment processing and campus commerce revenue | 17,928 | 16,834 | 16,774 | 56,675 | 50,904 | ||||||||||
Enrollment services revenue | 30,661 | 29,710 | 35,505 | 92,035 | 101,688 | ||||||||||
Other income | 12,699 | 8,800 | 3,931 | 32,453 | 17,249 | ||||||||||
Gain on sale of loans and debt repurchases | 195 | 935 | — | 1,130 | 8,307 | ||||||||||
Derivative market value and foreign currency adjustments, net | (26,224 | ) | (19,532 | ) | (13,888 | ) | (61,163 | ) | (29,585 | ) | |||||
Derivative settlements, net | (5,051 | ) | (2,086 | ) | 257 | (6,910 | ) | (7,417 | ) | ||||||
Total other income | 83,493 | 87,052 | 85,128 | 269,384 | 265,843 | ||||||||||
Operating expenses: | |||||||||||||||
Salaries and benefits | 46,395 | 48,703 | 44,132 | 144,193 | 130,925 | ||||||||||
Cost to provide enrollment services | 20,151 | 20,374 | 23,825 | 62,203 | 68,804 | ||||||||||
Depreciation and amortization | 8,402 | 8,226 | 7,917 | 24,764 | 21,462 | ||||||||||
Other | 29,989 | 30,908 | 28,904 | 93,160 | 83,776 | ||||||||||
Total operating expenses | 104,937 | 108,211 | 104,778 | 324,320 | 304,967 | ||||||||||
Income before income taxes | 58,822 | 56,408 | 71,861 | 181,753 | 217,900 | ||||||||||
Income tax expense | (21,870 | ) | (14,878 | ) | (24,410 | ) | (59,978 | ) | (78,444 | ) | |||||
Net income | 36,952 | 41,530 | 47,451 | 121,775 | 139,456 | ||||||||||
Net income attributable to noncontrolling interest | 124 | 136 | — | 412 | — | ||||||||||
Net income attributable to Nelnet, Inc. | $ | 36,828 | 41,394 | 47,451 | 121,363 | 139,456 | |||||||||
Earnings per common share: | |||||||||||||||
Net income attributable to Nelnet, Inc. shareholders - basic | $ | 0.78 | 0.87 | 0.98 | 2.56 | 2.88 | |||||||||
Net income attributable to Nelnet, Inc. shareholders - diluted | $ | 0.77 | 0.87 | 0.98 | 2.55 | 2.87 | |||||||||
Weighted average common shares outstanding: | |||||||||||||||
Basic | 47,086,098 | 47,049,055 | 48,059,747 | 47,042,035 | 48,177,539 | ||||||||||
Diluted | 47,321,797 | 47,292,147 | 48,253,888 | 47,267,036 | 48,367,923 | ||||||||||
2
Condensed Consolidated Balance Sheets
As of | As of | As of | |||||||
September 30, 2012 | December 31, 2011 | September 30, 2011 | |||||||
(unaudited) | (unaudited) | ||||||||
Assets: | |||||||||
Student loans receivable, net | $ | 22,559,341 | 24,297,876 | 24,641,614 | |||||
Cash, cash equivalents, and investments | 186,534 | 93,350 | 141,928 | ||||||
Restricted cash and investments | 1,003,888 | 724,131 | 653,518 | ||||||
Goodwill | 117,118 | 117,118 | 117,118 | ||||||
Intangible assets, net | 14,360 | 28,374 | 33,074 | ||||||
Other assets | 527,603 | 591,368 | 648,975 | ||||||
Total assets | $ | 24,408,844 | 25,852,217 | 26,236,227 | |||||
Liabilities: | |||||||||
Bonds and notes payable | $ | 22,884,096 | 24,434,540 | 24,926,512 | |||||
Other liabilities | 348,510 | 351,472 | 298,232 | ||||||
Total liabilities | 23,232,606 | 24,786,012 | 25,224,744 | ||||||
Equity: | |||||||||
Total Nelnet, Inc. shareholders' equity | 1,175,821 | 1,066,205 | 1,011,483 | ||||||
Noncontrolling interest | 417 | — | — | ||||||
Total equity | 1,176,238 | 1,066,205 | 1,011,483 | ||||||
Total liabilities and equity | $ | 24,408,844 | 25,852,217 | 26,236,227 | |||||
Overview
The Company is an education services company focused primarily on providing fee-based processing services and quality education-related products and services in four core areas: loan financing, loan servicing, payment processing, and enrollment services (education planning). These products and services help students and families plan, prepare, and pay for their education and make the administrative and financial processes more efficient for schools and financial organizations. In addition, the Company earns net interest income on a portfolio of federally insured student loans.
A summary of consolidated results and financial and operational highlights is summarized below.
• | Continued strong earnings. Net income of $53.1 million, or $1.12 per share, excluding derivative market value and foreign currency adjustments, for the third quarter of 2012, compared to $56.1 million, or $1.16 per share, for the same period a year ago. The decrease in year-over-year net income was expected as the Company's student loan portfolio runs off due to Congress' elimination of the FFEL Program in 2010. The decrease was partially offset by the growth of the Company's fee-based businesses. (a)(e) |
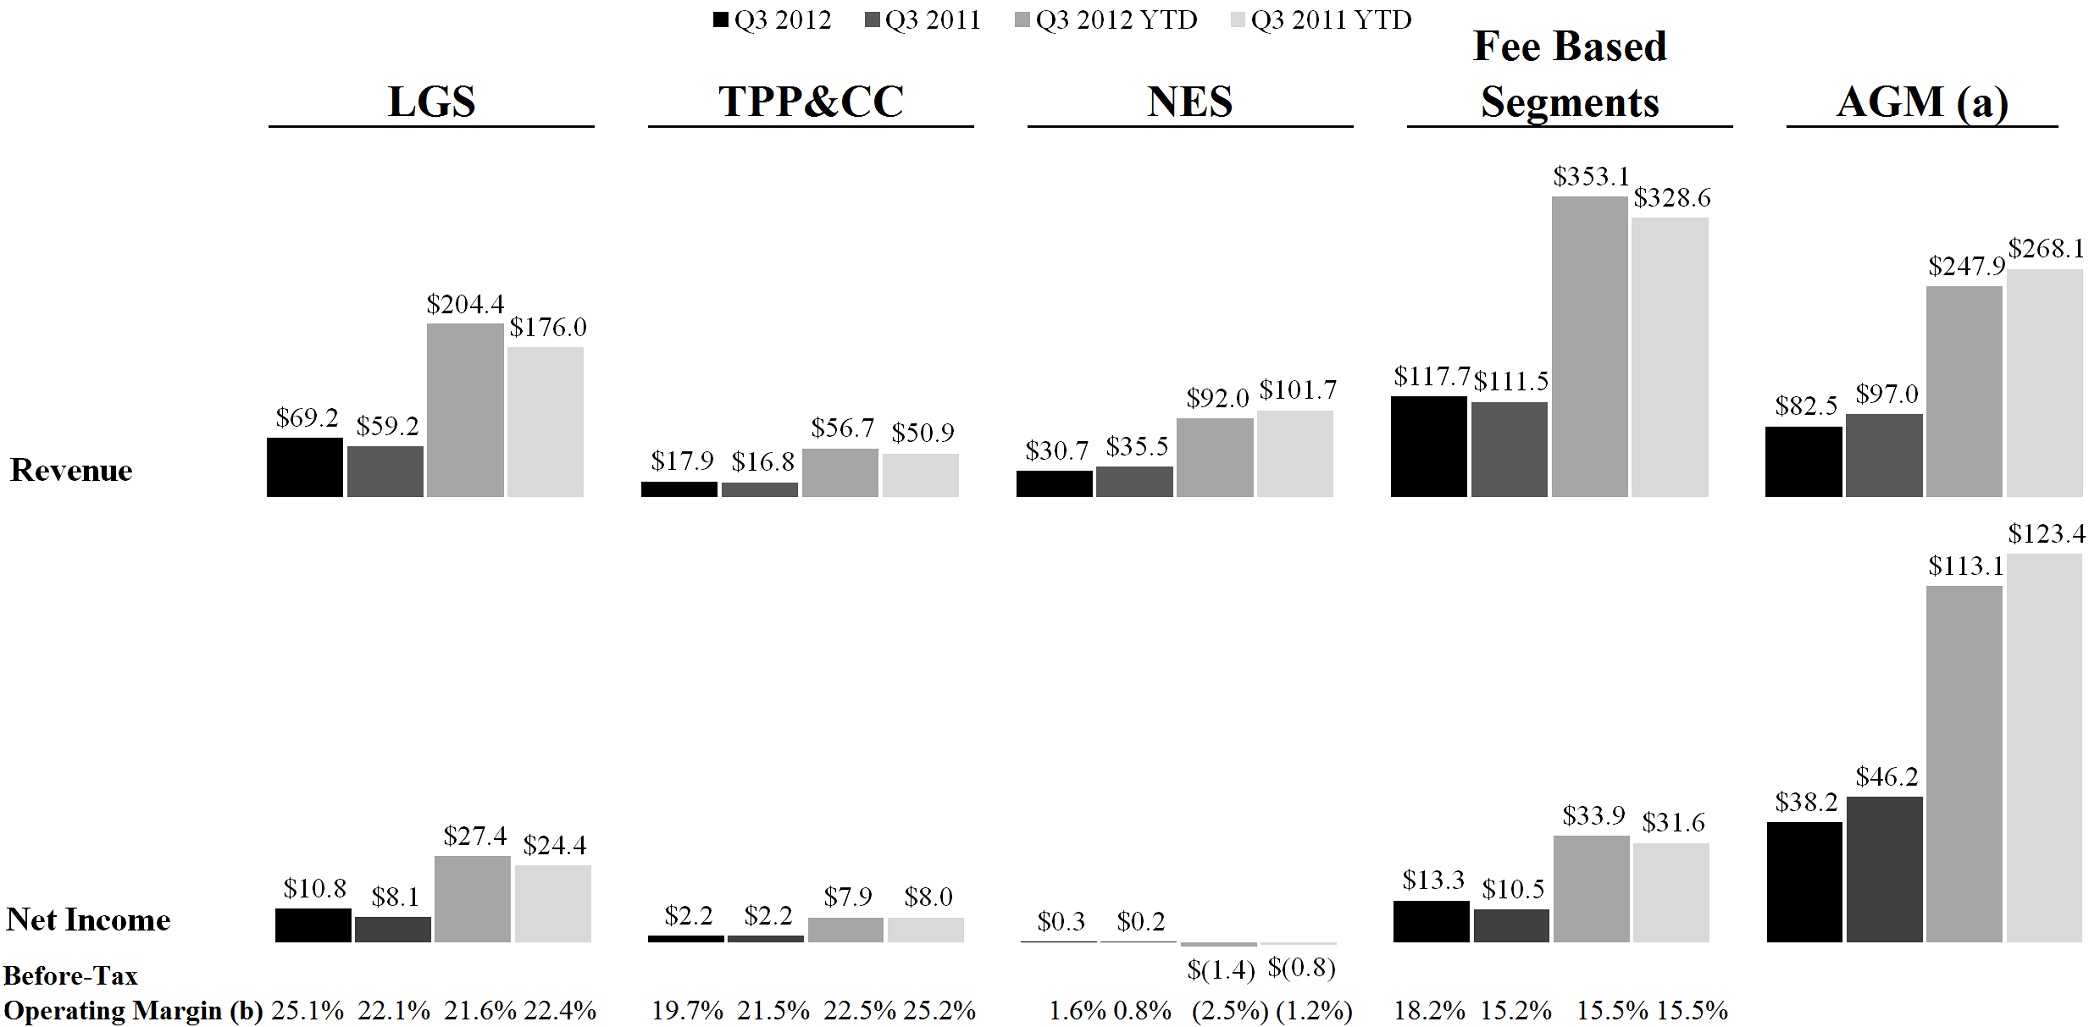
• | An increase in revenue from fee-based businesses to $117.7 million, or 5.6%, for the third quarter of 2012 as compared to the same period in 2011, and an increase to $353.1 million, or 7.5%, for the nine months ended September 30, 2012 compared to the same period in 2011 |
• | An increase in book value per share to $24.85, or 16.6%, from September 30, 2011 |
• | Strong liquidity represented by $260.6 million of net cash provided by operating activities during the first nine months of 2012 and $629.8 million of liquidity available for use as of September 30, 2012 (b) |
• | Achieved the first place ranking in the most recent annual survey results related to the servicing contract with the Department, which led to a larger allocation of loan volume to the Company for the fourth year of this contract (the period from August 15, 2012 through August 14, 2013). The Company is allocated 30 percent of new loan volume originated by the Department, up from 16 percent the prior two years. |
• | Purchased $1.1 billion of student loans from third parties subsequent to September 30, 2012 (from October 1, 2012 through November 8, 2012) |
• | Declared a cash dividend of $1.10 per share, consisting of a regular quarterly dividend of $0.10 per share and a special cash dividend of $1.00 per share, to be paid in the fourth quarter 2012. |
3
The following tables set forth financial and other operating information of the Company.
Three months ended | Nine months ended | ||||||||||||||
September 30, 2012 | June 30, 2012 | September 30, 2011 | September 30, 2012 | September 30, 2011 | |||||||||||
Operating Data: | |||||||||||||||
Core student loan spread | 1.44 | % | 1.43 | % | 1.59 | % | 1.43 | % | 1.52 | % | |||||
Net interest income | $ | 85,266 | 84,567 | 96,761 | 254,689 | 271,274 | |||||||||
Fixed rate floor income, net of settlements on derivatives | 34,736 | 36,984 | 40,598 | 109,812 | 105,081 | ||||||||||
Total revenue (c)(e) | 189,983 | 184,151 | 190,527 | 567,236 | 552,452 | ||||||||||
Operating expenses | 104,937 | 108,211 | 104,778 | 324,320 | 304,967 | ||||||||||
Net income | 36,828 | 41,394 | 47,451 | 121,363 | 139,456 | ||||||||||
Net income, excluding derivative market value and foreign currency adjustments (a)(e) | 53,087 | 53,504 | 56,062 | 159,284 | 157,799 | ||||||||||
Net income - per share | 0.78 | 0.87 | 0.98 | 2.56 | 2.88 | ||||||||||
Net income, excluding derivative market value and foreign currency adjustments - per share (a)(e) | 1.12 | 1.13 | 1.16 | 3.36 | 3.25 | ||||||||||
As of | As of | As of | |||||||
September 30, 2012 | December 31, 2011 | September 30, 2011 | |||||||
Balance Sheet Data: | |||||||||
Total assets | $ | 24,408,844 | 25,852,217 | 26,236,227 | |||||
Total equity | 1,176,238 | 1,066,205 | 1,011,483 | ||||||
Tangible equity (d) | 1,044,760 | 920,713 | 861,291 | ||||||
Book value per common share | 24.85 | 22.62 | 21.31 | ||||||
Tangible book value per common share (d) | 22.07 | 19.53 | 18.15 | ||||||
Ratios: | |||||||||
Total equity to total assets | 4.82 | % | 4.12 | % | 3.86 | % | |||
(a) | "Derivative market value and foreign currency adjustments" include (i) the unrealized gains and losses that are caused by changes in fair values of derivatives which do not qualify for "hedge treatment" under GAAP; and (ii) the foreign currency transaction gains or losses caused by the re-measurement of the Company's Euro-denominated bonds to U.S. dollars. The derivative market value and foreign currency adjustments, net of tax, was an expense of $16.3 million ($0.34 per share), $12.1 million ($0.26 per share), and $8.6 million ($0.18 per share) for the three months ended September 30, 2012, June 30, 2012, and September 30, 2011, respectively, and an expense of $37.9 million ($0.80 per share) and $18.3 million ($0.37 per share) for the nine months ended September 30, 2012 and 2011, respectively. |
(b) | See "Sources of liquidity currently available" included in this earnings supplement. |
(c) | Total revenue includes "net interest income after provision for loan losses" and "total other income" from the Company's consolidated statements of income, excluding the impact from changes in fair values of derivatives and foreign currency transaction adjustments of $26.2 million, $19.5 million, and $13.9 million for the three months ended September 30, 2012, June 30, 2012, and September 30, 2011, respectively, and $61.2 million and $29.6 million for the nine months ended September 30, 2012 and 2011, respectively. |
(d) | Tangible equity, a non-GAAP measure, equals "total equity" less "goodwill" and "intangible assets, net." Management believes presenting tangible equity and tangible book value per common share are useful measures of evaluating the strength of the Company's capital position. These measures may be calculated differently by other companies. Goodwill was $117.1 million as of September 30, 2012, December 31, 2011, and September 30, 2011, and intangible assets, net, was $14.4 million, $28.4 million, and $33.1 million as of September 30, 2012, December 31, 2011, and September 30, 2011, respectively. |
(e) | The Company provides non-GAAP information that reflects specific items management believes to be important in the evaluation of its financial position and performance, including specifically, but not limited to, the impact of unrealized gains and losses resulting from changes in fair values of derivative instruments which do not qualify for “hedge treatment” under GAAP, and foreign currency transaction gains or losses resulting from the re-measurement of the Company's Euro-denominated bonds to U.S. dollars. The Company believes these point-in-time estimates of asset and liability values related to these financial instruments that are subject to interest and currency rate fluctuations affect the period-to-period comparability of the results of operations. |
4
The Company earns fee-based revenue through the following operating segments:
• | Student Loan and Guaranty Servicing ("LGS") - referred to as Nelnet Diversified Solutions ("NDS") |
• | Tuition Payment Processing and Campus Commerce ("TPP&CC") - referred to as Nelnet Business Solutions ("NBS") |
• | Enrollment Services - commonly called Nelnet Enrollment Solutions ("NES") |
In addition, the Company earns net interest income on its student loan portfolio in its Asset Generation and Management ("AGM") operating segment.
The information below provides the operating results for each reportable operating segment for the three and nine months ended September 30, 2012 and 2011 (dollars in millions).
(a) | Total revenue includes "net interest income after provision for loan losses" and "total other income" from the Company's segment statements of income, excluding the impact from changes in fair values of derivatives and foreign currency transaction adjustments, which was an expense of $30.7 million and income of $6.7 million for the three months ended September 30, 2012 and 2011, respectively, and expenses of $62.4 million and $6.4 million for the nine months ended September 30, 2012 and 2011, respectively. Net income excludes changes in fair values of derivatives and foreign currency transaction adjustments, net of tax, which was an expense of $19.0 million and income of $4.1 million for the three months ended September 30, 2012 and 2011, respectively, and expenses of $38.7 million and $4.0 million for the nine months ended September 30, 2012 and 2011, respectively. |
(b) | Computed as income before income taxes divided by total revenue. |
A summary of the results and financial highlights for each reportable operating segment for the three and nine months ended September 30, 2012 and a summary of the Company's liquidity and capital resources follows.
Student Loan and Guaranty Servicing
• | An increase in government servicing revenue due to increased volume from the Department. |
• | An increase in guaranty servicing revenue due to an increase in rehabilitation collection revenue. |
• | An increase in software services revenue as a result of the Company beginning to provide hosted student loan servicing to a significant customer in October 2011. |
• | An increase in operating expenses due to incurring additional costs related to the government servicing contract and the hosted servicing software product. |
• | Achieved the first place ranking in the most recent annual survey results related to the servicing contract with the Department, which led to a larger allocation of loan volume to the Company for the fourth year of this contract (the period from August 15, 2012 through August 14, 2013). The Company is allocated 30 percent of new loan volume originated by the Department, up from 16 percent the prior two years. |
5
Tuition Payment Processing and Campus Commerce
• | An increase in revenue as a result of an increase in the number of managed tuition payment plans and campus commerce customers. |
• | A compression in margin due to an increase in amortization of intangible assets and continued investment in new products and services to meet customer needs and expand product and service offerings. |
Enrollment Services
• | Continued decrease in inquiry generation and inquiry management (agency) revenue due to the effects from regulatory uncertainty in the for-profit college industry, which has caused schools to decrease spending on marketing efforts. |
• | An increase in inquiry management (software) and digital marketing revenue due to an increase in client activity and the addition of new customers. |
Asset Generation and Management
• | The acquisition of $898.6 million of FFELP student loans during the first nine months of 2012. |
• | The loss of $875.4 million of FFELP student loans during the first nine months of 2012 as a result of the Department's special direct consolidation loan initiative, the student loan borrower application period for which expired June 30, 2012. |
• | A decrease in variable student loan spread as a result of the widening between the index rate in which the Company earns on its student loans and the index rate paid to fund such loans. |
• | Continued recognition of significant fixed rate floor income due to historically low interest rates. |
Liquidity and Capital Resources
• | As of September 30, 2012, the Company had $629.8 million of liquidity available for use. |
• | For the nine months ended September 30, 2012, the Company generated $260.6 million in net cash provided by operating activities. |
• | Forecasted future cash flows from the Company's FFELP student loan portfolio remain strong and are estimated to be $1.88 billion as of September 30, 2012. |
• | On February 17, 2012, the Company entered into a new $250.0 million unsecured line of credit that has a maturity date of February 17, 2016. In conjunction with entering into this new agreement, the outstanding balance on the previous $750.0 million unsecured line of credit of $64.4 million was paid off in full and that agreement was terminated. |
• | On April 12, 2012, the Company entered into a new $50.0 million secured line of credit, which is collateralized by asset-backed security investments, and has a maturity date of April 11, 2014. |
• | The Company will continue to use its strong liquidity position to capitalize on market opportunities, including FFELP student loan acquisitions; strategic acquisitions and investments in its core business areas of loan financing, loan servicing, payment processing, and enrollment services (education planning); and capital management initiatives, including stock repurchases, debt repurchases, and dividend distributions. |
• | On November 8, 2012, the Company's Board of Directors declared a cash dividend of $1.10 per share, consisting of a regular quarterly dividend of $0.10 per share and a special cash dividend of $1.00 per share, to be paid in the fourth quarter 2012. The Company expects to use operating cash currently available to fund this dividend. |
Income Taxes
• | The Company's effective tax rate was 37.2 percent and 33.0 percent for the three and nine months ended September 30, 2012, respectively, compared to 34.0 percent and 36.0 percent for the same periods in 2011. During the nine months ended September 30, 2012, state tax laws were enacted that reduced the Company's income tax expense by $3.4 million. The Company currently expects the effective tax rate for the last three months of 2012 will be 36.0 percent to 37.0 percent. |
6
Operating Segments
The Company earns fee-based revenue through its Student Loan and Guaranty Servicing, Tuition Payment Processing and Campus Commerce, and Enrollment Services operating segments. In addition, the Company earns net interest income on its student loan portfolio in its Asset Generation and Management operating segment. The Company’s operating segments are defined by the products and services they offer and the types of customers they serve, and they reflect the manner in which financial information is currently evaluated by management.
The management reporting process measures the performance of the Company’s operating segments based on the management structure of the Company, as well as the methodology used by management to evaluate performance and allocate resources. Executive management (the "chief operating decision maker") evaluates the performance of the Company’s operating segments based on their profitability. Prior to 2012, management measured the profitability of the Company’s operating segments based on “base net income.” The Company's "base net income" was not a defined term within U.S. generally accepted accounting principles ("GAAP") and was not necessarily comparable to similarly titled measures reported by other companies. However, “base net income,” which consisted of GAAP net income excluding the derivative market value and foreign currency adjustments, amortization of intangible assets, compensation related to business combinations, and variable rate floor income, net of settlements on derivatives, was the primary financial performance measure used by management to develop the Company’s financial plans, track results, and establish corporate performance targets and incentive compensation. Unlike financial accounting, there is no comprehensive, authoritative guidance for management reporting. Accordingly, information regarding the Company’s operating segments was historically provided based on “base net income.” Due to the decrease in the number and dollar amount of differences between "base net income" and GAAP net income, during the first quarter of 2012, executive management discontinued utilizing "base net income" and began to evaluate the performance and profitability of the Company's operating segments based on financial results prepared in conformity with GAAP. As such, the Company has changed its operating segment income measurement from "base net income" to GAAP net income. Prior period segment operating results have been restated to conform to the current period presentation.
The accounting policies of the Company’s operating segments are the same as those described in note 2 in the notes to the consolidated financial statements included in the Company’s Annual Report filed on Form 10-K for the year ended December 31, 2011. Intersegment revenues are charged by a segment that provides a product or service to another segment. Intersegment revenues and expenses are included within each segment consistent with the income statement presentation provided to management. Changes in management structure or allocation methodologies and procedures may result in changes in reported segment financial information. The Company allocates certain corporate overhead expenses to the individual operating segments. These expenses include certain corporate activities related to executive management, human resources, accounting, legal, occupancy, and marketing. These costs are allocated to each operating segment based on estimated use of such activities and services. In addition, income taxes are allocated based on 38% of income (loss) before taxes for each individual operating segment. The difference between the consolidated income tax expense and the sum of taxes calculated for each operating segment is included in income taxes in Corporate Activity and Overhead.
The following describes the products and services of each operating segment. In addition, the tables below include the results of each of the Company's operating segments reconciled to the consolidated financial statements.
Fee-Based Operating Segments
Student Loan and Guaranty Servicing
The following are the primary products and services the Company offers as part of its Student Loan and Guaranty Servicing segment:
• | Servicing FFELP loans |
• | Origination and servicing of non-federally insured student loans |
• | Servicing federally-owned student loans for the Department of Education |
• | Servicing and support outsourcing for guaranty agencies |
• | Student loan servicing software and other information technology products and services |
The Student Loan and Guaranty Servicing operating segment provides for the servicing of the Company’s student loan portfolios and the portfolios of third parties. The loan servicing activities include loan origination activities, loan conversion activities, application processing, borrower updates, payment processing, due diligence procedures, funds management reconciliations, and claim processing. These activities are performed internally for the Company’s portfolio in addition to generating external fee revenue when performed for third-party clients.
7
In June 2009, the Department named the Company as one of four private sector companies awarded a servicing contract to service federally-owned student loans. In September 2009, the Company began servicing loans under this contract. The contract spans five years, with one five-year renewal at the option of the Department.
This operating segment also provides servicing activities for guaranty agencies. These activities include providing software and data center services, borrower and loan updates, default aversion tracking services, claim processing services, and managing third-party collection agencies.
This operating segment also provides student loan servicing software, which is used internally by the Company and licensed to third-party student loan holders and servicers. These software systems have been adapted so that they can be offered as hosted servicing software solutions that can be used by third parties to service various types of student loans, including private, Federal Direct Loan Program, and FFEL Program loans.
Tuition Payment Processing and Campus Commerce
The Company’s Tuition Payment Processing and Campus Commerce operating segment provides products and services to help students and families manage the payment of education costs at all levels (K-12 and higher education). It also provides innovative education-focused technologies, services, and support solutions to help schools with the everyday challenges of collecting and processing commerce data.
In the K-12 market, this operating segment offers actively managed tuition payment plans and billing services as well as assistance with financial needs assessment and donor management. This operating segment offers two principal products to the higher education market: actively managed tuition payment plans and campus commerce technologies and payment processing.
Enrollment Services
The Enrollment Services operating segment offers products and services that are focused on helping colleges recruit and retain students and helping students plan and prepare for life after high school and/or military service. The following are the primary products and services the Company offers as part of the Enrollment Services segment:
• | Inquiry Generation - Inquiry generation services include delivering qualified inquiries or clicks to third-party customers, primarily for-profit schools. |
• | Inquiry Management (Agency) - Agency services include managing the marketing activities for third-party customers, primarily for-profit schools, in order to provide qualified inquiries or clicks. |
• | Inquiry Management (Software) - Software services include the licensing of software to third-party customers, primarily for-profit schools. This software is also used internally by the Company. The inquiry management software has been adapted so that it can be offered as a hosted software solution that can be used by third parties to manage and obtain qualified inquiries or clicks. |
• | Digital Marketing - Digital marketing services include on-line information about colleges and universities and are sold primarily based on subscriptions. Digital marketing services also include editing services for admission essays. |
• | Content Solutions - Content solutions includes test preparation study guides, school directories and databases, career exploration guides, on-line courses, scholarship search and selection data, career planning, and on-line information about colleges and universities. Content solutions also includes providing list marketing services to help higher education institutions and businesses reach the middle school, high school, college bound high school, college, and young adult market places. |
Asset Generation and Management Operating Segment
The Asset Generation and Management operating segment includes the acquisition, management, and ownership of the Company’s student loan assets, which has historically been the Company’s largest product and service offering. The Company generates a substantial portion of its earnings from the spread, referred to as the Company’s student loan spread, between the yield it receives on its student loan portfolio and the associated costs to finance such portfolio. The student loan assets are held in a series of education lending subsidiaries and associated securitization trusts designed specifically for this purpose. In addition to the student loan spread earned on its portfolio, all costs and activity associated with managing the portfolio, such as servicing of the assets and debt maintenance, are included in this segment.
8
As a result of legislation effective July 1, 2010, all new federal student loan originations are made by the Department through the Federal Direct Loan Program and the Company no longer originates FFELP loans. This legislation does not alter or affect the terms and conditions of existing FFELP loans.
Corporate Activity and Overhead
Corporate Activity and Overhead includes the following items:
• | The operating results of Whitetail Rock Capital Management, LLC, the Company's SEC-registered investment advisory subsidiary |
• | Income earned on certain investment activities |
• | Interest expense incurred on unsecured debt transactions |
• | Other product and service offerings that are not considered operating segments |
Corporate Activities and Overhead also includes certain corporate activities and overhead functions related to executive management, human resources, accounting, legal, occupancy, and marketing. These costs are allocated to each operating segment based on estimated use of such activities and services.
Segment Results of Operations
Three months ended September 30, 2012 | ||||||||||||||||||||||||
Fee-Based | ||||||||||||||||||||||||
Student Loan and Guaranty Servicing | Tuition Payment Processing and Campus Commerce | Enrollment Services | Total Fee- Based | Asset Generation and Management | Corporate Activity and Overhead | Eliminations | Total | |||||||||||||||||
Total interest income | $ | 12 | 3 | — | 15 | 150,661 | 1,891 | (899 | ) | 151,668 | ||||||||||||||
Interest expense | — | — | — | — | 64,829 | 2,472 | (899 | ) | 66,402 | |||||||||||||||
Net interest income (loss) | 12 | 3 | — | 15 | 85,832 | (581 | ) | — | 85,266 | |||||||||||||||
Less provision for loan losses | — | — | — | — | 5,000 | — | — | 5,000 | ||||||||||||||||
Net interest income ( loss) after provision for loan losses | 12 | 3 | — | 15 | 80,832 | (581 | ) | — | 80,266 | |||||||||||||||
Other income (expense): | ||||||||||||||||||||||||
Loan and guaranty servicing revenue | 53,285 | — | — | 53,285 | — | — | — | 53,285 | ||||||||||||||||
Intersegment servicing revenue | 15,855 | — | — | 15,855 | — | — | (15,855 | ) | — | |||||||||||||||
Tuition payment processing and campus commerce revenue | — | 17,928 | — | 17,928 | — | — | — | 17,928 | ||||||||||||||||
Enrollment services revenue | — | — | 30,661 | 30,661 | — | — | — | 30,661 | ||||||||||||||||
Other income | — | — | — | — | 5,834 | 6,865 | — | 12,699 | ||||||||||||||||
Gain on sale of loans and debt repurchases | — | — | — | — | 195 | — | — | 195 | ||||||||||||||||
Derivative market value and foreign currency adjustments, net | — | — | — | — | (30,694 | ) | 4,470 | — | (26,224 | ) | ||||||||||||||
Derivative settlements, net | — | — | — | — | (4,319 | ) | (732 | ) | — | (5,051 | ) | |||||||||||||
Total other income (expense) | 69,140 | 17,928 | 30,661 | 117,729 | (28,984 | ) | 10,603 | (15,855 | ) | 83,493 | ||||||||||||||
Operating expenses: | ||||||||||||||||||||||||
Salaries and benefits | 27,716 | 8,578 | 5,147 | 41,441 | 462 | 4,492 | — | 46,395 | ||||||||||||||||
Cost to provide enrollment services | — | — | 20,151 | 20,151 | — | — | — | 20,151 | ||||||||||||||||
Depreciation and amortization | 4,691 | 1,703 | 1,633 | 8,027 | — | 375 | — | 8,402 | ||||||||||||||||
Other | 16,775 | 2,285 | 1,782 | 20,842 | 3,451 | 5,696 | — | 29,989 | ||||||||||||||||
Intersegment expenses, net | 1,262 | 1,379 | 1,000 | 3,641 | 16,064 | (3,850 | ) | (15,855 | ) | — | ||||||||||||||
Total operating expenses | 50,444 | 13,945 | 29,713 | 94,102 | 19,977 | 6,713 | (15,855 | ) | 104,937 | |||||||||||||||
Income (loss) before income taxes and corporate overhead allocation | 18,708 | 3,986 | 948 | 23,642 | 31,871 | 3,309 | — | 58,822 | ||||||||||||||||
Corporate overhead allocation | (1,337 | ) | (446 | ) | (446 | ) | (2,229 | ) | (909 | ) | 3,138 | — | — | |||||||||||
Income (loss) before income taxes | 17,371 | 3,540 | 502 | 21,413 | 30,962 | 6,447 | — | 58,822 | ||||||||||||||||
Income tax (expense) benefit | (6,601 | ) | (1,345 | ) | (191 | ) | (8,137 | ) | (11,765 | ) | (1,968 | ) | — | (21,870 | ) | |||||||||
Net income (loss) | 10,770 | 2,195 | 311 | 13,276 | 19,197 | 4,479 | — | 36,952 | ||||||||||||||||
Net income attributable to noncontrolling interest | — | — | — | — | — | 124 | — | 124 | ||||||||||||||||
Net income (loss) attributable to Nelnet, Inc. | $ | 10,770 | 2,195 | 311 | 13,276 | 19,197 | 4,355 | — | 36,828 | |||||||||||||||
9
Three months ended June 30, 2012 | ||||||||||||||||||||||||
Fee-Based | ||||||||||||||||||||||||
Student Loan and Guaranty Servicing | Tuition Payment Processing and Campus Commerce | Enrollment Services | Total Fee- Based | Asset Generation and Management | Corporate Activity and Overhead | Eliminations | Total | |||||||||||||||||
Total interest income | $ | 12 | 1 | — | 13 | 151,240 | 1,747 | (957 | ) | 152,043 | ||||||||||||||
Interest expense | — | — | — | — | 66,017 | 2,416 | (957 | ) | 67,476 | |||||||||||||||
Net interest income | 12 | 1 | — | 13 | 85,223 | (669 | ) | — | 84,567 | |||||||||||||||
Less provision for loan losses | — | — | — | — | 7,000 | — | — | 7,000 | ||||||||||||||||
Net interest income after provision for loan losses | 12 | 1 | — | 13 | 78,223 | (669 | ) | — | 77,567 | |||||||||||||||
Other income (expense): | ||||||||||||||||||||||||
Loan and guaranty servicing revenue | 52,391 | — | — | 52,391 | — | — | — | 52,391 | ||||||||||||||||
Intersegment servicing revenue | 16,401 | — | — | 16,401 | — | — | (16,401 | ) | — | |||||||||||||||
Tuition payment processing and campus commerce revenue | — | 16,834 | — | 16,834 | — | — | — | 16,834 | ||||||||||||||||
Enrollment services revenue | — | — | 29,710 | 29,710 | — | — | — | 29,710 | ||||||||||||||||
Other income | — | — | — | — | 3,581 | 5,219 | — | 8,800 | ||||||||||||||||
Gain on sale of loans and debt repurchases | — | — | — | — | 935 | — | — | 935 | ||||||||||||||||
Derivative market value and foreign currency adjustments | — | — | — | — | (10,053 | ) | (9,479 | ) | — | (19,532 | ) | |||||||||||||
Derivative settlements, net | — | — | — | — | (1,339 | ) | (747 | ) | — | (2,086 | ) | |||||||||||||
Total other income (expense) | 68,792 | 16,834 | 29,710 | 115,336 | (6,876 | ) | (5,007 | ) | (16,401 | ) | 87,052 | |||||||||||||
Operating expenses: | ||||||||||||||||||||||||
Salaries and benefits | 28,905 | 8,575 | 6,161 | 43,641 | 542 | 4,520 | — | 48,703 | ||||||||||||||||
Cost to provide enrollment services | — | — | 20,374 | 20,374 | — | — | — | 20,374 | ||||||||||||||||
Depreciation and amortization | 4,525 | 1,731 | 1,617 | 7,873 | — | 353 | — | 8,226 | ||||||||||||||||
Other | 17,539 | 2,456 | 1,745 | 21,740 | 3,120 | 6,048 | — | 30,908 | ||||||||||||||||
Intersegment expenses, net | 1,185 | 1,330 | 976 | 3,491 | 16,635 | (3,725 | ) | (16,401 | ) | — | ||||||||||||||
Total operating expenses | 52,154 | 14,092 | 30,873 | 97,119 | 20,297 | 7,196 | (16,401 | ) | 108,211 | |||||||||||||||
Income (loss) before income taxes and corporate overhead allocation | 16,650 | 2,743 | (1,163 | ) | 18,230 | 51,050 | (12,872 | ) | — | 56,408 | ||||||||||||||
Corporate overhead allocation | (1,275 | ) | (425 | ) | (425 | ) | (2,125 | ) | (1,400 | ) | 3,525 | — | — | |||||||||||
Income (loss) before income taxes | 15,375 | 2,318 | (1,588 | ) | 16,105 | 49,650 | (9,347 | ) | — | 56,408 | ||||||||||||||
Income tax (expense) benefit | (5,843 | ) | (881 | ) | 603 | (6,121 | ) | (18,866 | ) | 10,109 | — | (14,878 | ) | |||||||||||
Net income (loss) | 9,532 | 1,437 | (985 | ) | 9,984 | 30,784 | 762 | — | 41,530 | |||||||||||||||
Net income attributable to noncontrolling interest | — | — | — | — | — | 136 | — | 136 | ||||||||||||||||
Net income (loss) attributable to Nelnet, Inc. | $ | 9,532 | 1,437 | (985 | ) | 9,984 | 30,784 | 626 | — | 41,394 | ||||||||||||||
10
Three months ended September 30, 2011 | ||||||||||||||||||||||||
Fee-Based | ||||||||||||||||||||||||
Student Loan and Guaranty Servicing | Tuition Payment Processing and Campus Commerce | Enrollment Services | Total Fee- Based | Asset Generation and Management | Corporate Activity and Overhead | Eliminations | Total | |||||||||||||||||
Total interest income | $ | 15 | 11 | — | 26 | 157,071 | 1,285 | (755 | ) | 157,627 | ||||||||||||||
Interest expense | — | — | — | — | 59,049 | 2,572 | (755 | ) | 60,866 | |||||||||||||||
Net interest income (loss) | 15 | 11 | — | 26 | 98,022 | (1,287 | ) | — | 96,761 | |||||||||||||||
Less provision for loan losses | — | — | — | — | 5,250 | — | — | 5,250 | ||||||||||||||||
Net interest income (loss) after provision for loan losses | 15 | 11 | — | 26 | 92,772 | (1,287 | ) | — | 91,511 | |||||||||||||||
Other income (expense): | ||||||||||||||||||||||||
Loan and guaranty servicing revenue | 42,549 | — | — | 42,549 | — | — | — | 42,549 | ||||||||||||||||
Intersegment servicing revenue | 16,622 | — | — | 16,622 | — | — | (16,622 | ) | — | |||||||||||||||
Tuition payment processing and campus commerce revenue | — | 16,774 | — | 16,774 | — | — | — | 16,774 | ||||||||||||||||
Enrollment services revenue | — | — | 35,505 | 35,505 | — | — | — | 35,505 | ||||||||||||||||
Other income | — | — | — | — | 3,694 | 237 | — | 3,931 | ||||||||||||||||
Gain on sale of loans and debt repurchases | — | — | — | — | — | — | — | — | ||||||||||||||||
Derivative market value and foreign currency adjustments, net | — | — | — | — | 6,677 | (20,565 | ) | — | (13,888 | ) | ||||||||||||||
Derivative settlements, net | — | — | — | — | 507 | (250 | ) | — | 257 | |||||||||||||||
Total other income (expense) | 59,171 | 16,774 | 35,505 | 111,450 | 10,878 | (20,578 | ) | (16,622 | ) | 85,128 | ||||||||||||||
Operating expenses: | ||||||||||||||||||||||||
Salaries and benefits | 25,335 | 7,594 | 6,484 | 39,413 | 694 | 4,025 | — | 44,132 | ||||||||||||||||
Cost to provide enrollment services | — | — | 23,825 | 23,825 | — | — | — | 23,825 | ||||||||||||||||
Depreciation and amortization | 4,104 | 1,799 | 1,662 | 7,565 | — | 352 | — | 7,917 | ||||||||||||||||
Other | 14,420 | 2,302 | 2,129 | 18,851 | 3,311 | 6,742 | — | 28,904 | ||||||||||||||||
Intersegment expenses, net | 1,291 | 1,166 | 783 | 3,240 | 16,865 | (3,483 | ) | (16,622 | ) | — | ||||||||||||||
Total operating expenses | 45,150 | 12,861 | 34,883 | 92,894 | 20,870 | 7,636 | (16,622 | ) | 104,778 | |||||||||||||||
Income (loss) before income taxes and corporate overhead allocation | 14,036 | 3,924 | 622 | 18,582 | 82,780 | (29,501 | ) | — | 71,861 | |||||||||||||||
Corporate overhead allocation | (963 | ) | (321 | ) | (321 | ) | (1,605 | ) | (1,605 | ) | 3,210 | — | — | |||||||||||
Income (loss) before income taxes | 13,073 | 3,603 | 301 | 16,977 | 81,175 | (26,291 | ) | — | 71,861 | |||||||||||||||
Income tax (expense) benefit | (4,967 | ) | (1,369 | ) | (114 | ) | (6,450 | ) | (30,846 | ) | 12,886 | — | (24,410 | ) | ||||||||||
Net income (loss) | 8,106 | 2,234 | 187 | 10,527 | 50,329 | (13,405 | ) | — | 47,451 | |||||||||||||||
Net income attributable to noncontrolling interest | — | — | — | — | — | — | — | — | ||||||||||||||||
Net income (loss) attributable to Nelnet, Inc. | $ | 8,106 | 2,234 | 187 | 10,527 | 50,329 | (13,405 | ) | — | 47,451 | ||||||||||||||
11
Nine months ended September 30, 2012 | ||||||||||||||||||||||||
Fee-Based | ||||||||||||||||||||||||
Student Loan and Guaranty Servicing | Tuition Payment Processing and Campus Commerce | Enrollment Services | Total Fee- Based | Asset Generation and Management | Corporate Activity and Overhead | Eliminations | Total | |||||||||||||||||
Total interest income | $ | 44 | 8 | — | 52 | 455,413 | 5,226 | (2,827 | ) | 457,864 | ||||||||||||||
Interest expense | — | — | — | — | 199,675 | 6,327 | (2,827 | ) | 203,175 | |||||||||||||||
Net interest income | 44 | 8 | — | 52 | 255,738 | (1,101 | ) | — | 254,689 | |||||||||||||||
Less provision for loan losses | — | — | — | — | 18,000 | — | — | 18,000 | ||||||||||||||||
Net interest income after provision for loan losses | 44 | 8 | — | 52 | 237,738 | (1,101 | ) | — | 236,689 | |||||||||||||||
Other income (expense): | ||||||||||||||||||||||||
Loan and guaranty servicing revenue | 155,164 | — | — | 155,164 | — | — | — | 155,164 | ||||||||||||||||
Intersegment servicing revenue | 49,210 | — | — | 49,210 | — | — | (49,210 | ) | — | |||||||||||||||
Tuition payment processing and campus commerce revenue | — | 56,675 | — | 56,675 | — | — | — | 56,675 | ||||||||||||||||
Enrollment services revenue | — | — | 92,035 | 92,035 | — | — | — | 92,035 | ||||||||||||||||
Other income | — | — | — | — | 14,415 | 18,038 | — | 32,453 | ||||||||||||||||
Gain on sale of loans and debt repurchases | — | — | — | — | 1,130 | — | — | 1,130 | ||||||||||||||||
Derivative market value and foreign currency adjustments, net | — | — | — | — | (62,351 | ) | 1,188 | — | (61,163 | ) | ||||||||||||||
Derivative settlements, net | — | — | — | — | (5,431 | ) | (1,479 | ) | — | (6,910 | ) | |||||||||||||
Total other income (expense) | 204,374 | 56,675 | 92,035 | 353,084 | (52,237 | ) | 17,747 | (49,210 | ) | 269,384 | ||||||||||||||
Operating expenses: | ||||||||||||||||||||||||
Salaries and benefits | 85,663 | 25,771 | 17,587 | 129,021 | 1,723 | 13,449 | — | 144,193 | ||||||||||||||||
Cost to provide enrollment services | — | — | 62,203 | 62,203 | — | — | — | 62,203 | ||||||||||||||||
Depreciation and amortization | 13,629 | 5,174 | 4,867 | 23,670 | — | 1,094 | — | 24,764 | ||||||||||||||||
Other | 52,980 | 7,557 | 5,483 | 66,020 | 10,203 | 16,937 | — | 93,160 | ||||||||||||||||
Intersegment expenses, net | 3,832 | 4,042 | 2,824 | 10,698 | 49,842 | (11,330 | ) | (49,210 | ) | — | ||||||||||||||
Total operating expenses | 156,104 | 42,544 | 92,964 | 291,612 | 61,768 | 20,150 | (49,210 | ) | 324,320 | |||||||||||||||
Income (loss) before income taxes and corporate overhead allocation | 48,314 | 14,139 | (929 | ) | 61,524 | 123,733 | (3,504 | ) | — | 181,753 | ||||||||||||||
Corporate overhead allocation | (4,115 | ) | (1,372 | ) | (1,372 | ) | (6,859 | ) | (3,701 | ) | 10,560 | — | — | |||||||||||
Income (loss) before income taxes | 44,199 | 12,767 | (2,301 | ) | 54,665 | 120,032 | 7,056 | — | 181,753 | |||||||||||||||
Income tax (expense) benefit | (16,796 | ) | (4,851 | ) | 874 | (20,773 | ) | (45,610 | ) | 6,405 | — | (59,978 | ) | |||||||||||
Net income (loss) | 27,403 | 7,916 | (1,427 | ) | 33,892 | 74,422 | 13,461 | — | 121,775 | |||||||||||||||
Net income attributable to noncontrolling interest | — | — | — | — | — | 412 | — | 412 | ||||||||||||||||
Net income (loss) attributable to Nelnet, Inc. | $ | 27,403 | 7,916 | (1,427 | ) | 33,892 | 74,422 | 13,049 | — | 121,363 | ||||||||||||||
12
Nine months ended September 30, 2011 | ||||||||||||||||||||||||
Fee-Based | ||||||||||||||||||||||||
Student Loan and Guaranty Servicing | Tuition Payment Processing and Campus Commerce | Enrollment Services | Total Fee- Based | Asset Generation and Management | Corporate Activity and Overhead | Eliminations | Total | |||||||||||||||||
Total interest income | $ | 42 | 19 | — | 61 | 433,994 | 3,578 | (2,132 | ) | 435,501 | ||||||||||||||
Interest expense | — | — | — | — | 158,034 | 8,325 | (2,132 | ) | 164,227 | |||||||||||||||
Net interest income | 42 | 19 | — | 61 | 275,960 | (4,747 | ) | — | 271,274 | |||||||||||||||
Less provision for loan losses | — | — | — | — | 14,250 | — | — | 14,250 | ||||||||||||||||
Net interest income after provision for loan losses | 42 | 19 | — | 61 | 261,710 | (4,747 | ) | — | 257,024 | |||||||||||||||
Other income (expense): | ||||||||||||||||||||||||
Loan and guaranty servicing revenue | 124,697 | — | — | 124,697 | — | — | — | 124,697 | ||||||||||||||||
Intersegment servicing revenue | 51,272 | — | — | 51,272 | — | — | (51,272 | ) | — | |||||||||||||||
Tuition payment processing and campus commerce revenue | — | 50,904 | — | 50,904 | — | — | — | 50,904 | ||||||||||||||||
Enrollment services revenue | — | — | 101,688 | 101,688 | — | — | — | 101,688 | ||||||||||||||||
Other income | — | — | — | — | 11,827 | 5,422 | — | 17,249 | ||||||||||||||||
Gain on sale of loans and debt repurchases | — | — | — | — | 1,400 | 6,907 | — | 8,307 | ||||||||||||||||
Derivative market value and foreign currency adjustments, net | — | — | — | — | (6,443 | ) | (23,142 | ) | — | (29,585 | ) | |||||||||||||
Derivative settlements, net | — | — | — | — | (6,805 | ) | (612 | ) | — | (7,417 | ) | |||||||||||||
Total other income (expense) | 175,969 | 50,904 | 101,688 | 328,561 | (21 | ) | (11,425 | ) | (51,272 | ) | 265,843 | |||||||||||||
Operating expenses: | ||||||||||||||||||||||||
Salaries and benefits | 75,454 | 21,995 | 18,672 | 116,121 | 2,181 | 12,623 | — | 130,925 | ||||||||||||||||
Cost to provide enrollment services | — | — | 68,804 | 68,804 | — | — | — | 68,804 | ||||||||||||||||
Depreciation and amortization | 10,946 | 4,459 | 5,011 | 20,416 | — | 1,046 | — | 21,462 | ||||||||||||||||
Other | 43,604 | 7,263 | 6,889 | 57,756 | 9,988 | 16,032 | — | 83,776 | ||||||||||||||||
Intersegment expenses, net | 3,720 | 3,377 | 2,560 | 9,657 | 52,059 | (10,444 | ) | (51,272 | ) | — | ||||||||||||||
Total operating expenses | 133,724 | 37,094 | 101,936 | 272,754 | 64,228 | 19,257 | (51,272 | ) | 304,967 | |||||||||||||||
Income (loss) before income taxes and corporate overhead allocation | 42,287 | 13,829 | (248 | ) | 55,868 | 197,461 | (35,429 | ) | — | 217,900 | ||||||||||||||
Corporate overhead allocation | (2,949 | ) | (983 | ) | (983 | ) | (4,915 | ) | (4,914 | ) | 9,829 | — | — | |||||||||||
Income (loss) before income taxes | 39,338 | 12,846 | (1,231 | ) | 50,953 | 192,547 | (25,600 | ) | — | 217,900 | ||||||||||||||
Income tax (expense) benefit | (14,946 | ) | (4,881 | ) | 468 | (19,359 | ) | (73,168 | ) | 14,083 | — | (78,444 | ) | |||||||||||
Net income (loss) | 24,392 | 7,965 | (763 | ) | 31,594 | 119,379 | (11,517 | ) | — | 139,456 | ||||||||||||||
Net income attributable to noncontrolling interest | — | — | — | — | — | — | — | — | ||||||||||||||||
Net income (loss) attributable to Nelnet, Inc. | $ | 24,392 | 7,965 | (763 | ) | 31,594 | 119,379 | (11,517 | ) | — | 139,456 | |||||||||||||
Net Interest Income After Provision for Loan Losses (Net of Settlements on Derivatives)
The following table summarizes the components of “net interest income after provision for loan losses,” net of “derivative settlements, net” included in the attached condensed consolidated statements of income.
Three months ended | Nine months ended | ||||||||||||||
September 30, 2012 | June 30, 2012 | September 30, 2011 | September 30, 2012 | September 30, 2011 | |||||||||||
Variable student loan interest margin, net of settlements on derivatives | $ | 47,543 | 47,606 | 58,570 | 142,484 | 165,458 | |||||||||
Fixed rate floor income, net of settlements on derivatives | 34,736 | 36,984 | 40,598 | 109,812 | 105,081 | ||||||||||
Investment interest | 1,140 | 1,055 | 672 | 3,290 | 2,254 | ||||||||||
Non-portfolio related derivative settlements | (732 | ) | (748 | ) | (250 | ) | (1,480 | ) | (611 | ) | |||||
Corporate debt interest expense | (2,472 | ) | (2,416 | ) | (2,572 | ) | (6,327 | ) | (8,325 | ) | |||||
Provision for loan losses | (5,000 | ) | (7,000 | ) | (5,250 | ) | (18,000 | ) | (14,250 | ) | |||||
Net interest income after provision for loan losses (net of settlements on derivatives) | $ | 75,215 | 75,481 | 91,768 | 229,779 | 249,607 | |||||||||
13
Student Loan Servicing Volumes (dollars in millions)
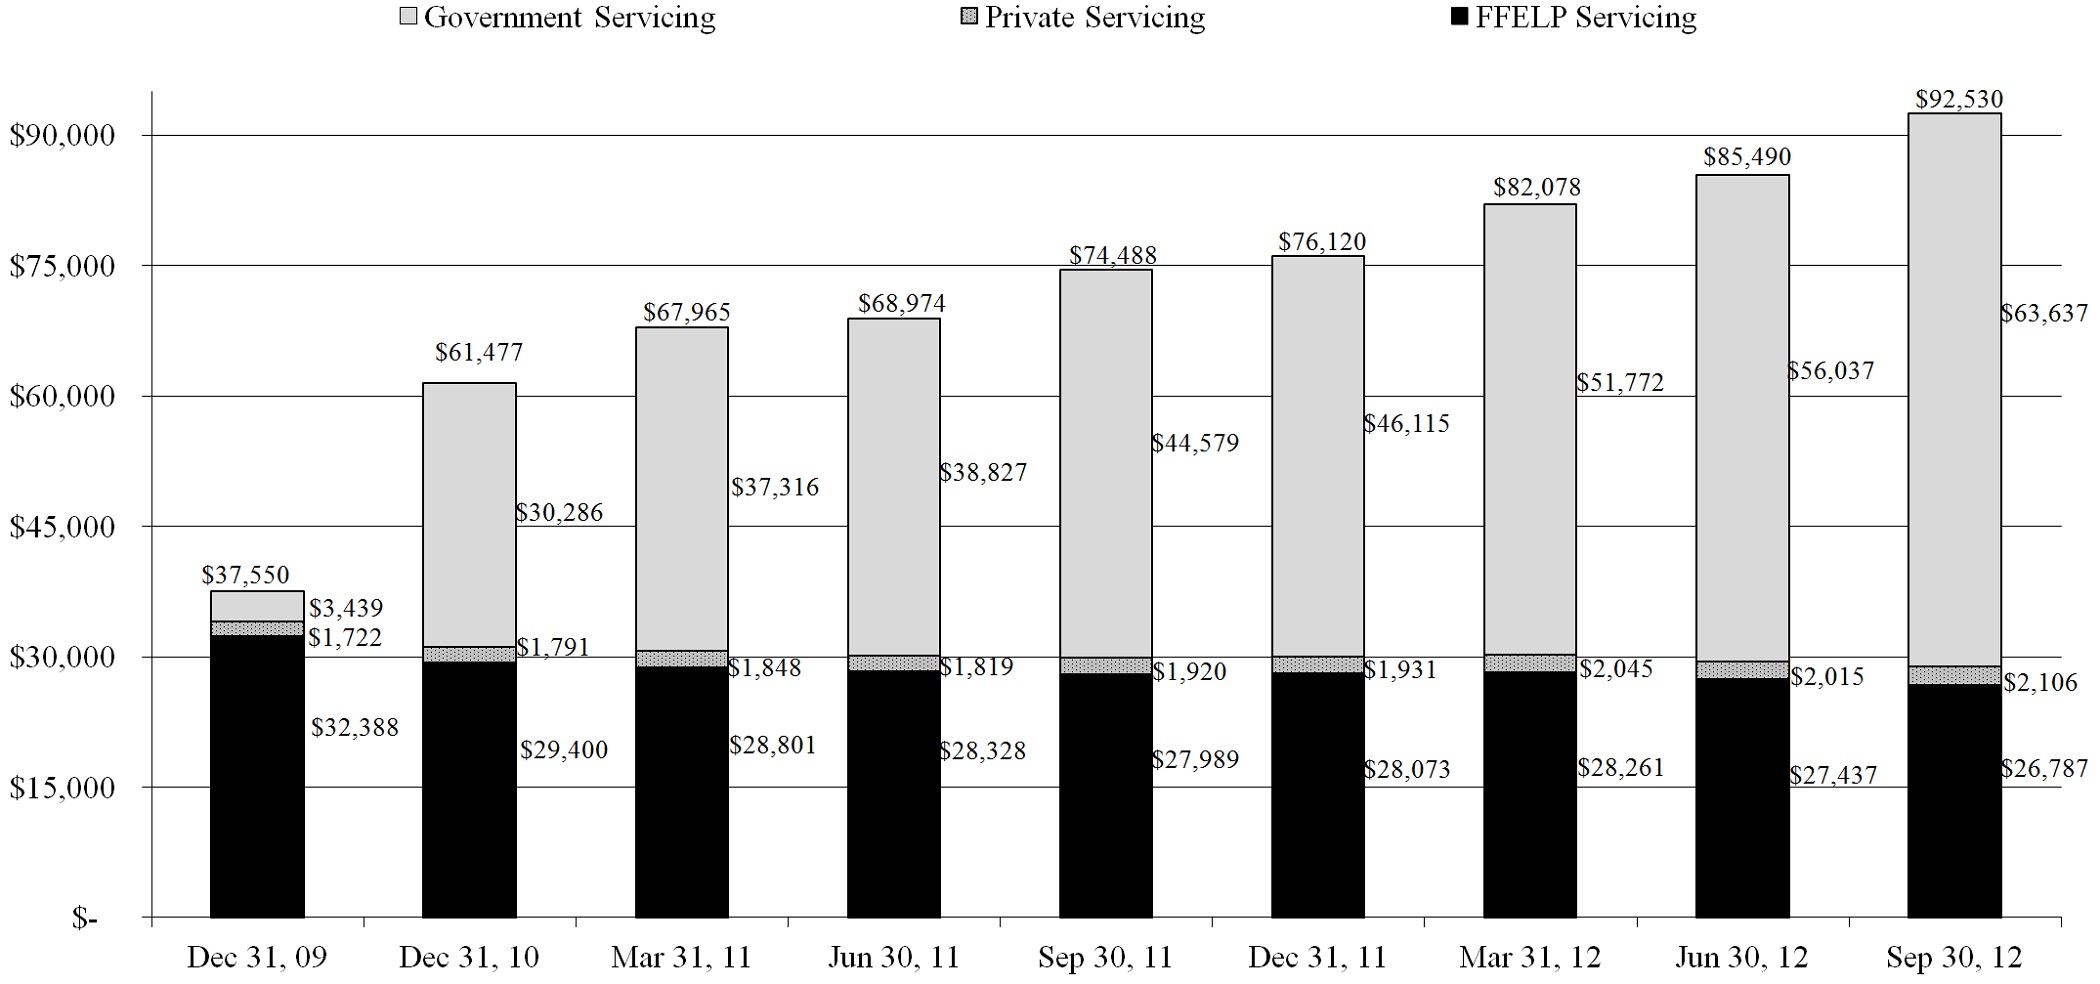
Company owned | $23,139 | $23,727 | $23,249 | $22,757 | $22,503 | $22,650 | $22,277 | $21,926 | $21,504 | |||||||||||||||||
% of total | 61.6% | 38.6% | 34.2% | 33.0% | 30.2% | 29.8% | 27.1% | 25.6% | 23.2% | |||||||||||||||||
Number of servicing borrowers: | ||||||||||||||||||||||||||
Government servicing: | 441,913 | 2,804,502 | 2,814,142 | 2,666,183 | 2,966,706 | 3,036,534 | 3,096,026 | 3,137,583 | 3,588,412 | |||||||||||||||||
FFELP servicing: | 2,311,558 | 1,912,748 | 1,870,538 | 1,837,272 | 1,812,582 | 1,799,484 | 1,779,245 | 1,724,087 | 1,659,020 | |||||||||||||||||
Total: | 2,753,471 | 4,717,250 | 4,684,680 | 4,503,455 | 4,779,288 | 4,836,018 | 4,875,271 | 4,861,670 | 5,247,432 | |||||||||||||||||
Number of remote hosted borrowers | 684,996 | 545,456 | 529,682 | 514,538 | 579,600 | 9,566,296 | 8,645,463 | 7,909,300 | 7,505,693 | |||||||||||||||||
Derivative Market Value and Foreign Currency Adjustments
The following table summarizes the components of “derivative market value and foreign currency adjustments” included in the attached condensed consolidated statements of income.
Three months ended | Nine months ended | ||||||||||||||
September 30, 2012 | June 30, 2012 | September 30, 2011 | September 30, 2012 | September 30, 2011 | |||||||||||
Change in fair value of derivatives - income (expense) | $ | (5,425 | ) | (78,758 | ) | (87,341 | ) | (67,349 | ) | (18,683 | ) | ||||
Foreign currency transaction adjustment - income (expense) | (20,799 | ) | 59,226 | 73,453 | 6,186 | (10,902 | ) | ||||||||
Derivative market value and foreign currency adjustments - income (expense) | $ | (26,224 | ) | (19,532 | ) | (13,888 | ) | (61,163 | ) | (29,585 | ) | ||||
14
Derivative Settlements, net
The following table summarizes the components of "derivative settlements, net" included in the attached condensed consolidated statements of income.
Three months ended | Nine months ended | ||||||||||||||
September 30, 2012 | June 30, 2012 | September 30, 2011 | September 30, 2012 | September 30, 2011 | |||||||||||
Settlements: | |||||||||||||||
1:3 basis swaps | $ | 1,100 | 1,169 | 321 | 3,651 | 902 | |||||||||
T-Bill/LIBOR basis swaps | — | — | (69 | ) | — | (263 | ) | ||||||||
Interest rate swaps - floor income hedges | (5,595 | ) | (3,505 | ) | (3,482 | ) | (12,237 | ) | (16,045 | ) | |||||
Interest rate swaps - hybrid debt hedges | (733 | ) | (723 | ) | (250 | ) | (1,479 | ) | (744 | ) | |||||
Cross-currency interest rate swaps | 227 | 1,055 | 3,745 | 3,390 | 8,625 | ||||||||||
Other | (50 | ) | (82 | ) | (8 | ) | (235 | ) | 108 | ||||||
Total settlements - (expense) income | $ | (5,051 | ) | (2,086 | ) | 257 | (6,910 | ) | (7,417 | ) | |||||
Student Loans Receivable
The tables below outline the components of the Company’s student loan portfolio:
As of | As of | As of | |||||||
September 30, 2012 | December 31, 2011 | September 30, 2011 | |||||||
Federally insured loans: | |||||||||
Stafford and other | $ | 6,652,639 | 7,480,182 | 7,573,717 | |||||
Consolidation | 15,962,969 | 16,852,527 | 17,081,935 | ||||||
Total | 22,615,608 | 24,332,709 | 24,655,652 | ||||||
Non-federally insured loans | 29,272 | 26,916 | 29,061 | ||||||
22,644,880 | 24,359,625 | 24,684,713 | |||||||
Loan discount, net of unamortized loan premiums and deferred origination costs | (37,330 | ) | (13,267 | ) | 2,674 | ||||
Allowance for loan losses – federally insured loans | (35,614 | ) | (37,205 | ) | (35,190 | ) | |||
Allowance for loan losses – non-federally insured loans | (12,595 | ) | (11,277 | ) | (10,583 | ) | |||
$ | 22,559,341 | 24,297,876 | 24,641,614 | ||||||
Allowance for federally insured loans as a percentage of such loans | 0.16 | % | 0.15 | % | 0.14 | % | |||
Allowance for non-federally insured loans as a percentage of such loans | 43.03 | % | 41.90 | % | 36.42 | % | |||
15
Student Loan Spread
The following table analyzes the student loan spread on the Company’s portfolio of student loans, which represents the spread between earnings on student loan assets and the costs of the liabilities and derivative instruments used to fund those assets.
Three months ended | Nine months ended | ||||||||||||||
September 30, 2012 | June 30, 2012 | September 30, 2011 | September 30, 2012 | September 30, 2011 | |||||||||||
Variable student loan yield, gross | 2.65 | % | 2.63 | % | 2.57 | % | 2.63 | % | 2.58 | % | |||||
Consolidation rebate fees | (0.75 | ) | (0.75 | ) | (0.73 | ) | (0.75 | ) | (0.72 | ) | |||||
Premium and deferred origination costs amortization, net of discount accretion | — | (0.01 | ) | (0.03 | ) | (0.01 | ) | (0.11 | ) | ||||||
Variable student loan yield, net | 1.90 | 1.87 | 1.81 | 1.87 | 1.75 | ||||||||||
Student loan cost of funds - interest expense | (0.97 | ) | (0.98 | ) | (0.82 | ) | (0.99 | ) | (0.83 | ) | |||||
Student loan cost of funds - bonds and notes payable discount accretion | (0.11 | ) | (0.11 | ) | (0.11 | ) | (0.11 | ) | (0.04 | ) | |||||
Student loan cost of funds - derivative settlements | 0.02 | 0.03 | 0.06 | 0.04 | 0.05 | ||||||||||
Variable student loan spread | 0.84 | 0.81 | 0.94 | 0.81 | 0.93 | ||||||||||
Fixed rate floor income, net of settlements on derivatives | 0.60 | 0.62 | 0.65 | 0.62 | 0.59 | ||||||||||
Core student loan spread | 1.44 | % | 1.43 | % | 1.59 | % | 1.43 | % | 1.52 | % | |||||
Average balance of student loans | $ | 23,028,904 | 23,863,104 | 24,794,416 | 23,670,300 | 23,891,512 | |||||||||
Average balance of debt outstanding | 23,467,899 | 23,953,317 | 24,979,332 | 23,833,140 | 24,118,465 | ||||||||||
A trend analysis of the Company's core and variable student loan spreads is summarized below.
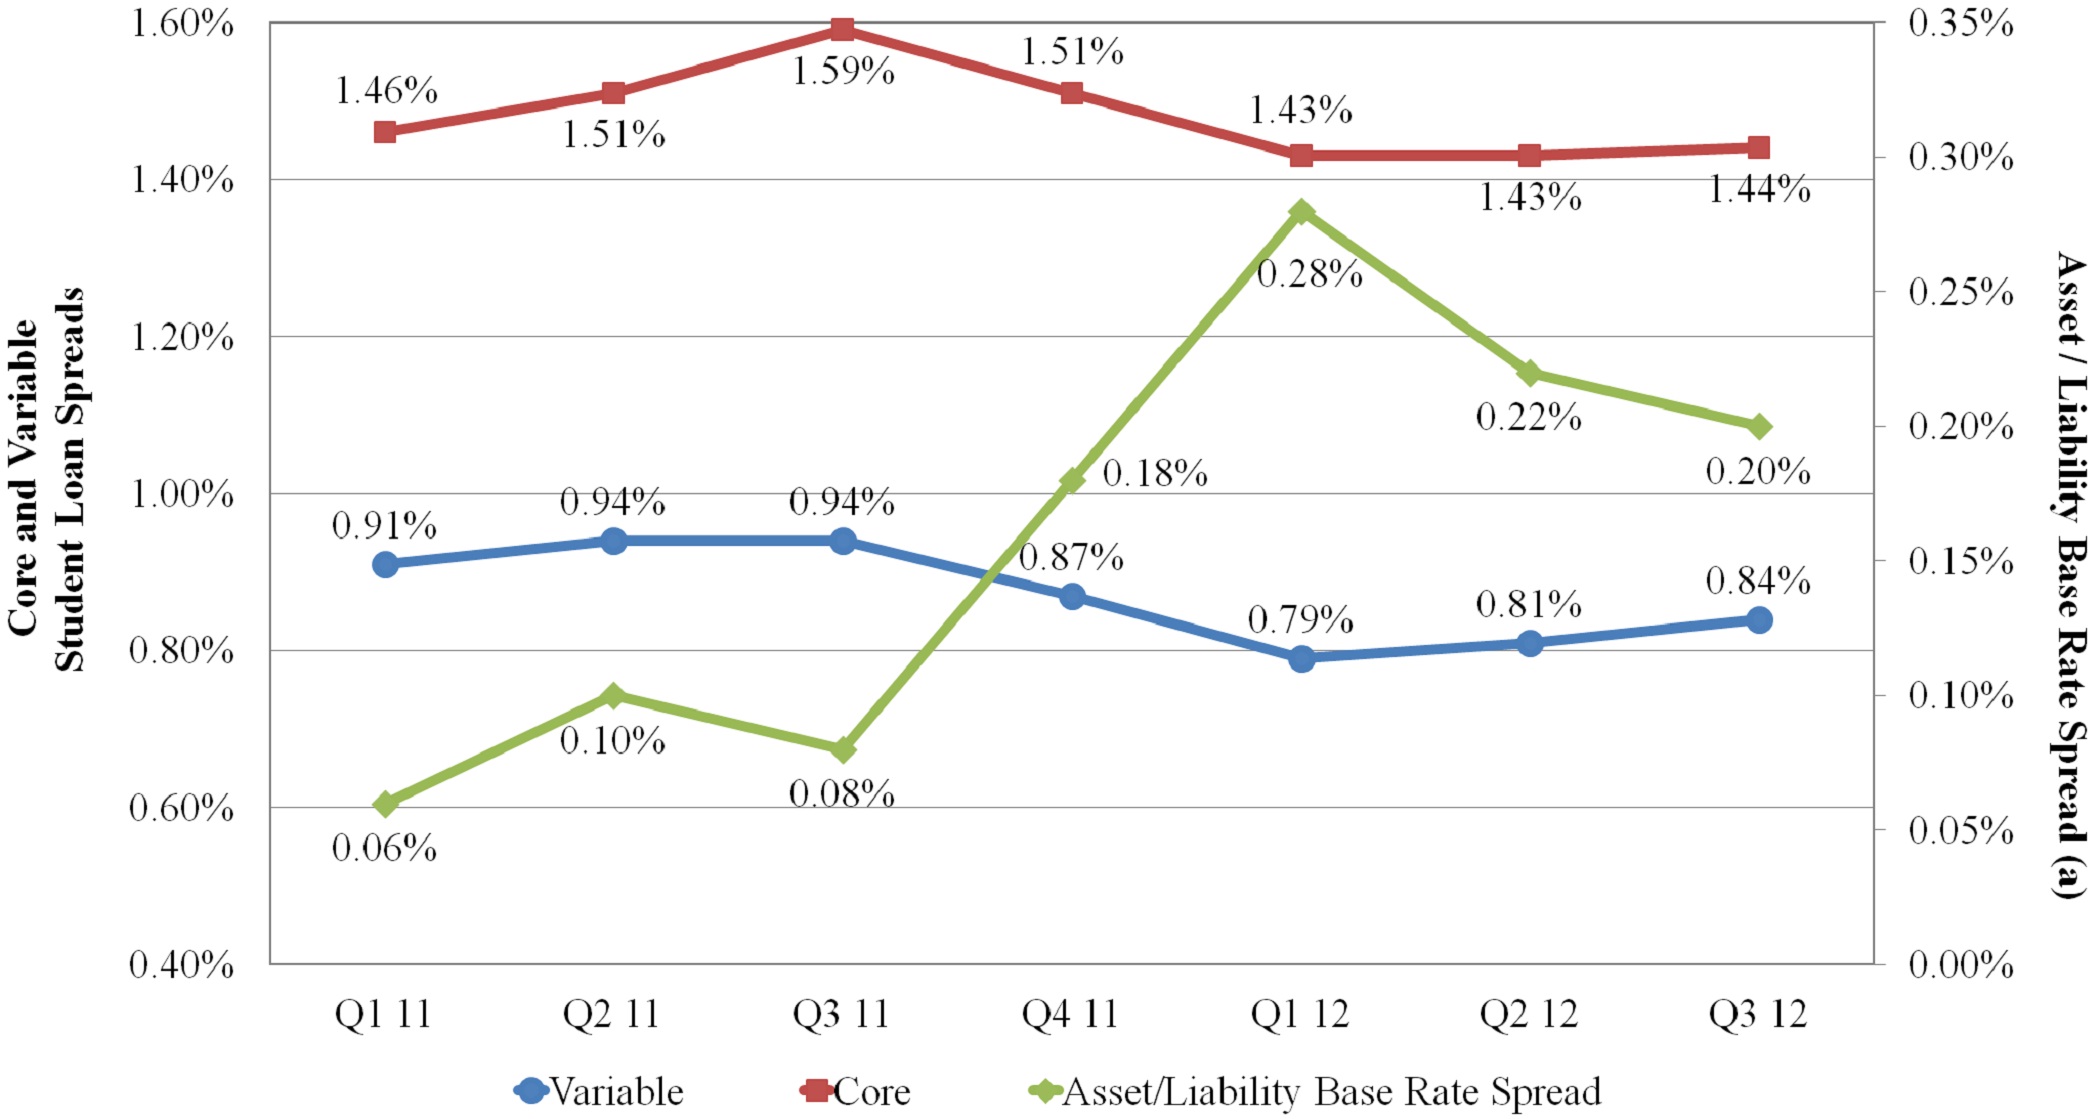
(a) | Prior to April 1, 2012, the interest earned on the majority of the Company's FFELP student loan assets was indexed to the three-month commercial paper index. As allowed by recent legislation, effective April 1, 2012, the Company elected to change the index on which the Special Allowance Payments are calculated for FFELP loans from the commercial paper rate to the one-month LIBOR rate. The Company funds the majority of its assets with three-month LIBOR indexed floating rate securities. |
16
The relationship between the indices in which the Company earns interest on its loans and funds such loans has a significant impact on student loan spread. This table (the right axis) shows the difference between the Company's liability base rate and the one-month LIBOR (Q2 2012 - Q3 2012) or commercial paper rate indices (Q1 2011 - Q1 2012) by quarter.
Variable student loan spread decreased during the three and nine months ended September 30, 2012 as compared to the same periods in 2011 as a result of the widening of the Asset/Liability Base Rate Spread as reflected in the above table.
The primary difference between variable student loan spread and core student loan spread is fixed rate floor income, net of settlements on derivatives. A summary of fixed rate floor income and its contribution to core student spread follows:
Three months ended | Nine months ended | ||||||||||||||
September 30, 2012 | June 30, 2012 | September 30, 2011 | September 30, 2012 | September 30, 2011 | |||||||||||
Fixed rate floor income, gross | $ | 40,331 | 40,489 | 44,080 | 122,049 | 121,126 | |||||||||
Derivative settlements (a) | (5,595 | ) | (3,505 | ) | (3,482 | ) | (12,237 | ) | (16,045 | ) | |||||
Fixed rate floor income, net | $ | 34,736 | 36,984 | 40,598 | 109,812 | 105,081 | |||||||||
Fixed rate floor income contribution to spread, net | 0.60 | % | 0.62 | % | 0.65 | % | 0.62 | % | 0.59 | % | |||||
(a) | Includes settlement payments on derivatives used to hedge student loans earning fixed rate floor income. |
The high levels of fixed rate floor income earned during 2012 and 2011 are due to historically low interest rates. If interest rates remain low, the Company anticipates continuing to earn significant fixed rate floor income in future periods.
Fixed Rate Floor Income
The following table shows the Company’s student loan assets that are earning fixed rate floor income as of September 30, 2012:
Borrower/ | Estimated | ||||||||
Fixed | lender | variable | |||||||
interest | weighted | conversion | Loan | ||||||
rate range | average yield | rate (a) | Balance | ||||||
3.0 - 3.49% | 3.20% | 0.56% | $ | 2,056,472 | |||||
3.5 - 3.99% | 3.65% | 1.01% | 1,871,109 | ||||||
4.0 - 4.49% | 4.20% | 1.56% | 1,416,670 | ||||||
4.5 - 4.99% | 4.72% | 2.08% | 801,024 | ||||||
5.0 - 5.49% | 5.24% | 2.60% | 538,545 | ||||||
5.5 - 5.99% | 5.66% | 3.02% | 337,149 | ||||||
6.0 - 6.49% | 6.18% | 3.54% | 384,131 | ||||||
6.5 - 6.99% | 6.70% | 4.06% | 339,631 | ||||||
7.0 - 7.49% | 7.17% | 4.53% | 135,562 | ||||||
7.5 - 7.99% | 7.70% | 5.06% | 230,588 | ||||||
8.0 - 8.99% | 8.17% | 5.53% | 510,145 | ||||||
> 9.0% | 9.04% | 6.40% | 240,433 | ||||||
$ | 8,861,459 | ||||||||
(a) | The estimated variable conversion rate is the estimated short-term interest rate at which loans would convert to a variable rate. As of September 30, 2012, the weighted average estimated variable conversion rate was 2.05%. As of September 30, 2012, the short-term interest rate was 24 basis points. |
17
The following table summarizes the outstanding derivative instruments as of September 30, 2012 used by the Company to hedge loans earning fixed rate floor income.
Maturity | Notional amount | Weighted average fixed rate paid by the Company (a) | |||||||
2013 | $ | 3,150,000 | 0.71 | % | |||||
2014 | 1,750,000 | 0.71 | |||||||
2015 | (b) | 1,100,000 | 0.89 | ||||||
2016 | 750,000 | 0.85 | |||||||
2017 | 750,000 | 0.99 | |||||||
$ | 7,500,000 | 0.78 | % | ||||||
(a) | For all interest rate derivatives, the Company receives discrete three-month LIBOR. |
(b) | $500 million of these derivatives have a forward effective start date in 2013. |
Future Cash Flow from Portfolio
The majority of the Company’s portfolio of student loans is funded in asset-backed securitizations that are structured to substantially match the maturity of the funded assets, thereby minimizing liquidity risk. In addition, due to (i) the difference between the yield the Company receives on the loans and cost of financing within these transactions, and (ii) the excess servicing and administration fees the Company earns from these transactions, the Company has created a portfolio that will generate earnings and significant cash flow over the life of these transactions.
As of September 30, 2012, based on cash flow models developed to reflect management’s current estimate of, among other factors, prepayments, defaults, deferment, forbearance, and interest rates, the Company currently expects future undiscounted cash flows from its portfolio to be approximately $1.88 billion as detailed below. The $1.88 billion includes approximately $407.1 million (as of September 30, 2012) of overcollateralization included in the asset-backed securitizations. These excess net asset positions are reflected variously in the following balances on the consolidated balance sheet: "student loans receivable," "restricted cash and investments," and "accrued interest receivable."
The forecasted cash flow presented below includes all loans currently funded in asset-backed securitizations. As of September 30, 2012, the Company had $20.2 billion of loans included in asset-backed securitizations, which represented 89 percent of its total FFELP student loan portfolio. The forecasted cash flow does not include cash flows that the Company expects to receive related to loans funded through the Department of Education’s Conduit Program and other warehouse facilities or loans acquired subsequent to September 30, 2012.
18
FFELP Asset-backed Securitization Cash Flow Forecast (a)
$1.88 billion
(dollars in millions)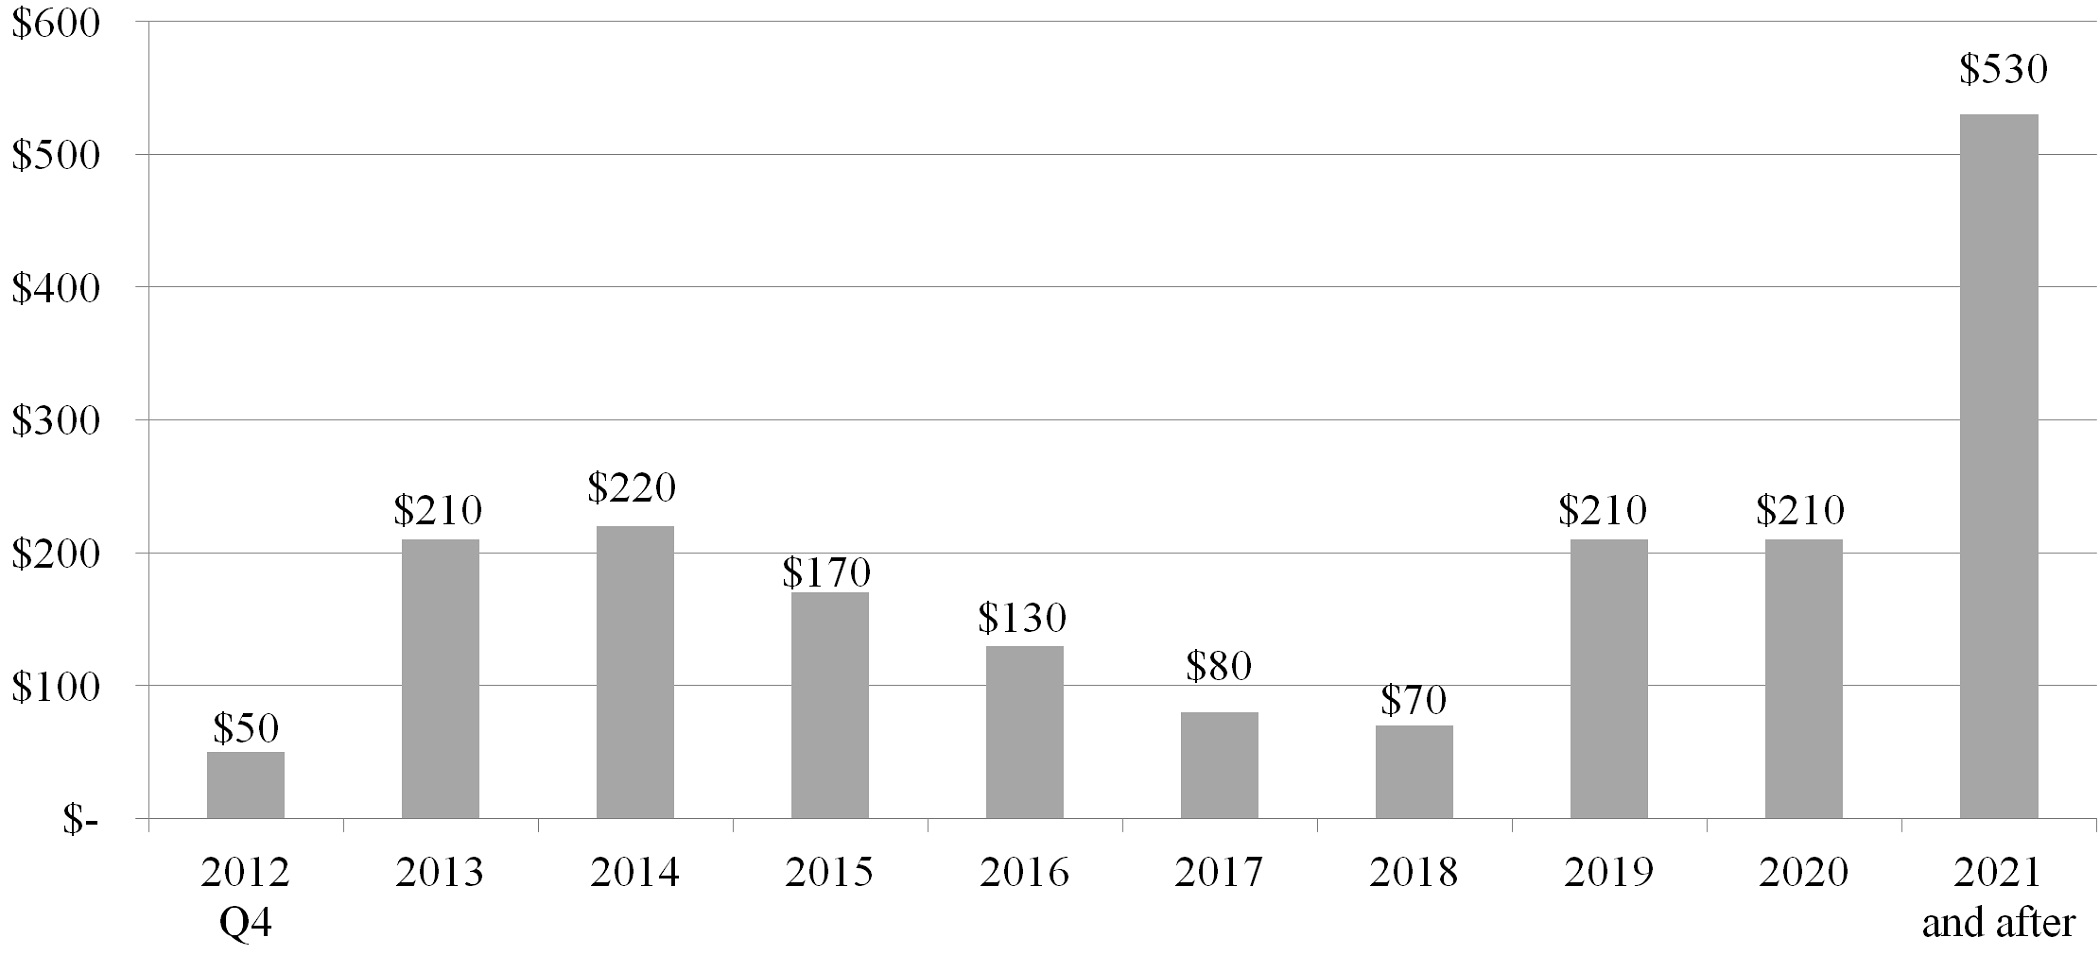
(a) | The Company uses various assumptions, including prepayments and future interest rates, when preparing its cash flow forecast. These assumptions are further discussed below. |
Prepayments: The primary variable in establishing a life of loan estimate is the level and timing of prepayments. Prepayment rates equal the amount of loans that prepay annually as a percentage of the beginning of period balance, net of scheduled principal payments. A number of factors can affect estimated prepayment rates, including the level of consolidation activity and default rates. Should any of these factors change, management may revise its assumptions, which in turn would impact the projected future cash flow. The Company’s cash flow forecast above assumes prepayment rates that are generally consistent with those utilized in the Company’s recent asset-backed securities transactions. If management used a prepayment rate assumption two times greater than what was used to forecast the cash flow, the cash flow forecast would be reduced by approximately $300 million to $360 million.
Interest rates: The Company funds the majority of its student loans with three-month LIBOR ("LIBOR") indexed floating rate securities. Meanwhile, the interest earned on the Company’s student loan assets are indexed primarily to a one-month LIBOR rate. The different interest rate characteristics of the Company’s loan assets and liabilities funding these assets result in basis risk. The Company’s cash flow forecast assumes three-month LIBOR will exceed one-month LIBOR by 12 basis points for the life of the portfolio, which approximates the historical relationship between these indices. If the forecast is computed assuming a spread of 24 basis points between three-month and one-month LIBOR for the life of the portfolio, the cash flow forecast would be reduced by approximately $60 million to $100 million.
The Company uses the current forward interest rate yield curve to forecast cash flows. A change in the forward interest rate curve would impact the future cash flows generated from the portfolio. An increase in future interest rates will reduce the amount of fixed rate floor income the Company is currently receiving. The Company attempts to mitigate the impact of a rise in short-term rates by hedging interest rate risks. As of September 30, 2012, the net fair value of the Company’s interest rate derivatives used to hedge loans earning fixed rate floor income was a liability of $52.4 million.
Sources of Liquidity Currently Available
As of September 30, 2012, the Company had $629.8 million of liquidity available for use (as summarized below). In addition, the Company generates a significant amount of cash from operations. The Company will continue to use its strong liquidity position to capitalize on market opportunities, including FFELP student loan acquisitions; strategic acquisitions and investments in its core business areas of loan financing, loan servicing, payment processing, and enrollment services (education planning); and capital management initiatives, including stock repurchases, debt repurchases, and dividend distributions.
19
The following table details the Company’s sources of liquidity currently available under existing balances and arrangements:
As of September 30, 2012 | |||
Sources of primary liquidity: | |||
Cash and cash equivalents | $ | 93,674 | |
Investments | 92,860 | ||
Unencumbered private student loan assets | 20,972 | ||
Asset-backed security investments - Class B subordinated notes (a) | 104,113 | ||
Asset-backed security investments (b) | 68,145 | ||
Available balance on unsecured line of credit | 250,000 | ||
Total sources of primary liquidity | $ | 629,764 | |
(a) | As part of the Company’s issuance of asset-backed securitizations in 2008 and 2012, the Company purchased the Class B subordinated notes of $76.5 million (par value) and $27.6 million (par value), respectively. These notes are not included on the Company’s consolidated balance sheet. Upon a sale of these notes to third parties, the Company would obtain cash proceeds equal to the market value of the notes on the date of such sale. The amount included in the table above is the par value of these subordinated notes and may not represent market value upon sale of the notes. |
(b) | The Company has repurchased its own asset-backed securities (bonds and notes payable). For accounting purposes, these notes are effectively retired and are not included on the Company’s consolidated balance sheet. However, as of September 30, 2012, $68.1 million of these securities are legally outstanding at the trust level and the Company could sell these notes to third parties or redeem the notes at par as cash is generated by the trust estate. Upon a sale to third parties, the Company would obtain cash proceeds equal to the market value of the notes on the date of such sale. The amount included in the table above is the par value of these notes and may not represent market value upon sale of the notes. |
Subsequent Events
Secured Financing Transactions and Student Loan Acquisitions
On October 11, 2012 and November 8, 2012, the Company completed asset-backed securitizations of $937.5 million and $1.2 billion, respectively. Notes issued in these transactions carry interest rates based on a spread to one-month LIBOR. The Company used the proceeds from the issuance of these notes to finance student loans previously financed in other secured borrowings, including the Company's warehouse facilities and the Department's Conduit Program. In addition, the proceeds from these notes were used to purchase a total of $1.1 billion of FFELP student loans from third parties from October 1, 2012 through November 8, 2012. The Company anticipates purchasing additional FFELP loans during the remainder of 2012.
Cash Dividend
On November 8, 2012, the Company's Board of Directors declared a cash dividend on its outstanding shares of Class A and Class B common stock of $1.10 per share. The dividend consists of a regular quarterly dividend of $0.10 per share, and a special cash dividend of $1.00 per share. Both dividend payments will be paid on November 27, 2012 to shareholders of record at the close of business on November 19, 2012.
20