Attached files
| file | filename |
|---|---|
| 8-K - FORM 8-K - Chaparral Energy, Inc. | d432008d8k.htm |
 $150mm Senior Notes
Add-On November 2012
$150mm Senior Notes Add-On
November 2012
Exhibit 99.1 |
 2
22
2
This presentation contains "forward-looking statements" within the meaning of Section 27A of
the Securities Act of 1933, as amended, and Section 21E of the Securities Exchange Act of 1934,
as amended. These forward-looking statements are subject to certain risks, trends and
uncertainties that could cause actual results to differ materially from those projected.
Among those risks, trends and uncertainties are our ability to find oil and natural gas reserves
that are economically recoverable, the volatility of oil and natural gas prices and significantly
depressed natural gas prices since the middle of 2008, the uncertain economic conditions in the
United States and globally, the decline in the values of our properties that have resulted in and
may in the future result in additional ceiling test write- downs, our ability to replace
reserves and sustain production, our estimate of the sufficiency of our existing capital sources,
our ability to raise additional capital to fund cash requirements for future operations, the
uncertainties involved in prospect development and property acquisitions or dispositions and in
projecting future rates of production or future reserves, the timing of development the oil spill
in the Gulf of Mexico on our present and future operations, the impact of government
regulation,
and
the
operating
hazards
attendant
to
the
oil
and
natural
gas
business.
In
particular,
careful consideration should be given to cautionary statements made in the various reports we
have filed with the Securities and Exchange Commission. We undertake no duty to update or
revise these
forward-looking statements.
expenditures
and
drilling
of
wells,
hurricanes
and
other
natural
disasters,
including
the
impact
of |
 3
3
Presenters
Presenters
Mark Fischer, Chief Executive Officer
& President
Joe Evans, Chief Financial Officer
& Executive Vice President |
 Chaparral Overview
Founded in 1988, Based in Oklahoma City
Core areas —
Mid-Continent (Oklahoma) and Permian Basin (W. Texas)
Oil-weighted producer (64% oil; 36% gas); R/P ratio 18.6 years
Second largest oil producer in Oklahoma
Stable
1P
base
with
large
potential
upside
–
742
MMBoe
Near-term growth potential through drilling in
conventional & emerging plays ~
450,000 acres Long-term
growth
through
CO
2
EOR
–
74
fields
1
As of 12/31/11 using SEC methodology
Company Statistics
Production (Boe/d)
Proved Reserves (MMBoe)
1
Proved Reserves PV-10 ($mm)
1
TTM EBITDA ($mm)
4
4
~23,300
156.3
$2,309
$305
Q2, 2012 |
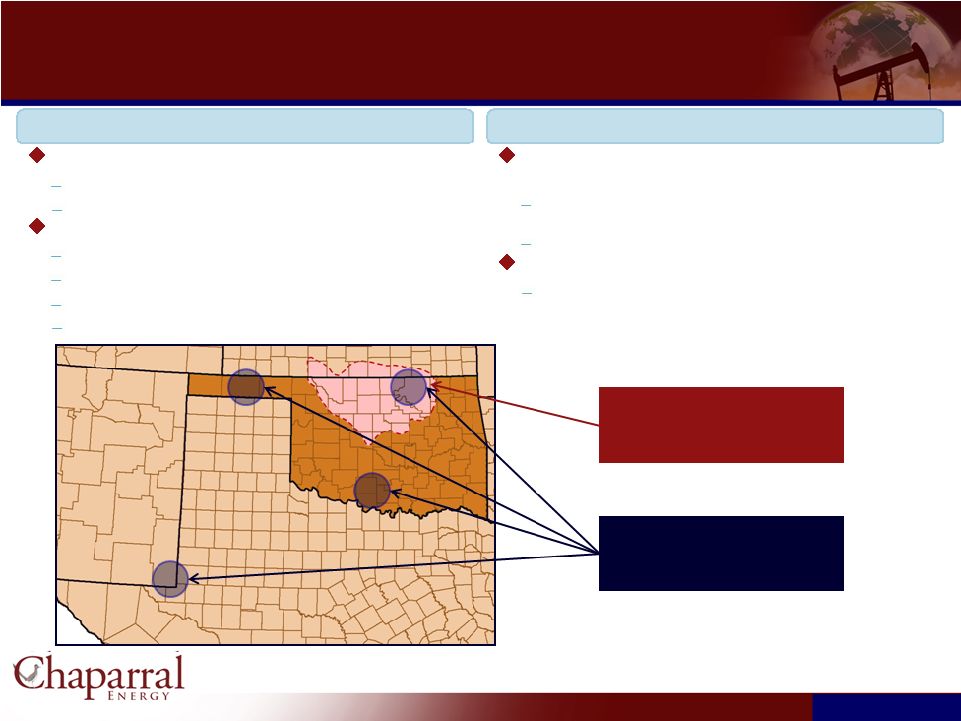
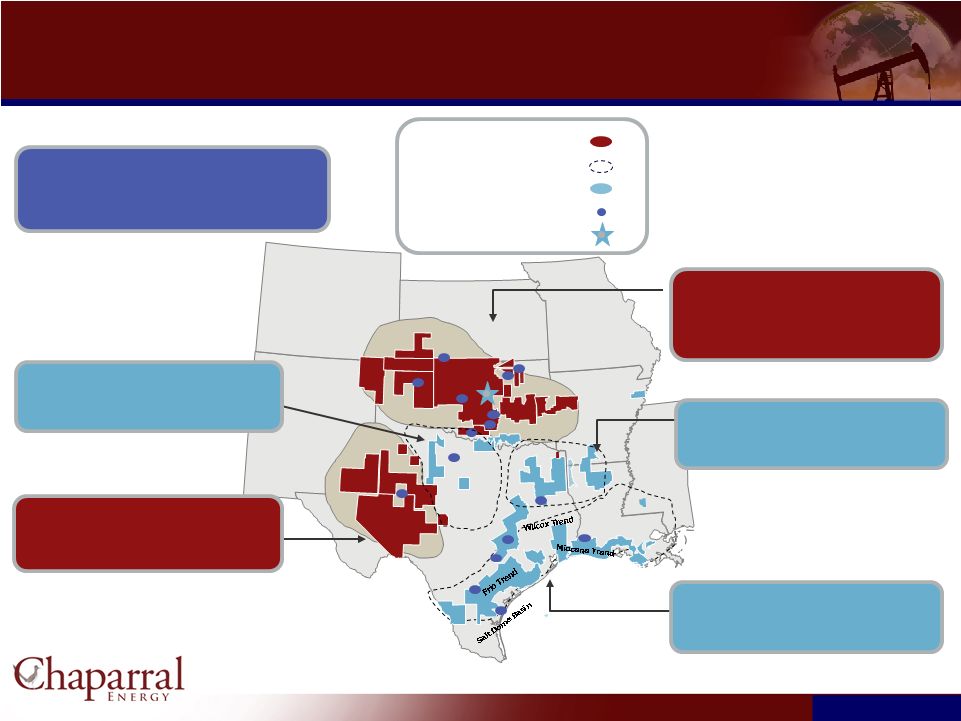 Operating Areas
As of December 31, 2011 (SEC)
Val Verde
Basin
5
5
Sabine
Uplift
Midland
Basin
Delaware
Basin
Ouachita
Uplift
Arkoma
Basin
Fort
Worth
Basin
Anadarko
Woodford
Basin
OKC
Company Total
December
2011
proved
reserves
–
156.3
MMBoe
2011
average
daily
production
–
23.7
MBoe/d
Acreage (gross / net): 1,178,489 / 590,324
North Texas
Reserves: 3.9 MMBoe, 3% of total
Production: 0.5 Mboe/d, 2% of total
Permian Basin
Reserves: 19.3 MMBoe, 12% of total
Production: 3.6 MBoe/d, 15% of total
Core Area
Growth Area
Acreage
Field Offices
Headquarters
Mid-Continent
(Anadarko Basin & Central Oklahoma)
Reserves: 122.2 MMBoe, 78% of total
Production: 17.0 MBoe/d, 72% of total
Ark-La-Tex
Reserves: 7.2 MMBoe, 5% of total
Production: 1.3 MBoe/d, 6% of total
Gulf Coast
Reserves: 3.2 MMBoe, 2% of total
Production: 0.9 MBoe/d, 4% of total |
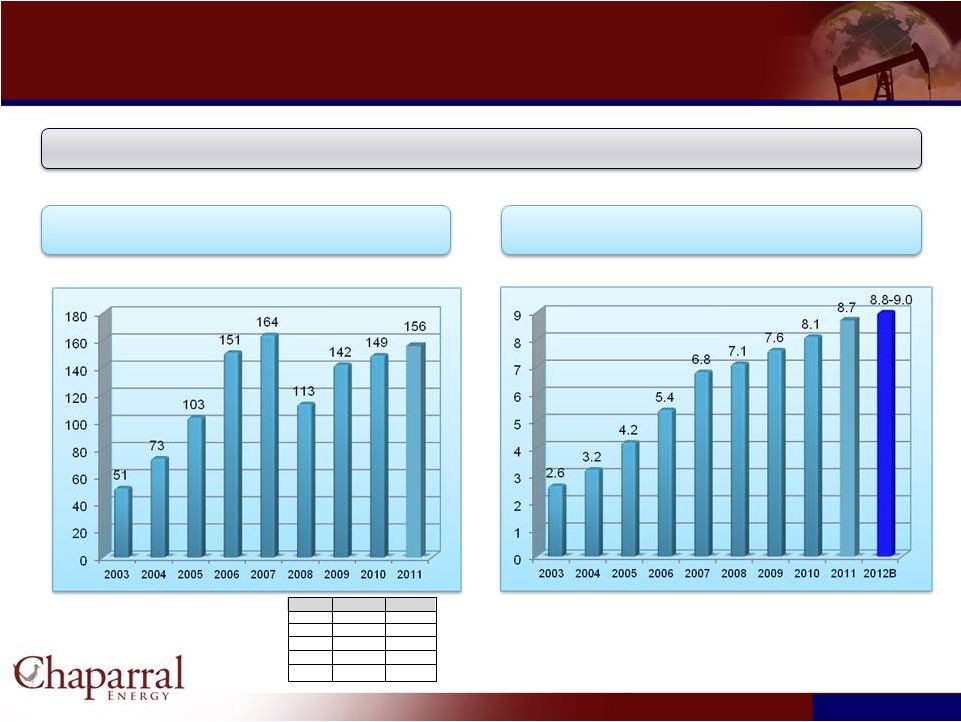 Strong Record of Reserve
and Production Growth Strong Record of Reserve and Production Growth
2003 –
2011 CAGR = 15%
2003 –
2011 CAGR = 16%
6
6
1)
Reserves as of December 31
for each year calculated
using flat SEC
pricing per the following:
6
6
Year-End SEC Reserves (MMBoe)
(1)
Annual Production (MMBoe)
Chaparral’s reserve replacement ratio averaged 422% per year since 2003
Year
Oil
Gas
2007
$96.01
$6.80
2008
$44.60
$5.62
2009
$61.18
$3.87
2010
$79.43
$4.38
2011
$
96.19
$4.11 |
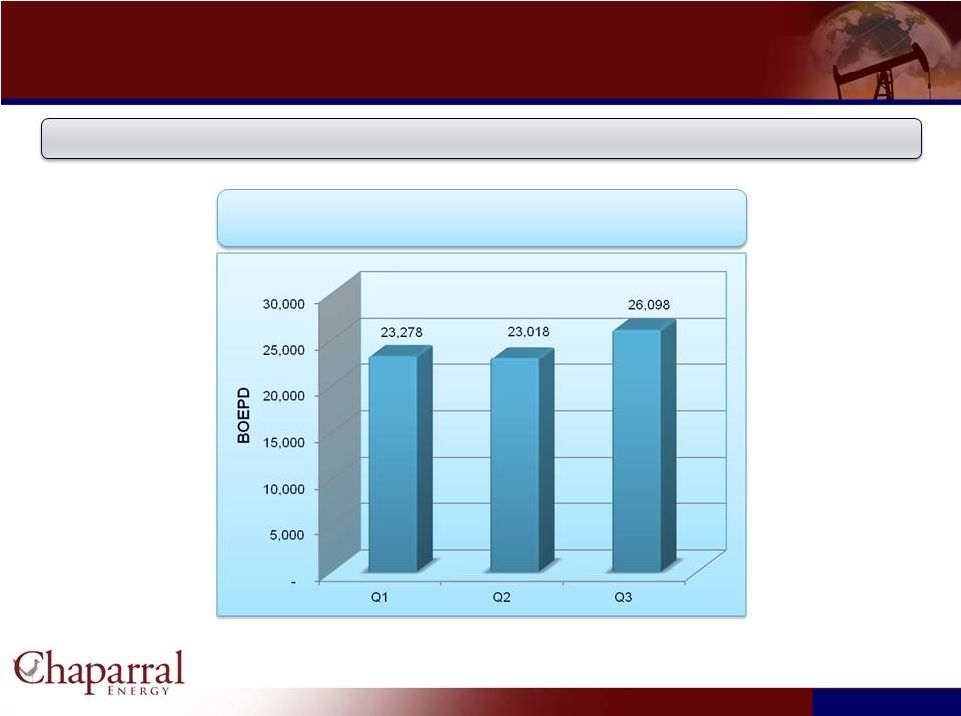 Current Production
- 2012
Current Production -
2012
7
7
7
7
2012 Production by Quarter
In the 3
rd
Quarter Chaparral increased production by 13.4% over the previous quarter
|
 Financial Position to
Execute Strategy Financial Position to Execute Strategy
8
8
*Pro-Forma for $150mm Senior Notes Add-On and Increased Borrowing Base
Current Maturity Profile ($mm)
Liquidity ($mm)
Net Debt / EBITDA
Strong Financial Position
No senior note maturities before 2020
Hedge positions in place to secure cash flow
in near term
Budget CAPEX within free cash flow
(including divestiture proceeds) |
 2012 Capital Budget ($ millions) 2012 Capital Budget ($ millions)
Key Drilling Areas
Northern OK Mississippi
Horizontal
$73
Anadarko Cleveland Sand
46
Anadarko Granite Wash
22
Marmaton
15
Bone Spring / Avalon
10
Hogshooter
7
Other
28
Total
$201
9
9
EOR Field
N. Burbank
$104
Panhandle Area
60
Other
3
Total
$168
*99% of Capital Program is Oil Focused
Component
2008
2009
2010
2011
2012
Budget
2012
Expanded
Budget
2012
%
Drilling
$168
$76
$196
$172
$131
$201
44%
EOR
24
14
36
86
127
168
37%
Enhancements
53
32
39
32
26
16
3%
Acquisitions
46
18
41
17
15
40
9%
Other (P&E,
Capitalized G&A, etc)
48
14
32
28
31
35
7%
Total
$339
$154
$344
$336
$330
$460
100% |
 10
10
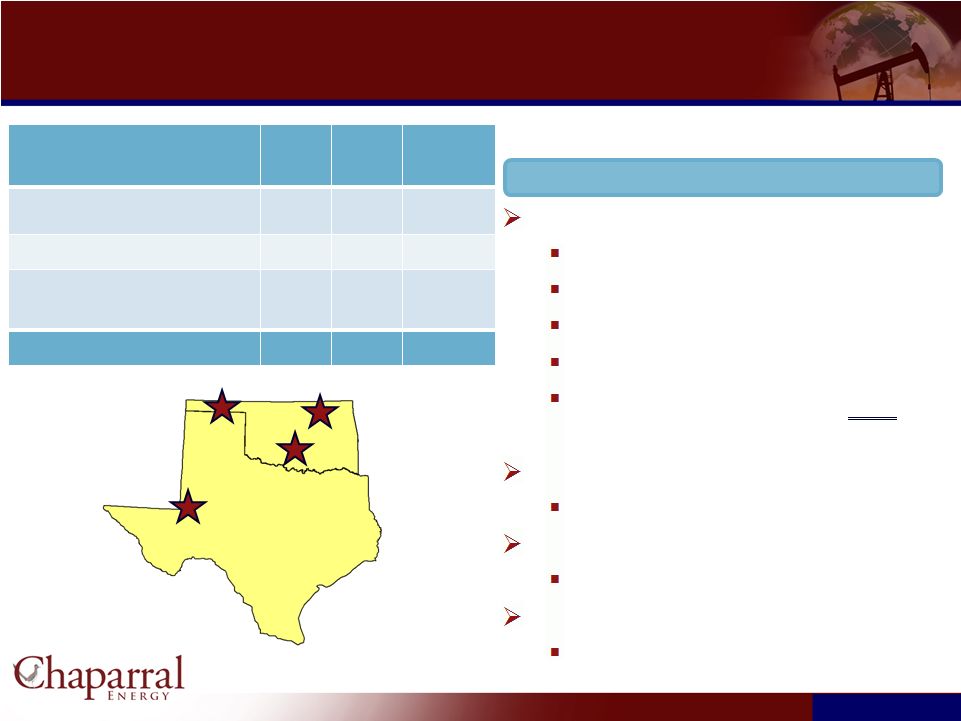
Conventional
drilling
(IRR:
50%
-
75%)
Anadarko Granite Wash
Anadarko Cleveland Sand
Unconventional
resource
play
drilling
(IRR:
35%
-
75%)
Northern Oklahoma Mississippi Play (“NOMP”): 260,000 net acres
Panhandle Marmaton: ~48,000 acres
Anadarko Woodford Shale: ~23,000 acres
Bone Spring/Avalon Shale: ~19,000 acres
Chaparral owns an inventory of 74 possible candidate
CO2-EOR
fields.
Proved reserves of 45.1 MMBoe from EOR designated fields as of
12/31/11
200+ MMBoe of total potential reserves
CO2
fields
exhibit
low-risk
and
stable
production.
IRR: 25% –
40%
Chaparral is Well Positioned for
Near–Term and Long–Term Growth
Near–Term Growth Drivers
Long–Term Growth Drivers
NOMP
CO
2
-EOR Fields |
 Northern Oklahoma
Mississippi Play The Northern Oklahoma Mississippi Play (“NOMP”) is a
key near–term focus area for Chaparral.
Chaparral acreage over 260,000 net acres in the NOMP.
Over 132 MMBoe of potential.
1,600 unrisked drilling well inventory.
Chaparral Acreage
11
11
Overview
NOMP Asset Map
NOMP Well Economics
IP Rates:
100 - 700 Boe/d
EUR:
100 - 400 MBoe
Well Cost:
$2.5 - 4.0 million
% Oil:
60% - 90%
IRR:
35% - 75%
KS
OK |
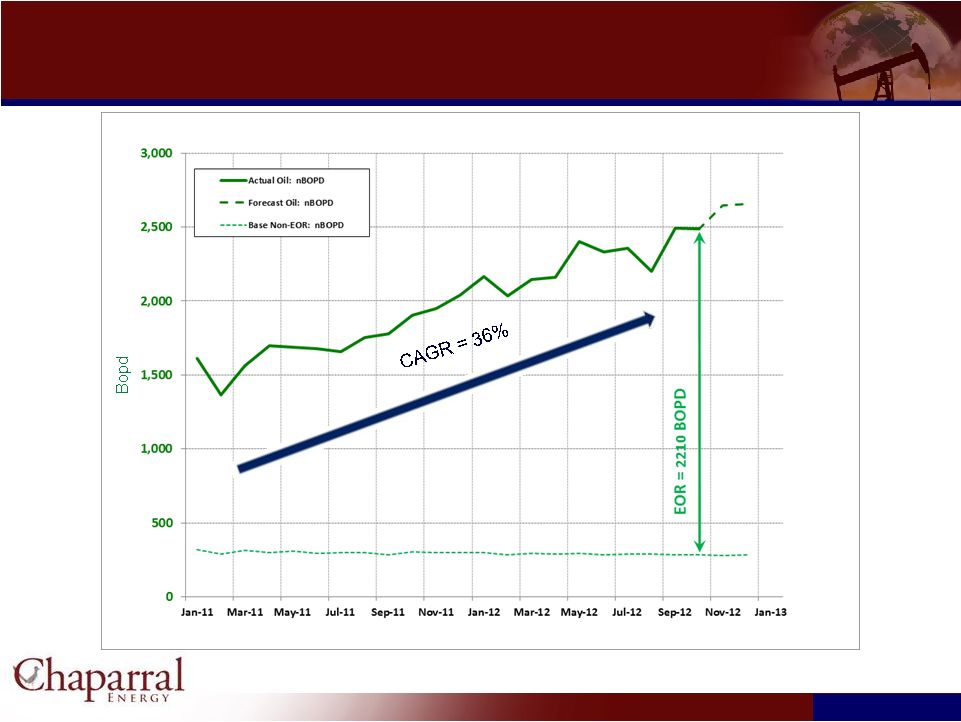
 12
12
NOMP: Recent Results
NOMP: Recent Results
Current
Net
Production
–
4,000
Boepd
2012
Capital
-
$73
mm
NOMP Core (93,000 Net Acres)
Significant industry activity in the play
Drilled or participated in 34 wells to date (18 operated); 2 WOCU
3-5 additional wells in 2012
Average IP ~600 Boepd; Average EUR ~350 MBoe
Current
Net
Production
–
3,375
Boepd
45% Oil
Emerging NOMP (167,000 Net Acres)
In
de-risking
phase
–
industry
activity
increasing
Drilled 6 wells to date
Average IP ~200+ Boepd; Average EUR ~120 MBo
Current
Net
Production
–
625
Boepd
92% Oil |
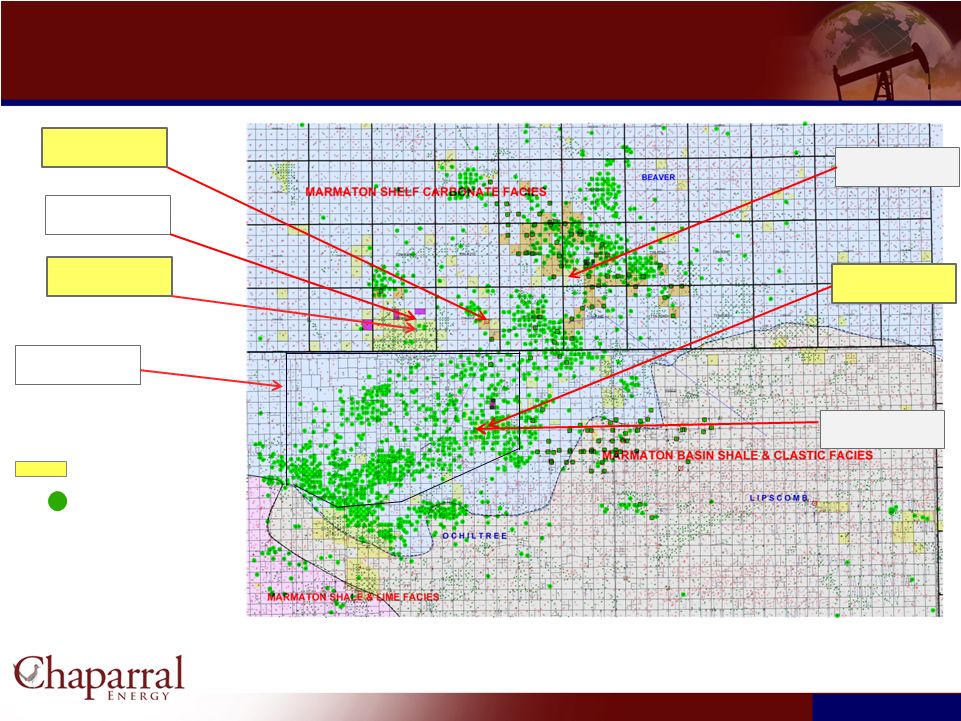 Marmaton Shelf
Play Marmaton Shelf Play
Marmaton Production
Chaparral Acreage
Net Acreage
48,000
EUR/well (Mboe)
150
Cost per Well (MM$)
$3.6
13
13
Johnston 1H-24
IP +300 Boepd
Leatherman 1H-14
2012 Location
Lamaster 1H-23
Flowing back
Buy Area
Ochiltree Co, Tx
Cornell 1H-30
2012 Location
Jay 1H-1098
Flowing back
Wright 1H-1099
2012 Location |
 Chaparral:
A Growing Mid-Continent
CO
2
EOR Company
A Growing Mid-Continent
CO
2
EOR Company
14
14 |
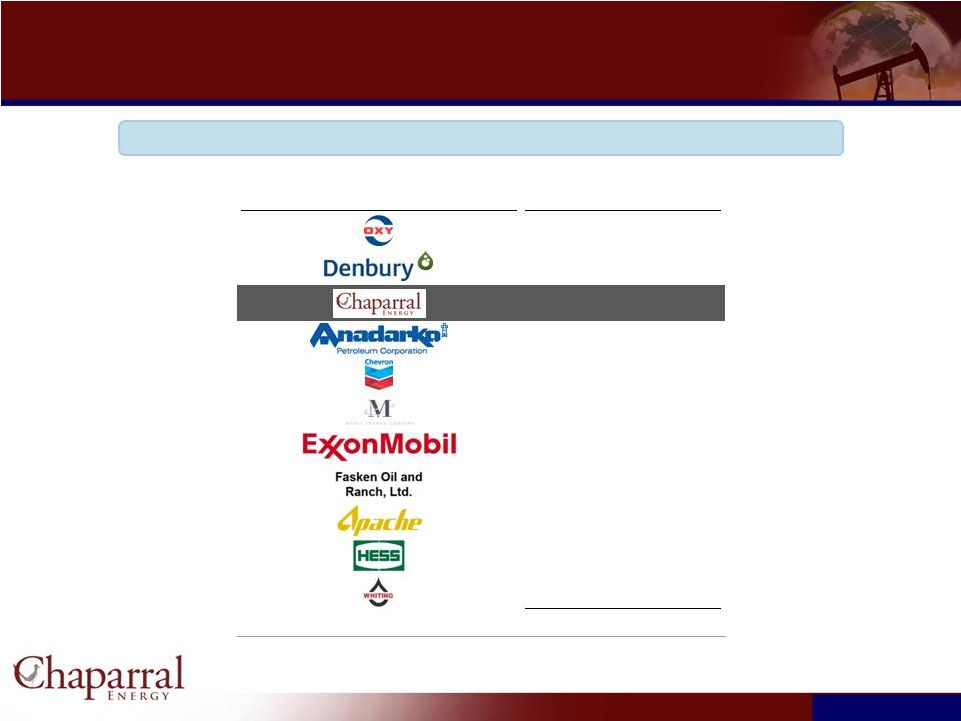 15
15
# of Active
Producer
CO2-EOR Projects
31
22
8
7
7
7
6
5
4
4
4
Total
105
Source: April 2012 Oil & Gas Journal
Note: Chaparral projects include the North Burbank Unit
Chaparral is the third most active CO2-EOR producer in the U.S.
Chaparral is a Leader in the CO2-EOR Industry
Chaparral is a Leader in the CO2-EOR Industry |
 CO
2
EOR Focused Areas
CO
2
EOR Focused Areas
16
16
CO
2
Project Inventory
74 units with 1P, 2P & 3P EOR
reserves
8 units with proved reserves
8 units with CO
2
injection
CO
2
Infrastructure
–
473
Miles
318 miles of active line
68 miles under construction
87 miles of inactive line
CO
2
Supply
47 MMscf/D of existing CO
2
supply
43 MMscf/D new CO
2
supply
Panhandle Area
Permian Basin
Central
Oklahoma
Area
Burbank
Area
CO2 Tertiary Recovery Projects |
 EOR 2012 Capital
Budget (1)
EOR 2012 Capital Budget
(1)
17
17
Budget by Category
($mm)
2011
Actual
2012
Budget
2012
Expanded
Budget
Infrastructure / Pipelines
14
90
106
Drilling
17
13
24
Enhancements / CO
2
Purchases
55
24
37
Total
$86
$127
$168
Panhandle
Area
Permian
Basin
Central
Oklahoma
Area
Burbank
Area
(1)
Does not include Capitalized G&A
2012 Field Projects ($mm)
Panhandle Area
Burbank Area
Central Oklahoma
Permian
Camrick Area
$18
Farnsworth Unit
28
NE Hardesty (Non-op)
7
Booker Area
4
Other
3
$60
North Burbank Unit
$104
NW Velma Hoxbar
$3
No planned expenditures for 2012 |
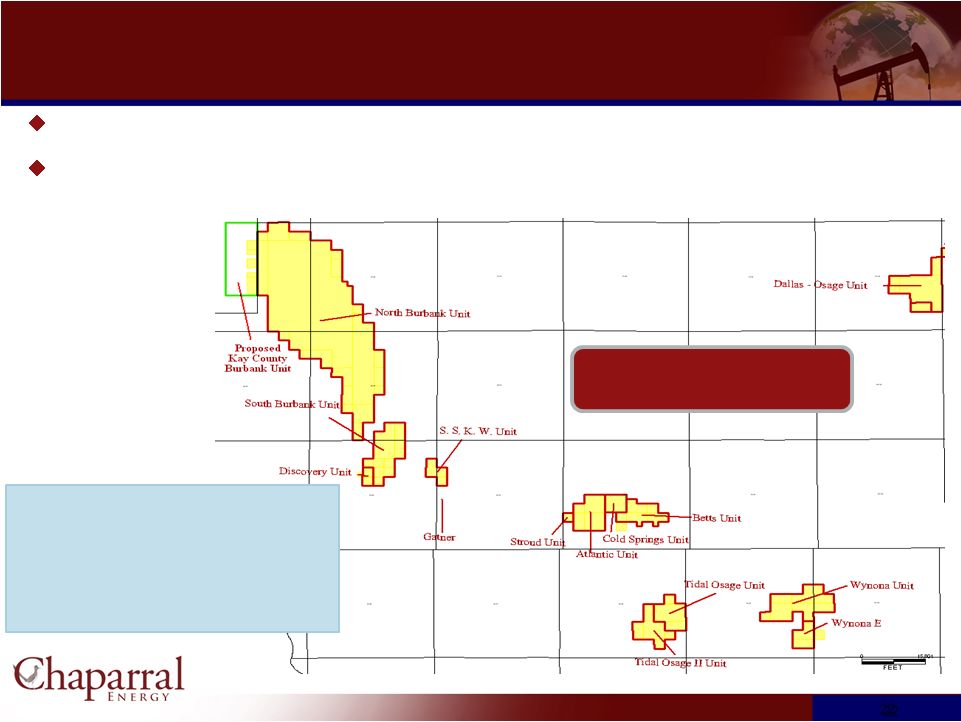 North Burbank Unit
– Overview
North Burbank Unit –
Overview
Chaparral’s
North
Burbank
Unit
is
its
largest
EOR
field
and
plans
to
introduce
CO
2
injection
into
the
North
Burbank Unit in 1Q 2013
Chaparral
anticipates
that
it
will
spend
$800
million
associated
with
this
EOR
project
throughout
the
life
of
the field
18
18
18
18
Total OOIP
1,163 MMBbls
Primary Production
239 MMBbls
Secondary Recovery
211 MMBbls
Tertiary Potential
119 MMBbls
Net Tertiary Potential
100 MMBbls
Burbank Area:
Net Potential: 100 MMBoe, 51% of total |
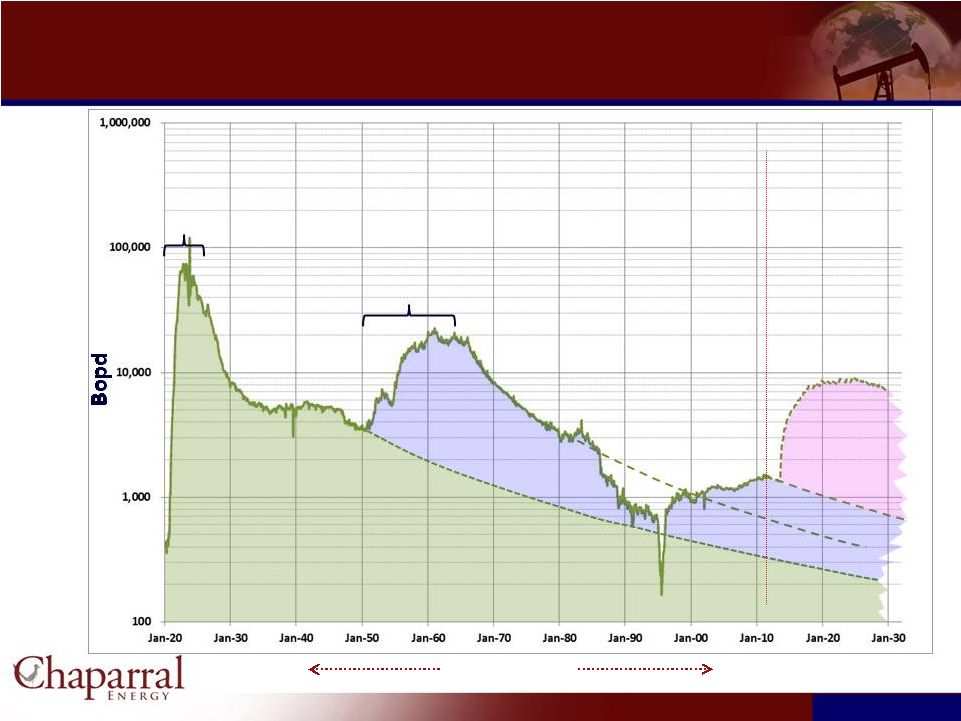 Burbank in
Perspective Burbank in Perspective
19
19
Secondary
Development
Primary
Development
Tertiary
Development
110 Years
“CO2 EOR”
+8000 BOPD
“Waterflood” |
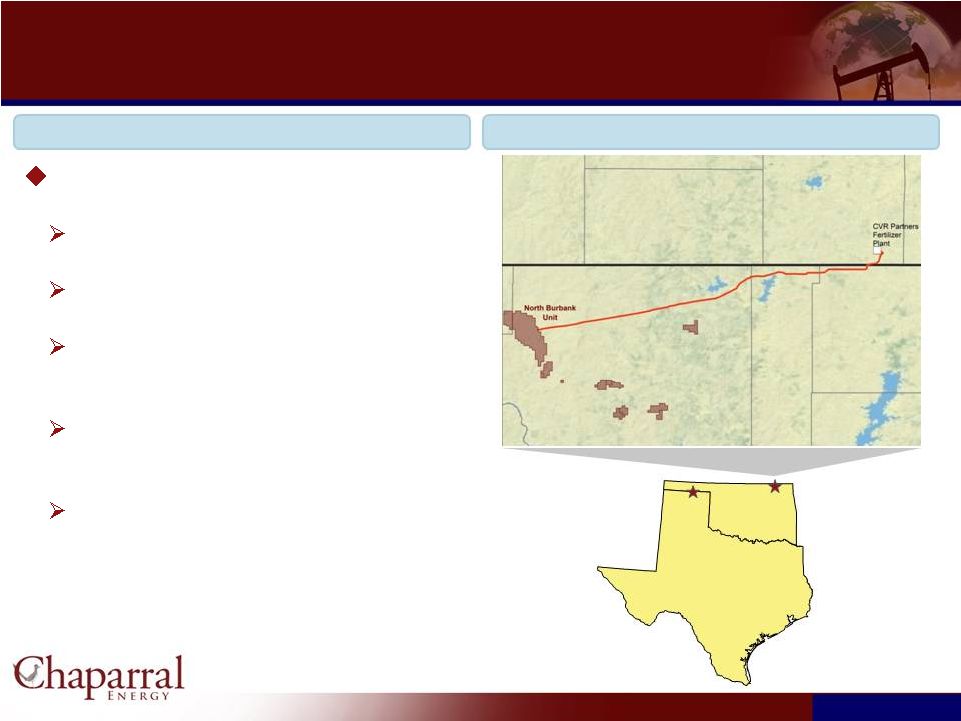 Coffeyville CO
2
System
Coffeyville CO
2
System
20
20
The Coffeyville CO
2
System
$84 million of total capital expenditures
23,500 HP compression facility
68.3-mile 8-inch pipeline with potential
capacity of approximately 60 MMcf/d.
CO
2
is sourced from the CVR Partners
fertilizer plant in Coffeyville, KS.
Online and Operational in early 2013
Oklahoma
Kansas
Panhandle
CO2
System
Coffeyville
CO2
System
Coffeyville CO2 System
Asset Map |
 Monthly Incremental EOR
from Active CO 2
Projects
21
21 |
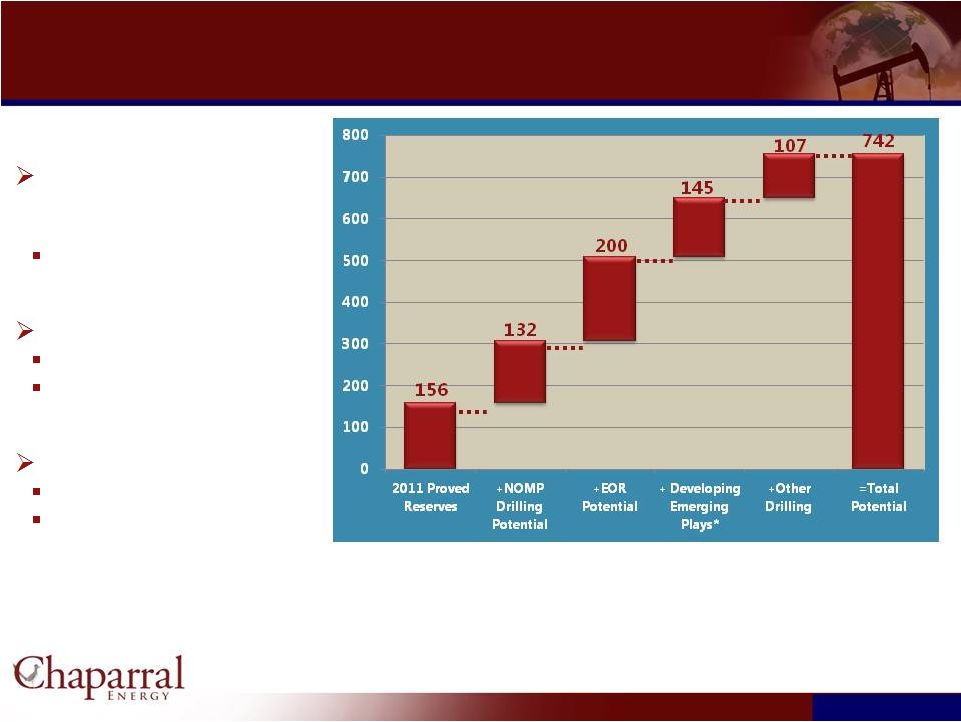 22
22
Potential in Excess of 740 MMBoe
Potential in Excess of 740 MMBoe
Near-term + Long-term
strategy yields significant
value increase
~ 70% Oil
De-risk play, unlock value
Production growth
Low-risk production upside
Long-life, stable production
* Woodford, Bone Spring, Avalon, Cleveland Sand, Granite
Wash, and Marmaton
Near-term focus on NOMP
Long-term focus on EOR |
 Financial Performance,
Projections, and Credit Statistics
Financial Performance, Projections,
and Credit Statistics
23
23 |
 24
24
Financial Summary
Financial Summary
2009
2010
2011
1H 2012
Price
Oil & NGL –
Wellhead ($/Bbl)
$55.04
$74.53
$87.52
$84.12
Gas –
Wellhead ($/Mcf)
$3.51
$4.36
$4.08
$2.21
Production (MMBoe)
7.6
8.1
8.7
4.2
Oil & NGL (MMBbls)
3.9
4.1
5.0
2.6
Gas (Bcf)
22.6
23.7
21.6
9.4
Financial Data ($mm)
Operating Expenses:
Lease Operating Expenses
$94.1
$106.1
$121.4
$63.7
Production and Ad Valorem Taxes
20.3
26.5
34.3
15.5
General and Administrative Expenses
(excludes noncash deferred comp)
22.7
27.3
38.3
23.9
Interest Expense
$90.1
$81.4
$96.7
$48.6
Adjusted EBITDA
$224
$288
$313
$153
Total Capital Expenditures
$154
$344
$336
$275
1
Includes oil & gas capex and capitalized G&A
1 |
 Strong Financial
Performance Strong Financial Performance
Production (MMBoe)
Adjusted EBITDA ($mm)
Total Leverage
Capital Expenditures ($mm)
1
Includes oil & gas capex and capitalized G&A
25
25
2
Total Debt to EBITDA
7.6
8.1
8.7
7.0
7.5
8.0
8.5
9.0
2009
2010
2011
$154
$344
$336
$0
$100
$200
$300
$400
2009
2010
2011
5.3x
3.3x
3.3x
-
1.0
2.0
3.0
4.0
5.0
6.0
2009
2010
2011
$224
$288
$313
$0
$50
$100
$150
$200
$250
$300
$350
2009
2010
2011
1
2 |
 Operating
Statistics 2011 Results
2012
Updated Guidance
Capital
Expenditures
$336 million
$460 million
Production
8.7 MMBoe
8.8 -
9.0 MMBoe
General and Administrative
$4.86/Boe
$5.75 -
$6.25/Boe
Lease Operating Expense
$14.03/Boe
$14.25 -
$14.75/Boe
2011 Results and 2012 Updated Guidance
2011 Results and 2012 Updated Guidance
26
26
1
Includes oil & gas capex and capitalized G&A
1 |
 27
27
Hedge Portfolio
Note:
Dollars
represent
average
strike
price
of
hedges
(includes
all
derivative
instruments)
Gas Basis Hedges
YR
Price
% TP
’12
$
0.23
78%
’13
$
0.20
75%
’14
$
0.23
66%
%
of
Total
Proved
Reserves
Hedged
(as
of
October
31,
2012)
$4.44
$4.31
$3.95
$94.45
$102.45
$ 108.79
$96.28
$73.85
$ 114.26
$99.94
$77.88
$ 107.84
$95.24
$77.50
0%
10%
20%
30%
40%
50%
60%
70%
80%
90%
100%
Nov -
Dec 2012
2013
2014
3 -
Way Oil Collars
Oil Swaps
Gas Swaps |
 Question &
Answer Question & Answer
28
28 |