Attached files
| file | filename |
|---|---|
| 8-K - FORM 8-K - JDA SOFTWARE GROUP INC | d428841d8k.htm |
| EX-99.1 - PRESS RELEASE ISSUED BY THE COMPANY - JDA SOFTWARE GROUP INC | d428841dex991.htm |
 Q3
2012 Earnings Conference Call NASDAQ: JDAS
November 1, 2012
Exhibit 99.2 |
 Copyright 2011 JDA Software Group, Inc. -
CONFIDENTIAL
Forward Looking Statements
Forward-Looking Statements
Except for historical information, this presentation contains forward-looking
statements which include words such as “believe”,
“anticipate” and “expect.”
These forward-looking statements
involve risks and uncertainties that may cause our actual results to differ materially
from those expressed or implied by these statements. Factors that may
affect our results are
summarized in our annual report on Form 10-K filed on August 6, 2012 as well as
our subsequent quarterly reports on Form 10-Q. JDA assumes no obligation
and does not intend to update forward-looking statements made in this
presentation. Non-GAAP Information
A non-GAAP reconciliation of information and definitions of terms such
as “Adjusted
EBITDA”, “Adjusted Non-GAAP EPS”, and other non-GAAP financial
measures contained in this presentation can be found in the appendix of this
presentation. |
 Copyright 2011 JDA Software Group, Inc. -
CONFIDENTIAL
Q3 2012 Highlights
•
Revenue of $164.5 million
–
Software and Subscription revenue of $31.5 million
•
Closed 37 software deals, 6 deals in excess of $1 million
–
Maintenance revenue increased 2% versus prior year with strong retention rates
–
Consulting services revenue of $64.3 million
•
Earnings and margins
–
Adjusted EBITDA of $44.5 million
–
Adjusted EBITDA margin of 27%
–
Adjusted non-GAAP EPS of $0.53
•
Excellent cash flow
–
Cash flow from operations
1
of $40 million
–
Free cash flow
1
of $36 million
–
$412 million cash balance
2
; $138 million net cash
Notes:
1.
Includes the impact of the revenue recognition investigation and restatement costs
of $1.7 million in Q3’12 2.
Equals cash and cash equivalents plus restricted cash
|
 Copyright 2011 JDA Software Group, Inc. -
CONFIDENTIAL
YTD September 30, 2012 Highlights
•
Revenue of $495 million
–
Closed152 software deals (24 in excess of $1 million) versus 172
deals (29 in excess of $1
million) in the year ago period
–
Maintenance retention rates remain strong with a 95.3% retention
rate
–
Consulting services revenue increased 1% versus prior year
•
Earnings and margins
–
Adjusted EBITDA of $128 million
–
Adjusted EBITDA margin of 26%
–
Adjusted non-GAAP EPS of $1.51
•
Excellent cash flow
–
Cash
flow
from
operations
1
of
$118
million
–
Free
cash
flow
1
of
$109
million
–
$412
million
cash
balance
2
;
$138
million
net
cash
1. Includes the impact of the revenue recognition investigation and restatement costs of $5.2 million,
$5.5 million and $1.7 million in Q1’12, Q2’12 and Q3’12, respectively
2. Equals cash and cash equivalents plus restricted cash Notes:
|
 Copyright 2011 JDA Software Group, Inc. -
CONFIDENTIAL
Q3 Results
Notes:
1.
Includes
the
impact
of
the
revenue
recognition
investigation
and
restatement
costs
of
$5.5
million
and
$1.7
million
in
Q2’12
and
Q3’12,
respectively
2.
Equals cash and cash equivalents plus restricted cash
3.
Amounts may not add due to rounding
($'s in millions, except per share data)
Revenues
Q3
2011
Q2
2012
Q3
2012
Y/Y
Growth
Seq
Growth
Software & Subscriptions
38.5
$
35.8
$
31.5
$
-18%
-12%
Maintenance
67.6
66.8
68.8
2%
3%
Total Product Revenue
106.1
102.6
100.2
-6%
-2%
Services
67.0
66.1
64.3
-4%
-3%
Total Revenue
173.1
$
168.8
$
164.5
$
-5%
-3%
Performance
Metrics
Adjusted EBITDA
52.9
$
44.2
$
44.5
$
-16%
1%
% of Revenue
31%
26%
27%
-4%
1%
Adjusted Non-GAAP EPS
0.67
$
0.54
$
0.53
$
-21%
-2%
Operating
Cash
Flow
1
36.9
$
28.9
$
40.4
$
9%
40%
Free
Cash
Flow
1
34.1
$
27.0
$
36.4
$
7%
35%
Cash
Balance
2
326.8
$
366.4
$
411.7
$
26%
12% |
 Copyright 2011 JDA Software Group, Inc. -
CONFIDENTIAL
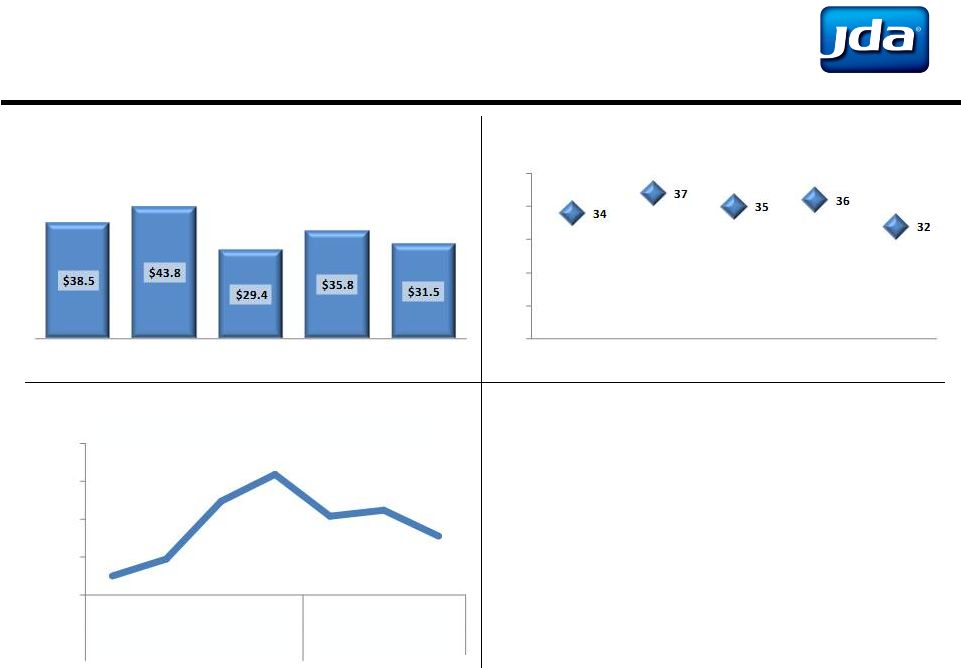
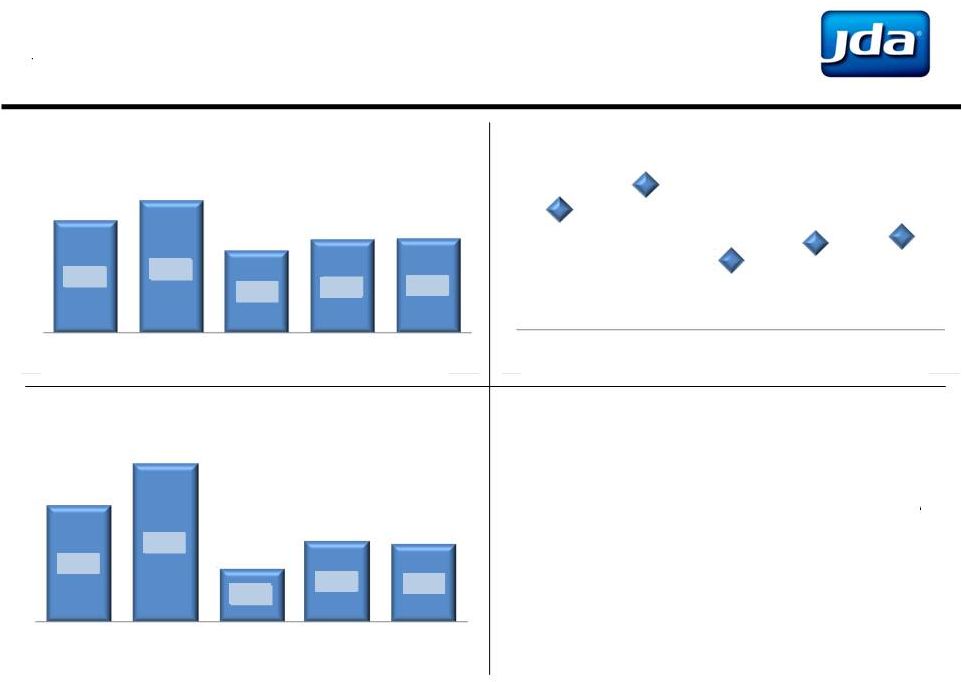
•
Closed 6 large (>$1 million) software deals
in Q3 compared to 10 in Q3 2011
•
Average sales price was $724,000
Software Sales
Notes:
1.Trailing-twelve months
2.Total software revenue includes both license and subscription revenue
3.
Large deals include deals greater than $1 million
Q3'11
Q4'11
Q1'12
Q2'12
Q3'12
2
($ in millions)
15
20
25
30
35
40
Q3'11
Q4'11
Q1'12
Q2'12
Q3'12
Large Deals
3
(TTM
1
)
$125
$135
$145
$155
$165
Q1
Q2
Q3
Q4
Q1
Q2
Q3
2011
2012
TTM
1
Total Software Revenue
($ in millions)
Total Software Revenue
2 |
 Copyright 2011 JDA Software Group, Inc. -
CONFIDENTIAL
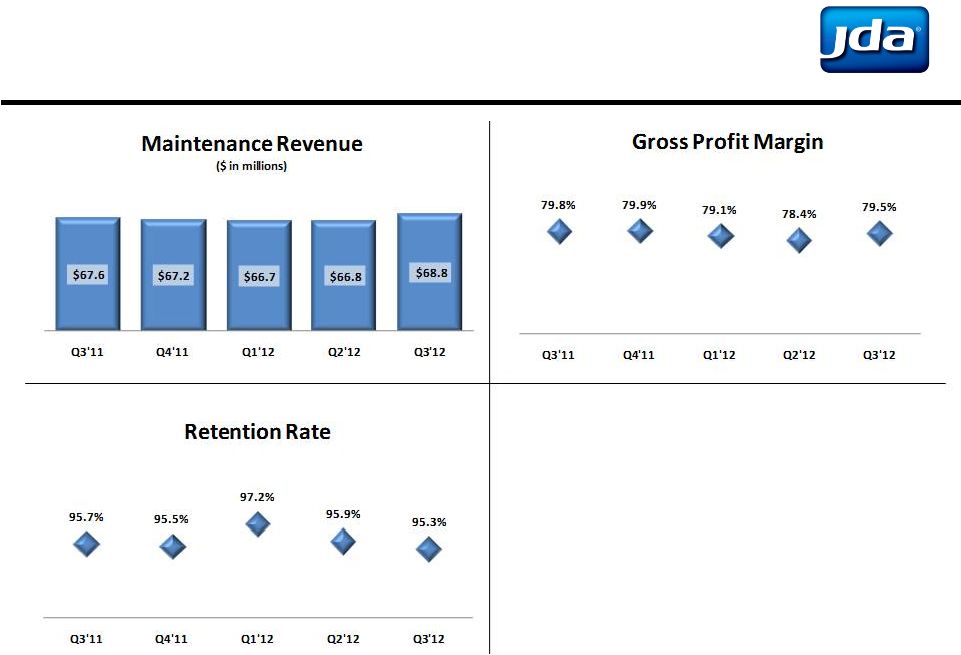
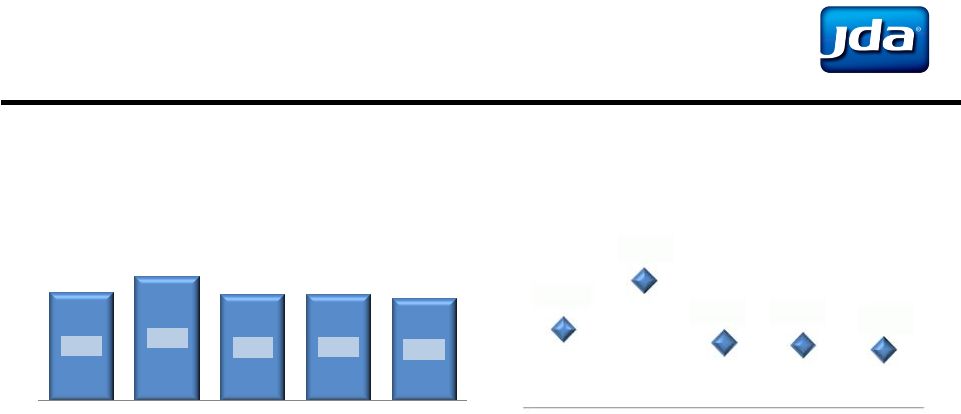
Improving Maintenance Performance
•
Consistent, predictable source of
revenue and cash flow
•
Continued strong maintenance
retention rate
•
Excellent gross profit margins |
 Copyright 2011 JDA Software Group, Inc. -
CONFIDENTIAL
Steady Services Performance
•
Strong margins on substantial revenue
$67.0
$74.1
$66.0
$66.1
$64.3
Q3'11
Q4'11
Q1'12
Q2'12
Q3'12
Services Revenue
($ in millions)
24.6%
33.7%
22.1%
21.6%
20.8%
Q3'11
Q4'11
Q1'12
Q2'12
Q3'12
Gross Profit Margin |
 Copyright 2011 JDA Software Group, Inc. -
CONFIDENTIAL
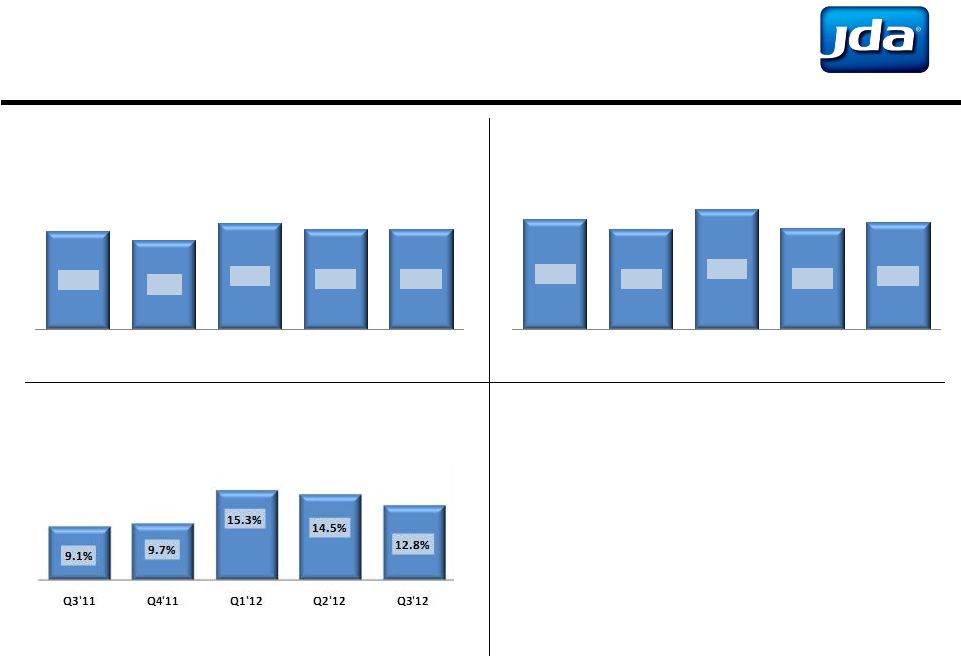
Operational Excellence
•
Proven consistency in operating
cost discipline
•
G&A costs include $5.2 million of
revenue recognition investigation and
restatement costs in Q1 2012, $5.5
million in Q2 2012, and $1.7 million in
Q3 2012
10.8%
9.9%
11.8%
11.1%
11.1%
Q3'11
Q4'11
Q1'12
Q2'12
Q3'12
Product Development
(As % Total Revenue)
14.9%
14.5%
15.3%
14.5%
14.7%
Q3'11
Q4'11
Q1'12
Q2'12
Q3'12
Sales and Marketing
(As % Total Revenue)
General & Administrative
(As % Total Revenue) |
 Strong
EBITDA & EPS Performance •
Sequential EBITDA and EBITDA Margin
growth
$52.9
$62.6
$38.9
$44.2
$44.5
Q3'11
Q4'11
Q1'12
Q2'12
Q3'12
Adjusted EBITDA
($ in millions)
30.6%
33.8%
24.0%
26.2%
27.1%
Q3'11
Q4'11
Q1'12
Q2'12
Q3'12
Adjusted EBITDA Margin
$0.67
$0.82
$0.44
$0.54
$0.53
Adjusted Non-
GAAP Diluted EPS
Copyright 2011 JDA Software Group, Inc. -
CONFIDENTIAL
Q3'11
Q4'11
Q1'12
Q2'12
Q3'12 |
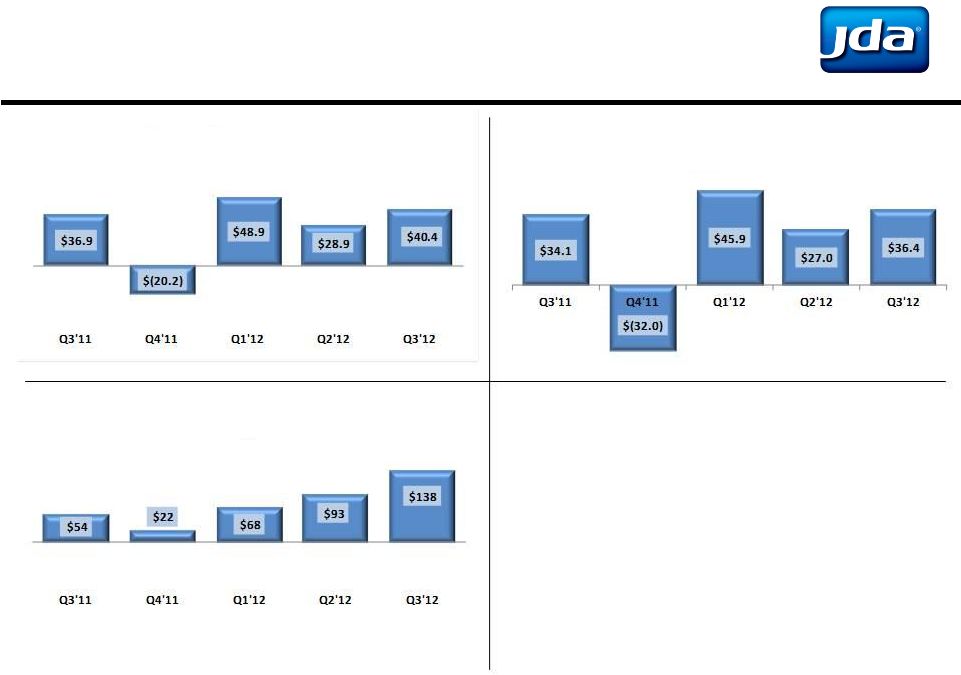 Robust
Cash Flow •
Cash balance of $412 million
•
Strong, expanding cash flow
Copyright 2011 JDA Software Group, Inc. -
CONFIDENTIAL
Operating Cash Flow
1
($ in millions)
Free Cash Flow
1
($ in millions)
Net Cash
2
($ in millions)
Q4’11 includes the net cash payment of $54.0 million for the Dillard’s
litigation settlement; Q1’12 , Q2’12 and Q3’12 include the
impact of the revenue recognition investigation and restatement costs of
$5.2 million, $5.5 million, and $1.7 million respectively
Net cash equals cash and cash equivalents plus restricted cash less total
debt. Net cash includes the impact of the Dillard’s litigation
settlement and revenue recognition investigation and restatement
costs Notes:
1.
2. |
 Copyright 2011 JDA Software Group, Inc. -
CONFIDENTIAL
2012 Q3 Highlights
•
Continued strength in maintenance
•
Operating cost containment
•
Excellent cash flow
•
$412 million of cash on hand
•
Enhanced focus on shareholder value |
 APPENDIX |
 Copyright 2011 JDA Software Group, Inc. -
CONFIDENTIAL
Non-GAAP Reconciliations¹
Actual Results
Notes:
1. Amounts may not add due to rounding
($'s in millions, except per share data)
Q3 2011
Q4 2011
Q1 2012
Q2 2012
Q3 2012
Net Income
18.3
$
3.6
$
4.7
$
10.6
$
11.1
$
Income tax provision (benefit)
11.4
(1.4)
2.8
6.3
7.4
Interest expense & amortization of loan fees
6.4
6.4
6.4
6.5
6.6
Amortization of acquired software technology
1.7
1.7
1.7
1.7
1.7
Amortization of intangibles
9.6
9.5
9.5
9.5
9.5
Depreciation
3.2
3.3
3.7
3.8
3.8
EBITDA
50.7
$
23.2
$
28.8
$
38.5
$
40.1
$
Restructuring charges
0.8
0.6
2.2
0.2
(0.2)
Stock-based compensation
2.1
0.9
2.9
1.7
4.2
Litigation provision and settlements, net
-
39.0
-
-
-
Investigation and restatement costs
-
-
5.2
5.5
1.7
Interest income and other non-operating income, net
(0.6)
(1.2)
(0.3)
(1.6)
(1.3)
Adjusted EBITDA
52.9
$
62.6
$
38.9
$
44.2
$
44.5
$
Income Before Taxes
29.7
$
2.2
$
7.5
$
16.9
$
18.5
$
Amortization of acquired software technology
1.7
1.7
1.7
1.7
1.7
Amortization of intangibles
9.6
9.5
9.5
9.5
9.5
Restructuring charges
0.8
0.6
2.2
0.2
(0.2)
Stock-based compensation
2.1
0.9
2.9
1.7
4.2
Litigation provision and settlements, net
-
39.0
-
-
-
Investigation and restatement costs
-
-
5.2
5.5
1.7
Adjusted Income Before Income Taxes
43.9
$
54.0
$
29.1
$
35.5
$
35.4
$
Adjusted Income Tax Expense
(15.4)
(18.9)
(10.2)
(12.4)
(12.4)
Adjusted Net Income
28.5
$
35.1
$
18.9
$
23.1
$
23.0
$
Adjusted Non-GAAP Diluted EPS
0.67
$
0.82
$
0.44
$
0.54
$
0.53
$ |