Attached files
| file | filename |
|---|---|
| 8-K - FORM 8-K - PTC INC. | form8k.htm |
| EX-99.1 - PRESS RELEASE - PTC INC. | pressrel.htm |
Q4 FISCAL 2012 PREPARED REMARKS
Technology and market leadership, margin growth, commitment to long-term targets
Our long-term financial goal is simple: We intend to deliver non-GAAP operating margin expansion over the next three years, reaching the 25% to 27% range in FY’15. We plan to achieve this goal through a combination of revenue growth from a broad set of software solutions spanning our customers’ entire product “lifecycle” and cost efficiencies within our operating model. The table below illustrates these goals. Our revenue targets are predicated on a superior competitive position in the growth of the markets we serve, which have been under increased pressure recently. Given the slowdown within the global manufacturing industry, which impacted license revenue results throughout FY’12, we believe it is prudent to provide a guidance range that reflects moderated revenue growth for FY’13. We are targeting FY’13 non-GAAP revenues of approximately $1,360 to $1,380 million and non-GAAP EPS of $1.70 to $1.80.

Our solutions are focused on the following five markets: Computer Aided Design (CAD), Product Lifecycle Management (PLM), Application Lifecycle Management (ALM), Services Lifecycle Management (SLM) and Supply Chain Management (SCM). We characterize the markets we participate in with the graphic below. Industry analysts estimate that four of these five markets will grow at a 9-10% CAGR from 2009 to 2014, with the more mature CAD market growing approximately 5% over the same time frame.

Non-GAAP Supplemental Information
We provide non-GAAP supplemental information to our GAAP information. PTC's reasons for providing this information are described at the end of this document. GAAP information corresponding to the non-GAAP information provided is contained in “Q4 FY’12 Expenses Commentary and Q1 & FY’13 Outlook” below and in the attached tables.
Q4 FY’12 - Key Points
|
1)
|
Our Q4 non-GAAP EPS of $0.50 (up 17% year over year on a constant currency basis) was at the high-end of our guidance due primarily to continued focus on cost efficiency as part of our commitment to margin expansion. Our non-GAAP EPS also benefited by $0.02 from lower than expected Other Expense items and tax rate. There was no material impact to Q4 non-GAAP EPS from currency effects relative to guidance. Despite a 5% decline in revenue (flat on a constant currency basis), we grew our non-GAAP operating margin by 180 basis points year over year to 24.5%.
|
|
2)
|
Total revenue for Q4 was $325.3 million, down 5% year over year (flat on a constant currency basis) compared to a very strong performance in Q4’11, and was slightly below the mid-point of our guidance due primarily to lower than expected license revenue.
|
|
3)
|
License revenue of $100.7 million was at the lower end of our Q4 guidance range and was down 9% year over year (down 6% on a constant currency basis). License revenue was solid in the Americas and Pacific Rim, but was impacted by the soft macroeconomic environment in Europe and Japan. Q4 results included one mega deal (license revenue of greater than $5 million).
|
|
4)
|
We delivered maintenance revenue of $155.5 million, above our guidance, up 1% year over year and up 6% on a constant currency basis.
|
|
5)
|
Services revenue of $69.1 million (down 9% year over year, 4% on a constant currency basis) was generally in line with our expectations. Importantly, our initiatives to enhance services margins continued to yield positive results, with non-GAAP services net margins of 12% for the quarter.
|
|
6)
|
We had 35 large deals (>$1M in license and services revenue recognized in the quarter) that contributed $74.4 million in revenue, a decrease of 17% year over year.
|
|
7)
|
We ended the quarter with 358 quota-carrying reps (up 3% YoY). Compared to Q3’11, when we began ramping our sales capacity hiring, we have increased our sales headcount by approximately 30%, with approximately half of the increase coming from organic growth. Given the growth in sales capacity we achieved over the past year and growing concern about the global macroeconomic environment, we are transitioning our focus to improving the productivity of the increased capacity we now have.
|
|
8)
|
We ended Q4’12 with $490 million of cash up from $238 million at the end of Q3’12, reflecting in part $230 million in proceeds drawn from our credit facility to finance the Servigistics acquisition (which was paid when the acquisition closed on October 2, 2012 for approximately $220 million) and $20 million in operating cash flow.
|
|
9)
|
Given our mix of revenue and expenses, historical profitability by region, and revenue outlook for FY’13, we are establishing a valuation allowance against our U.S. net deferred tax assets. This resulted in a non-cash $124 million GAAP charge in Q4. We expect our GAAP tax rate to increase from approximately 20% to 35%, however there will be no change to our cash tax rate.
|
Servigistics Establishes PTC as Clear Market Leader in SLM
On October 2, 2012, PTC completed the acquisition of Servigistics, Inc., developer of an innovative suite of service lifecycle management (SLM) software solutions. We believe the combination of the two companies firmly establishes PTC's market leadership in SLM with the deepest domain expertise, broadest customer base, and largest market share in the industry. With over 27,000 customers worldwide, PTC has long been known for its world-class technology solutions that transform the way companies create products. By adding Servigistics, PTC is now fully able to help global manufacturers transform the way they service those same products. From a technology perspective, PTC's SLM solution portfolio is now unparalleled in the industry, covering: technical information, service knowledge management, service parts management, warranty and contract management, field service management, and service logistics.
We acquired Servigistics for an aggregate purchase price of approximately $220 million in a cash transaction. We financed the transaction by drawing on our existing credit facility in the amount of $230 million.
Q1 AND FY’13 OUTLOOK: Targets reflect commitment to margin expansion
In providing guidance for Q1 and setting targets for FY’13, we are weighing company specific factors such as our pipeline of opportunities and our maintenance and services base as well as external considerations, including the macroeconomic environment, which softened during Q4’12, currency, and visibility into customer spending patterns. Despite our conservative outlook for revenue growth in FY’13 due to the macroeconomic environment, we are maintaining our commitment to operating margin expansion. Our FY’13 guidance assumes Servigistics will contribute approximately half of our total non-GAAP revenue growth.

REVENUE TRENDS
Year over year changes in revenue on a constant currency (FX) basis in the tables that follow compare actual reported results converted into U.S. dollars based on the corresponding prior year’s foreign currency exchange rates to reported results for the comparable prior year period.
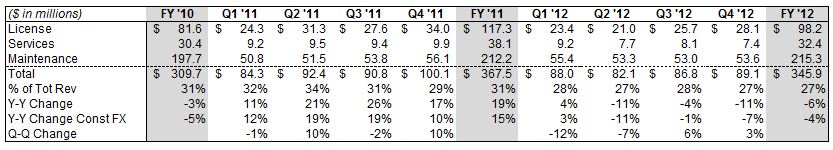
LICENSE: Results driven by outperformance in Americas and the Pacific Rim
License sales generate the highest gross margins, which are in the mid- to high 90% range on a non-GAAP basis. License revenue historically has tended to represent 28% to 33% of our total revenue in any given quarter, with Q4 generally being our strongest quarter.

Q4 License revenue of $100.7 million was down 9% year over year (6% on a constant currency basis), at the lower end of our guidance range of $100 million to $115 million, reflecting strong results in the Americas and the Pacific Rim, with year-over-year growth of 15% and 11%, respectively, offset by weak results in Europe and Japan, with year-over-year declines of 37% (30% on a constant currency basis) and 46% (45% on a constant currency basis), respectively. While both regions were forecasted to be down year-over-year due to strong comparative results in Q4’11, the weakening macroeconomic environment caused fewer transactions to close in the quarter.
PLM license performance, despite being negatively impacted by results in Europe and Japan, grew in-line with longer-term market growth rates on a year-over-year basis. CAD license revenue performance was in line with expectations, though, as expected, experienced a modest year-over-year decline due to very strong results in Q4’11. SCM license revenue was very strong in the quarter driven by several large deals in the retail industry. SLM license revenue declined year over year, as expected, due to strong comparative results in Q4’1.1 ALM license revenue was in line with expectations.
Looking forward to Q1 and FY’13 we are expecting license revenue of $75 to $85 million. For FY’13, we are expecting total license revenue of approximately $380 million, an increase of 9% year over year.
LARGE DEAL ACTIVITY:
Large deal activity is a significant growth driver and has historically tended to generate 20% to 25% of our total revenue in any given quarter, with the exception of Q4, which typically is at the high end of the range. Large deal activity is driven primarily by direct sales teams. We define “large deals” as recognizing more than $1 million of license and service revenue from a customer during a quarter. License revenue typically comprises approximately 50% to 60% of the total large deal revenue each quarter.

In Q4 we had 35 large deals totaling $74.4 million. 21 of these customers were in the Americas, 9 were in Europe and 5 were in Asia. Large deal license revenue was 50% of total large deal revenue in Q4’12, at the low
end of the typical Q4 range due to the weakening economic environment in Europe and Japan. Despite the macroeconomic environment, we continue to have a strong pipeline of large deals that we are working on worldwide, though the timing of closing large deals is being impacted by the economy. We are winning competitive deals with large global companies and are actively engaged in a substantial number of competitive opportunities with other large global companies.
SALES CAPACITY TRENDS:
A key part of our long-term growth strategy over the past year and a half has been to increase the number of quota-carrying sales reps as we penetrate adjacent market opportunities (i.e. ALM, SLM, and SCM) within our existing customer base and target new customers. We ended the quarter with 358 quota-carrying reps, an increase of 3% year over year. Compared to Q3’11, when we began ramping our sales capacity hiring, we have increased our quota-carrying sales reps by approximately 30%, with approximately half of the increase coming from organic expansion. Given the significant growth in sales capacity we achieved over the past year and concerns over the macroeconomic outlook we are transitioning our focus to improving the productivity of the increased capacity we now have. Note that we added Servigistics that are not reflected in the table below.

SERVICES: Performance demonstrates adoption of our solutions
Our services business provides significant value to our customers, helping them re-engineer their global product development business processes and implement our solutions - and providing them with training on our software. Services revenue has historically tended to represent 20% to 25% of our total revenues in any given quarter.

Q4 Services revenue of $69.1 million, as expected, was down 9% year over year (4% on a constant currency basis), given the strong comparative growth in Q4’11 (+39% year over year). As a result, our consulting business, which primarily supports Windchill implementations, was down 12% year over year. Our training business, which typically represents about 15% of our total services revenue, was up 9% year over year. We delivered solid, non-GAAP services net margin of 12% in Q4’12 (up 400 basis points from the Q4’11 non-GAAP services net margin of 8%).
Looking forward to Q1, we are expecting services revenue to be up approximately 1% (3% on a constant currency basis) on a year-over-year basis. For FY’13 we are expecting services revenue to grow 12% to 15% year over year with organic growth of approximately 4% year over year. We have a solid backlog of services engagements that provides near-term visibility into our services business. Due to the lower non-GAAP margins of the Servigistics services business, we expect our non-GAAP services margins to be at least 12% in FY’13, flat with FY’12. However, we remain committed to achieving non-GAAP services margins of
approximately 15% by FY’15 and reducing our mix of direct services through the expansion of our services ecosystem and delivery of solutions that fundamentally require less services.
MAINTENANCE: More than 1.7 million active seats
Our maintenance business is an important barometer of customer satisfaction with our solutions. It is also a strong source of recurring revenue for PTC. Maintenance gross margins are in the mid- to high 80% range. Maintenance revenue has historically tended to represent 45% to 50% of our total revenues in any given quarter, with Q4 usually being at the low end as a percent of total revenue due to historically strong performance of license sales in that quarter.
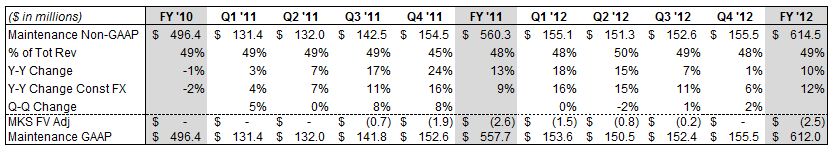
Q4 maintenance revenue of $155.5 million was up 1% year over year (up 6% on a constant currency basis), reflecting strong execution.
Looking forward to Q1, we are expecting maintenance revenue to increase approximately 7% on a year-over-year basis (increase 9% on a constant currency basis). For FY’13 we are expecting approximately 7% maintenance revenue growth on a year-over-year basis.
Active Maintenance Seats
We have more than 1.7 million active maintenance seats of PTC software in use today. We believe the solid base of maintenance-paying customers is a testament to the quality of our products and we also view it as one of our most important assets.

Our overall attach and renewal rates continue to remain strong.
REVENUE BY REGION
Americas:

Americas revenue in Q4 of $140.3 million was up 7% compared with last year due to strong license revenue growth. Q4 license revenue in the Americas was up 15% year over year, driven by very strong results in PLM, ALM and SCM. Sequentially, total revenue was up 24% and license revenue was up 151%. While the
macroeconomic environment remains soft in the Americas, our pipeline continues to build and we are optimistic about the outlook for this region in FY’13.
Europe:

Europe revenue was $111.1 million in Q4, down 16% compared with last year and down 5% on a constant currency basis. Q4 license revenue in Europe was down 37% year over year and down 30% on a constant currency basis. While we were expecting a decline in Europe on a year-over-year basis, given strong comparative results in Q4’11, results were impacted by the weakening manufacturing sector in Europe that impacted the closure of large deals in the quarter. Given the uncertain macroeconomic environment in Europe, we are currently expecting only moderate growth in the region for FY’13.
Japan:

Japan revenue was $31.3 million in Q4, down 13% (down 12% on a constant currency basis) compared with last year. Q4 license revenue in Japan was down 46% (down 45% on a constant currency basis) compared with last year. Sequentially, total revenue was down 9% and license revenue was down 42%. Similar to Europe, we experienced delays in closing large license transactions in Japan during Q4, however based on the significant growth in sales capacity and our strong pipeline in the region, we are expecting growth to improve in FY’13.
Pacific Rim:

Pacific Rim revenue was $42.7 million in Q4, up 3% (6% on a constant currency basis) compared with last year. Q4 license revenue in the Pac Rim was up 11% compared with last year. Sequentially, total revenue was down 2% and license revenue was down 14%. China, which represents a significant portion of our Pac Rim revenue, increased 11% compared to Q4’11. Given the momentum we experienced in the Pac Rim in FY’12 and solid pipeline, we are expecting another solid year of performance in FY’13 for this region.
CURRENCY IMPACT ON RESULTS COMPARED TO THE YEAR AGO PERIOD
Because we have a global business, with Europe and Asia historically representing approximately 65% of our revenue, our results are impacted by currency fluctuations. On a constant currency basis, our revenue was flat year over year. Currency fluctuations unfavorably impacted Q4 revenue by $16.5 million and favorably impacted Q4 GAAP and non-GAAP expenses by $11.6 million and $11.1 million, respectively, compared to Q4’11 currency rates.
Looking forward, the guidance we are providing assumes exchange rates of approximately 1.30 USD / EURO and 80 YEN / USD. Our actual simple average Q1 ’12 Fx rate was $1.37 USD / EURO and our actual simple average FY'12 Fx rate was $1.31 USD / EURO. We do not forecast currency movements; rather we provide detailed constant currency commentary. Currency can significantly impact our results. For example, in FY’12, currency was a headwind for PTC and negatively impacted revenue by $25 million and favorably impacted GAAP and non-GAAP expenses by $19 million and $18 million, respectively. In FY ’11 and FY’10 currency was a tailwind for us when compared to the prior year: revenue was positively impacted by $37 million and $15 million, respectively, and non-GAAP expenses were negatively impacted by $21 million and $10 million, respectively.
As a simple rule of thumb, based on current revenue and expense levels, a $0.10 move on the USD/EURO exchange rate will impact annualized revenue by approximately $35 to $40 million and EPS by approximately $0.08 to $0.10.
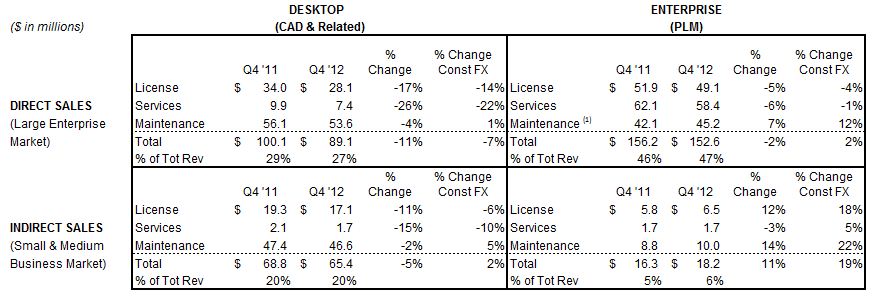
REVENUE BY 4-BOX
We historically characterized our business using the “4-Box” framework below. This quarter will be the last quarter we will provide this view. Given the expansion of our solutions and the markets we serve, as of FY’13 we will no longer use or provide this view.
Certain reclassifications between Direct and Indirect and Desktop and Enterprise revenue from previously reported results (Q1’10 through Q3’12) are reflected below. Indirect revenue is comprised of revenue from our reseller channel and from customers classified as Indirect. To the extent a customer changes between the Direct and Indirect classification, we reclassify their historical revenue to align to the current period classification. The reclassifications of prior quarter and annual Direct and Indirect and Desktop and Enterprise revenue were not more than 2% for any single quarterly or annual reporting period.
The horizontal axis highlights Desktop vs. Enterprise solutions
|
·
|
Desktop solutions include Creo Parametric TM, Mathcad®, a portion of Creo® Elements/Direct® and a portion of Arbortext® revenue
|
|
·
|
Enterprise solutions include Windchill®,Creo View TM, a portion of Arbortext revenue, and PTC Integrity TM
|
The vertical axis highlights Direct vs. Indirect go-to market strategies
|
·
|
Direct sales focuses primarily on the large enterprise market
|
|
·
|
Indirect sales (primarily our VAR reseller channel) focuses primarily on the SMB market
|
UPPER LEFT BOX (DIRECT SPACE / DESKTOP PRODUCTS)
UPPER RIGHT BOX (DIRECT SPACE / ENTERPRISE PRODUCTS)

LOWER LEFT BOX (INDIRECT SPACE / DESKTOP PRODUCTS)

LOWER RIGHT BOX (INDIRECT SPACE / ENTERPRISE PRODUCTS)

Q4 FY’12 EXPENSES COMMENTARY AND Q1 & FY’13 OUTLOOK
Q4 non-GAAP results exclude $11.9 million of stock-based compensation expense, $8.7 million of acquisition- related intangible asset amortization, $1.3 million of acquisition-related costs and $122.3 million of income tax adjustments. The Q4 non-GAAP results include a tax rate of 23% and 121.3 million diluted shares outstanding. The Q4 GAAP results include a tax rate of 250% and 119.0 million diluted shares outstanding.
Q1’13 non-GAAP guidance excludes the following estimated expenses and their tax effects:
|
·
|
Approximately $12 million of expense related to stock-based compensation
|
|
·
|
Approximately $16 million of restructuring charges
|
|
·
|
Approximately $2 million of a fair value deferred maintenance revenue adjustment
|
|
·
|
Approximately $11 million of acquisition-related intangible asset amortization expense
|
|
·
|
Approximately $5 million of acquisition-related expenses
|
FY’13 non-GAAP guidance excludes the following full-year estimated expenses and their tax effects, as well as any one-time tax items:
|
·
|
Approximately $16 million of restructuring charges
|
|
·
|
Approximately $4 million of a fair value deferred maintenance revenue adjustment
|
|
·
|
Approximately $50 million of expense related to stock-based compensation
|
|
·
|
Approximately $50 million of acquisition-related intangible asset amortization expense
|
|
·
|
Approximately $7 million of acquisition-related expenses
|
NON-GAAP OPERATING MARGINS

INCOME STATEMENT
Our Q4’12 non-GAAP gross margin was $243 million, or 74.9%, compared to $250 million, or 73.2% in the year ago period due primarily to higher services margins. Q4’12 GAAP gross margin was $237 million, or 73.0%, compared to $241 million, or 71.0% in Q4’11.
Our Q4’12 non-GAAP operating expenses were $164 million ($180 million on a GAAP basis), down from $172 million in Q4’11 ($190 million on a GAAP basis), reflecting our focus on driving margin expansion.
From an operating performance perspective, we achieved 24.5% non-GAAP operating margin (24.9% on a constant currency basis) in Q4’12, compared to 22.7% last year. GAAP operating margin was 17.7% (18.3% on a constant currency basis) for Q4’12 compared to 15.1% in Q4’11.
Looking forward, we are expecting Q1‘13 non-GAAP gross margins of 70% and non-GAAP operating margin of 16% to 18%. For FY'13 we are expecting non-GAAP gross margins of approximately 71%, which is a decrease of approximately 100 basis points year over year, with non-GAAP services margins of at least 12%. The decrease in non-GAAP gross margin in FY'13 reflects Servigistics' higher mix of services revenue and lower services margins. We expect non-GAAP operating margins of approximately 21.5%, and GAAP operating margin of approximately 12%.
Over the longer-term we intend to increase our non-GAAP operating margin to the 25% to 27% range primarily through increased efficiency in our global sales organization, improved non-GAAP gross margin (74% to 76% range) due to improved non-GAAP services margin and more favorable services revenue mix.
We made significant investments in FY’09 and FY’10 that have helped us achieve a technology leadership position and have driven substantial revenue growth. In FY’12 we invested in sales capacity to capitalize on our technology leadership position, drive long term revenue growth and create further operating leverage opportunities over time. Looking forward, we expect to continue to increase investments in the business, while simultaneously driving efficiency gains netting to approximately 200 basis points per year of non-GAAP operating margin improvement through FY'15.
TAX RATE
Q4 non-GAAP tax rate was 23%, compared to our expected rate of 25%. Our GAAP tax was a provision of $140 million in Q4 compared to our expected rate of 20% due primarily to a $124 million non-cash charge to the income tax provision to establish a valuation allowance against U.S. net deferred tax assets.
Looking forward, the Q1 guidance assumes a non-GAAP tax rate of 23% and a GAAP tax benefit of approximately $42 million in part reflecting a one-time non-cash tax benefit associated with purchase accounting for the Servigistics acquisition. The FY’13 target assumes a non-GAAP tax rate of 23% and a GAAP tax rate of 5%.
STOCK-BASED COMPENSATION
Expenses related to stock-based compensation were 3.7% of revenue in Q4 ’12, compared to 3.8% of non-GAAP revenue in Q4’11. Over time, we expect that stock-based compensation as a percentage of non-GAAP revenue will trend down annually, ultimately reaching a sustainable long-term target of 3%.
SHARE COUNT / SHARE REPURCHASE
We had 121.3 million fully diluted weighted average shares outstanding for Q4 (119.0 million on a GAAP basis). Our Board has authorized us to repurchase up to $100 million worth of our shares in the period October 1, 2012 through September 30, 2013. We did not repurchase any shares in Q4.
Looking forward, we expect to have approximately 122.0 million fully diluted shares outstanding for Q1 ’13 and for the full fiscal year. We intend to repurchase $20 million worth of shares in Q1’13. Our long-term goal is to repurchase stock to offset dilution.
BALANCE SHEET: Solid cash position
CASH / CASH FLOW FROM OPERATIONS
For Q4’12, our cash balance was $490 million, up from $238 million at the end of Q3’12, primarily due to $230 million borrowed under our credit facility in contemplation of acquiring Servigistics in Q1’13; approximately $220 million of this was paid when we closed the acquisition on October 2, 2012. We generated $20 million from operations in Q4. Uses of cash in the quarter included capital expenditures of $9 million.
DSO
We continue to have strong DSOs of 61 days in Q4’12 compared to 59 days in Q3’12 and 62 days in Q4’11.
OUTSTANDING DEBT
At the end of Q4’12, the balance outstanding under our $450 million credit facility was $370 million. As planned, we borrowed $230 million in Q4 to finance our acquisition of Servigistics. We paid approximately $220 million when we closed the acquisition on October 2, 2012.
MISCELLANEOUS COMMENTS
HEADCOUNT
Total headcount was 5,897 at the end of Q4 compared to 5,907 at the end of Q3. Headcount at the end of Q4’11 was 6,122.
M&A
We view M&A primarily as a strategic vehicle to further enhance our product portfolio and growth opportunity. We intend to remain opportunistic as it relates to M&A. The majority of our M&A opportunities have comprised small, strategic technology tuck-ins, although we consider and have completed larger transactions, including MKS in Q3’11 and Servigistics, Inc. in Q1’13. We continue to evaluate strategic acquisition opportunities of varying size as they arise. Our forecasted financial, cash and debt positions set forth herein are exclusive of the effects of any M&A that we may complete.
Other Information
As previously disclosed, we have undertaken an investigation of payments by certain business partners and expenses by certain employees in China that raise questions of compliance with laws, including the Foreign Corrupt Practices Act, and/or compliance with our business policies. The termination of certain employees and business partners in China in connection with this matter may have an adverse impact on our level of sales in China until replacements for those employees and business partners are in place and productive. Revenue
from China has historically represented 6% - 7% of our total revenue. We have voluntarily disclosed the results of that investigation and associated remedial actions to the United States Department of Justice and the Securities and Exchange Commission and are cooperating to provide additional information as requested. We are unable to predict the outcome of this matter or to estimate fines or other sanctions which may be assessed.
Important Information About Non-GAAP References
PTC provides non-GAAP supplemental information to its financial results. Non-GAAP revenue, operating expenses, margin and EPS exclude a fair value adjustment related to acquired deferred maintenance revenue from MKS and Servigistics, stock-based compensation expense, gain on litigation resolution, foreign currency transaction losses related to our acquisition of MKS and a litigation resolution, amortization of acquired intangible assets, acquisition-related expenses, restructuring charges, and the related tax effects of the preceding items and any one-time tax items. Constant currency measures are calculated by multiplying results by the exchange rates in effect for the comparable periods in the prior year and assumes no change in tax rates. We use these non-GAAP measures, and we believe that they assist our investors, to make period-to-period comparisons of our operational performance because they provide a view of our operating results without items that are not, in our view, indicative of our core operating results. We believe that these non-GAAP measures help illustrate underlying trends in our business, and we use the measures to establish budgets and operational goals, communicated internally and externally, for managing our business and evaluating our performance. We believe that providing non-GAAP measures affords investors a view of our operating results that may be more easily compared to the results of peer companies. In addition, compensation of our executives is based in part on the performance of our business based on these non-GAAP measures. However, non-GAAP information should not be construed as an alternative to GAAP information as the items excluded from the non-GAAP measures often have a material impact on PTC’s financial results. Management uses, and investors should consider, non-GAAP measures in conjunction with our GAAP results.
Forward-Looking Statements
Statements in these prepared remarks that are not historic facts, including statements about our fourth quarter, fiscal 2012, fiscal 2013 and other future financial and growth expectations, anticipated tax rates, the expected impact of our planned strategic investments on our future success, expected market growth rates and the long-term prospects for PTC, are forward-looking statements that involve risks and uncertainties that could cause actual results to differ materially from those projected. These risks include the possibility that customers may not purchase our solutions when or at the rates we expect, the possibility that our pipeline of opportunities may not generate the revenue we expect, the possibility that we will be unable to achieve planned services margins and operating margin improvements, the possibility foreign currency exchange rates may vary from our expectations and thereby affect our reported revenue and expense, the possibility that we may not achieve the license, services or maintenance growth rates that we expect, which could result in a different mix of revenue between license, service and maintenance and could impact our EPS results, the possibility the increases in sales capacity may not generate the additional sales pipeline and revenue that we expect, the possibility that our strategic investments and restructuring may not have the effects or generate the revenue growth or operating margin improvements we expect, the possibility that we may be unable to attain or maintain a technology leadership position or that any such leadership position may not generate the revenue we expect, and the possibility that we may be unable to achieve our profitability targets with lower license revenue. In addition, our assumptions concerning our future GAAP and non-GAAP effective income tax rates are based on estimates and other factors that could change, including the geographic mix of our revenue, expenses and profits and loans and cash repatriations from foreign subsidiaries. Other risks and uncertainties that could cause actual results to differ materially from those projected are detailed from time to time in reports we file with the Securities and Exchange Commission, including our Annual Report on Form 10-K and our Quarterly Reports on Form 10-Q.
PARAMETRIC TECHNOLOGY CORPORATION
NON-GAAP FINANCIAL MEASURES AND RECONCILIATIONS (UNAUDITED)
(in thousands)
| GAAP MARGINS | ||||||||||||||||||||||||||||||||||||||||||
|
FY '10
|
Q1 '11
|
Q2 '11
|
Q3 '11
|
Q4 '11
|
FY '11
|
|||||||||||||||||||||||||||||||||||||
|
Revenue
|
$ | 1,010,049 | $ | 266,552 | $ | 269,189 | $ | 291,783 | $ | 339,425 | $ | 1,166,949 | ||||||||||||||||||||||||||||||
|
Cost of license revenue
|
31,047 | 5,954 | 6,558 | 7,617 | 8,663 | 28,792 | ||||||||||||||||||||||||||||||||||||
|
Cost of service revenue
|
276,648 | 80,107 | 75,213 | 82,792 | 89,864 | 327,976 | ||||||||||||||||||||||||||||||||||||
|
Gross Margin
|
$ | 702,354 | 69.5 | % | $ | 180,491 | 67.7 | % | $ | 187,418 | 69.6 | % | $ | 201,374 | 69.0 | % | $ | 240,898 | 71.0 | % | $ | 810,181 | 69.4 | % | ||||||||||||||||||
|
Sales & marketing
|
$ | 317,532 | 31.4 | % | $ | 84,521 | 31.7 | % | $ | 81,163 | 30.2 | % | $ | 89,106 | 30.5 | % | $ | 98,261 | 28.9 | % | $ | 353,051 | 30.3 | % | ||||||||||||||||||
|
Research & development
|
201,567 | 20.0 | % | 51,522 | 19.3 | % | 53,051 | 19.7 | % | 51,103 | 17.5 | % | 55,730 | 16.4 | % | 211,406 | 18.1 | % | ||||||||||||||||||||||||
|
General & administrative
|
92,875 | 9.2 | % | 23,484 | 8.8 | % | 24,712 | 9.2 | % | 31,882 | 10.9 | % | 30,213 | 8.9 | % | 110,291 | 9.5 | % | ||||||||||||||||||||||||
|
Amortization of acquired intangible assets
|
15,605 | 1.5 | % | 3,854 | 1.4 | % | 4,266 | 1.6 | % | 4,753 | 1.6 | % | 5,446 | 1.6 | % | 18,319 | 1.6 | % | ||||||||||||||||||||||||
|
Restructuring charge
|
- | - | - | - | - | - | ||||||||||||||||||||||||||||||||||||
|
Operating Expenses
|
$ | 627,579 | 62.1 | % | $ | 163,381 | 61.3 | % | $ | 163,192 | 60.6 | % | $ | 176,844 | 60.6 | % | $ | 189,650 | 55.9 | % | $ | 693,067 | 59.4 | % | ||||||||||||||||||
|
GAAP Operating Margin
|
$ | 74,775 | 7.4 | % | $ | 17,110 | 6.4 | % | $ | 24,226 | 9.0 | % | $ | 24,530 | 8.4 | % | $ | 51,248 | 15.1 | % | $ | 117,114 | 10.0 | % | ||||||||||||||||||
|
ADJUSTMENTS TO DERIVE NON-GAAP MEASURES
|
||||||||||||||||||||||||||||||||||||||||||
|
FY '10
|
Q1 '11
|
Q2 '11
|
Q3 '11
|
Q4 '11
|
FY '11
|
|||||||||||||||||||||||||||||||||||||
|
Revenue:
|
||||||||||||||||||||||||||||||||||||||||||
|
Fair value of deferred revenue
|
$ | - | 0.0 | % | $ | - | 0.0 | % | $ | - | 0.0 | % | $ | 693 | 0.2 | % | $ | 1,913 | 0.6 | % | $ | 2,606 | 0.2 | % | ||||||||||||||||||
|
Cost of license revenue:
|
||||||||||||||||||||||||||||||||||||||||||
|
Acquired intangible amortization
|
18,367 | 1.8 | % | 3,363 | 1.3 | % | 3,339 | 1.2 | % | 3,895 | 1.3 | % | 4,796 | 1.4 | % | 15,393 | 1.3 | % | ||||||||||||||||||||||||
|
Stock-based compensation
|
24 | 0.0 | % | 3 | 0.0 | % | 3 | 0.0 | % | 4 | 0.0 | % | 5 | 0.0 | % | 15 | 0.0 | % | ||||||||||||||||||||||||
|
Cost of service revenue:
|
||||||||||||||||||||||||||||||||||||||||||
|
Stock-based compensation
|
9,122 | 0.9 | % | 2,137 | 0.8 | % | 1,583 | 0.6 | % | 1,857 | 0.6 | % | 2,155 | 0.6 | % | 7,732 | 0.7 | % | ||||||||||||||||||||||||
|
Sales & marketing:
|
||||||||||||||||||||||||||||||||||||||||||
|
Stock-based compensation
|
13,432 | 1.3 | % | 2,429 | 0.9 | % | 2,350 | 0.9 | % | 3,062 | 1.0 | % | 3,587 | 1.1 | % | 11,428 | 1.0 | % | ||||||||||||||||||||||||
|
Research & development:
|
||||||||||||||||||||||||||||||||||||||||||
|
Stock-based compensation
|
9,480 | 0.9 | % | 2,393 | 0.9 | % | 1,749 | 0.6 | % | 2,010 | 0.7 | % | 2,395 | 0.7 | % | 8,547 | 0.7 | % | ||||||||||||||||||||||||
|
General & administrative:
|
||||||||||||||||||||||||||||||||||||||||||
|
Stock-based compensation
|
16,853 | 1.7 | % | 4,065 | 1.5 | % | 4,186 | 1.6 | % | 4,627 | 1.6 | % | 4,802 | 1.4 | % | 17,680 | 1.5 | % | ||||||||||||||||||||||||
|
Acquisition-related costs
|
- | 0.0 | % | - | 0.0 | % | 608 | 0.2 | % | 6,041 | 2.1 | % | 1,112 | 0.3 | % | 7,761 | 0.7 | % | ||||||||||||||||||||||||
|
Amortization of acquired intangible assets
|
15,605 | 1.5 | % | 3,854 | 1.4 | % | 4,266 | 1.6 | % | 4,753 | 1.6 | % | 5,446 | 1.6 | % | 18,319 | 1.6 | % | ||||||||||||||||||||||||
|
Restructuring charge
|
- | - | - | - | - | - | ||||||||||||||||||||||||||||||||||||
|
Non-GAAP adjustments
|
$ | 82,883 | 8.2 | % | $ | 18,244 | 6.8 | % | $ | 18,084 | 6.7 | % | $ | 26,942 | 9.2 | % | $ | 26,211 | 7.7 | % | $ | 89,481 | 7.7 | % | ||||||||||||||||||
|
NON-GAAP MARGINS
|
||||||||||||||||||||||||||||||||||||||||||
|
FY '10
|
Q1 '11
|
Q2 '11
|
Q3 '11
|
Q4 '11
|
FY '11
|
|||||||||||||||||||||||||||||||||||||
|
Revenue
|
$ | 1,010,049 | $ | 266,552 | $ | 269,189 | $ | 292,476 | $ | 341,338 | $ | 1,169,555 | ||||||||||||||||||||||||||||||
|
Cost of license revenue
|
12,656 | 2,588 | 3,216 | 3,718 | 3,862 | 13,384 | ||||||||||||||||||||||||||||||||||||
|
Cost of service revenue
|
267,526 | 77,970 | 73,630 | 80,935 | 87,709 | 320,244 | ||||||||||||||||||||||||||||||||||||
|
Gross Margin
|
$ | 729,867 | 72.3 | % | $ | 185,994 | 69.8 | % | $ | 192,343 | 71.5 | % | $ | 207,823 | 71.1 | % | $ | 249,767 | 73.2 | % | $ | 835,927 | 71.5 | % | ||||||||||||||||||
|
Sales & marketing
|
$ | 304,100 | 30.1 | % | $ | 82,092 | 30.8 | % | $ | 78,813 | 29.3 | % | $ | 86,044 | 29.4 | % | $ | 94,674 | 27.7 | % | $ | 341,623 | 29.2 | % | ||||||||||||||||||
|
Research & development
|
192,087 | 19.0 | % | 49,129 | 18.4 | % | 51,302 | 19.1 | % | 49,093 | 16.8 | % | 53,335 | 15.6 | % | 202,859 | 17.3 | % | ||||||||||||||||||||||||
|
General & administrative
|
76,022 | 7.5 | % | 19,419 | 7.3 | % | 19,918 | 7.4 | % | 21,214 | 7.3 | % | 24,299 | 7.1 | % | 84,850 | 7.3 | % | ||||||||||||||||||||||||
|
Amortization of acquired intangible assets
|
- | 0.0 | % | - | 0.0 | % | - | 0.0 | % | - | 0.0 | % | - | 0.0 | % | - | 0.0 | % | ||||||||||||||||||||||||
|
Restructuring charge
|
- | 0.0 | % | - | 0.0 | % | - | 0.0 | % | - | 0.0 | % | - | 0.0 | % | - | 0.0 | % | ||||||||||||||||||||||||
|
Operating Expenses
|
$ | 572,209 | 56.7 | % | $ | 150,640 | 56.5 | % | $ | 150,033 | 55.7 | % | $ | 156,351 | 53.5 | % | $ | 172,308 | 50.5 | % | $ | 629,332 | 53.8 | % | ||||||||||||||||||
|
Non-GAAP Operating Margin
|
$ | 157,658 | 15.6 | % | $ | 35,354 | 13.3 | % | $ | 42,310 | 15.7 | % | $ | 51,472 | 17.6 | % | $ | 77,459 | 22.7 | % | $ | 206,595 | 17.7 | % | ||||||||||||||||||
PARAMETRIC TECHNOLOGY CORPORATION
NON-GAAP FINANCIAL MEASURES AND RECONCILIATIONS (UNAUDITED)
(in thousands) cont'd.
| GAAP MARGINS | |||||||||||||||||||||||||||||||||||
|
Q1 '12
|
Q2 '12
|
Q3 '12
|
Q4 '12
|
FY '12
|
|||||||||||||||||||||||||||||||
|
Revenue
|
$ | 318,276 | $ | 301,125 | $ | 310,983 | $ | 325,295 | $ | 1,255,679 | |||||||||||||||||||||||||
|
Cost of license revenue
|
7,659 | 7,824 | 7,634 | 7,478 | 30,595 | ||||||||||||||||||||||||||||||
|
Cost of service revenue
|
90,560 | 85,392 | 85,220 | 80,361 | 341,533 | ||||||||||||||||||||||||||||||
|
Gross Margin
|
$ | 220,057 | 69.1 | % | $ | 207,909 | 69.0 | % | $ | 218,129 | 70.1 | % | $ | 237,456 | 73.0 | % | $ | 883,551 | 70.4 | % | |||||||||||||||
|
Sales & marketing
|
$ | 97,778 | 30.7 | % | $ | 90,962 | 30.2 | % | $ | 94,706 | 30.5 | % | $ | 94,350 | 29.0 | % | $ | 377,796 | 30.1 | % | |||||||||||||||
|
Research & development
|
54,993 | 17.3 | % | 54,576 | 18.1 | % | 53,260 | 17.1 | % | 52,131 | 16.0 | % | 214,960 | 17.1 | % | ||||||||||||||||||||
|
General & administrative
|
29,572 | 9.3 | % | 29,534 | 9.8 | % | 29,851 | 9.6 | % | 28,511 | 8.8 | % | 117,468 | 9.4 | % | ||||||||||||||||||||
|
Amortization of acquired intangible assets
|
5,209 | 1.6 | % | 5,132 | 1.7 | % | 5,103 | 1.6 | % | 4,859 | 1.5 | % | 20,303 | 1.6 | % | ||||||||||||||||||||
|
Restructuring charge
|
- | 0.0 | % | 20,802 | 6.9 | % | 4,126 | 1.3 | % | - | 0.0 | % | 24,928 | 2.0 | % | ||||||||||||||||||||
|
Operating Expenses
|
$ | 187,552 | 58.9 | % | $ | 201,006 | 66.8 | % | $ | 187,046 | 60.1 | % | $ | 179,851 | 55.3 | % | $ | 755,455 | 60.2 | % | |||||||||||||||
|
GAAP Operating Margin
|
$ | 32,505 | 10.2 | % | $ | 6,903 | 2.3 | % | $ | 31,083 | 10.0 | % | $ | 57,605 | 17.7 | % | $ | 128,096 | 10.2 | % | |||||||||||||||
|
ADJUSTMENTS TO DERIVE NON-GAAP MEASURES
|
|||||||||||||||||||||||||||||||||||
|
Q1 '12
|
Q2 '12
|
Q3 '12
|
Q4 '12
|
FY '12
|
|||||||||||||||||||||||||||||||
|
Revenue:
|
|||||||||||||||||||||||||||||||||||
|
Fair value of deferred revenue
|
$ | 1,522 | 0.5 | % | $ | 736 | 0.2 | % | $ | 227 | 0.1 | % | $ | - | 0.0 | % | $ | 2,485 | 0.2 | % | |||||||||||||||
|
Cost of license revenue:
|
|||||||||||||||||||||||||||||||||||
|
Acquired intangible amortization
|
4,103 | 1.3 | % | 3,931 | 1.3 | % | 3,933 | 1.3 | % | 3,852 | 1.2 | % | 15,819 | 1.3 | % | ||||||||||||||||||||
|
Stock-based compensation
|
5 | 0.0 | % | 7 | 0.0 | % | 4 | 0.0 | % | 6 | 0.0 | % | 22 | 0.0 | % | ||||||||||||||||||||
|
Cost of service revenue:
|
|||||||||||||||||||||||||||||||||||
|
Stock-based compensation
|
2,513 | 0.8 | % | 2,171 | 0.7 | % | 2,050 | 0.7 | % | 2,182 | 0.7 | % | 8,916 | 0.7 | % | ||||||||||||||||||||
|
Sales & marketing:
|
|||||||||||||||||||||||||||||||||||
|
Stock-based compensation
|
3,728 | 1.2 | % | 3,306 | 1.1 | % | 3,334 | 1.1 | % | 3,441 | 1.1 | % | 13,809 | 1.1 | % | ||||||||||||||||||||
|
Research & development:
|
|||||||||||||||||||||||||||||||||||
|
Stock-based compensation
|
2,549 | 0.8 | % | 2,240 | 0.7 | % | 1,886 | 0.6 | % | 2,086 | 0.6 | % | 8,761 | 0.7 | % | ||||||||||||||||||||
|
General & administrative:
|
|||||||||||||||||||||||||||||||||||
|
Stock-based compensation
|
4,587 | 1.4 | % | 4,968 | 1.6 | % | 6,057 | 1.9 | % | 4,185 | 1.3 | % | 19,797 | 1.6 | % | ||||||||||||||||||||
|
Acquisition-related costs
|
2,068 | 0.6 | % | 444 | 0.1 | % | - | 0.0 | % | 1,321 | 0.4 | % | 3,833 | 0.3 | % | ||||||||||||||||||||
|
Amortization of acquired intangible assets
|
5,209 | 1.6 | % | 5,132 | 1.7 | % | 5,103 | 1.6 | % | 4,859 | 1.5 | % | 20,303 | 1.6 | % | ||||||||||||||||||||
|
Restructuring charge
|
- | 0.0 | % | 20,802 | 6.9 | % | 4,126 | 1.3 | % | - | 0.0 | % | 24,928 | 2.0 | % | ||||||||||||||||||||
|
Non-GAAP adjustments
|
$ | 26,284 | 8.3 | % | $ | 43,737 | 14.5 | % | $ | 26,720 | 8.6 | % | $ | 21,932 | 6.7 | % | $ | 118,673 | 9.5 | % | |||||||||||||||
|
NON-GAAP MARGINS
|
|||||||||||||||||||||||||||||||||||
|
Q1 '12
|
Q2 '12
|
Q3 '12
|
Q4 '12
|
FY '12
|
|||||||||||||||||||||||||||||||
|
Revenue
|
$ | 319,798 | $ | 301,861 | $ | 311,210 | $ | 325,295 | $ | 1,258,164 | |||||||||||||||||||||||||
|
Cost of license revenue
|
3,551 | 3,886 | 3,697 | 3,620 | 14,754 | ||||||||||||||||||||||||||||||
|
Cost of service revenue
|
88,047 | 83,221 | 83,170 | 78,179 | 332,617 | ||||||||||||||||||||||||||||||
|
Gross Margin
|
$ | 228,200 | 71.4 | % | $ | 214,754 | 71.1 | % | $ | 224,343 | 72.1 | % | $ | 243,496 | 74.9 | % | $ | 910,793 | 72.4 | % | |||||||||||||||
|
Sales & marketing
|
$ | 94,050 | 29.4 | % | $ | 87,656 | 29.0 | % | $ | 91,372 | 29.4 | % | $ | 90,909 | 27.9 | % | $ | 363,987 | 28.9 | % | |||||||||||||||
|
Research & development
|
52,444 | 16.4 | % | 52,336 | 17.3 | % | 51,374 | 16.5 | % | 50,045 | 15.4 | % | 206,199 | 16.4 | % | ||||||||||||||||||||
|
General & administrative
|
22,917 | 7.2 | % | 24,122 | 8.0 | % | 23,794 | 7.6 | % | 23,005 | 7.1 | % | 93,838 | 7.5 | % | ||||||||||||||||||||
|
Amortization of acquired intangible assets
|
- | 0.0 | % | - | 0.0 | % | - | 0.0 | % | - | 0.0 | % | - | 0.0 | % | ||||||||||||||||||||
|
Restructuring charge
|
- | 0.0 | % | - | 0.0 | % | - | 0.0 | % | - | 0.0 | % | - | 0.0 | % | ||||||||||||||||||||
|
Operating Expenses
|
$ | 169,411 | 53.0 | % | $ | 164,114 | 54.4 | % | $ | 166,540 | 53.5 | % | $ | 163,959 | 50.4 | % | $ | 664,024 | 52.8 | % | |||||||||||||||
|
Non-GAAP Operating Margin
|
$ | 58,789 | 18.4 | % | $ | 50,640 | 16.8 | % | $ | 57,803 | 18.6 | % | $ | 79,537 | 24.5 | % | $ | 246,769 | 19.6 | % | |||||||||||||||
|
PARAMETRIC TECHNOLOGY CORPORATION
|
|||||||||||||||||||
|
NON-GAAP FINANCIAL MEASURES AND RECONCILIATIONS (UNAUDITED)
|
|||||||||||||||||||
|
(in thousands, except per share data)
|
|||||||||||||||||||
|
Three Months Ended
|
Year Ended
|
||||||||||||||||||
|
September 30,
|
September 30,
|
September 30,
|
September 30,
|
||||||||||||||||
|
2012
|
2011
|
2012
|
2011
|
||||||||||||||||
|
GAAP revenue
|
$ | 325,295 | $ | 339,425 | $ | 1,255,679 | $ | 1,166,949 | |||||||||||
|
Fair value of acquired MKS deferred maintenance
|
|||||||||||||||||||
|
revenue
|
- | 1,913 | 2,485 | 2,606 | |||||||||||||||
|
Non-GAAP revenue
|
$ | 325,295 | $ | 341,338 | $ | 1,258,164 | $ | 1,169,555 | |||||||||||
|
GAAP gross margin
|
$ | 237,456 | $ | 240,898 | $ | 883,551 | $ | 810,181 | |||||||||||
|
Fair value of acquired MKS deferred maintenance
|
|||||||||||||||||||
|
revenue
|
- | 1,913 | 2,485 | 2,606 | |||||||||||||||
|
Stock-based compensation
|
2,188 | 2,160 | 8,938 | 7,747 | |||||||||||||||
|
Amortization of acquired intangible assets
|
|||||||||||||||||||
|
included in cost of license revenue
|
3,852 | 4,796 | 15,819 | 15,393 | |||||||||||||||
|
Non-GAAP gross margin
|
$ | 243,496 | $ | 249,767 | $ | 910,793 | $ | 835,927 | |||||||||||
|
GAAP operating income
|
$ | 57,605 | $ | 51,248 | $ | 128,096 | $ | 117,114 | |||||||||||
|
Fair value of acquired MKS deferred maintenance
|
|||||||||||||||||||
|
revenue
|
- | 1,913 | 2,485 | 2,606 | |||||||||||||||
|
Stock-based compensation
|
11,900 | 12,944 | 51,305 | 45,402 | |||||||||||||||
|
Amortization of acquired intangible assets
|
|||||||||||||||||||
|
included in cost of license revenue
|
3,852 | 4,796 | 15,819 | 15,393 | |||||||||||||||
|
Amortization of acquired intangible assets
|
4,859 | 5,446 | 20,303 | 18,319 | |||||||||||||||
|
Acquisition-related charges included in
|
|||||||||||||||||||
|
general and administrative expenses
|
1,321 | 1,112 | 3,833 | 7,761 | |||||||||||||||
|
Restructuring charges
|
- | - | 24,928 | - | |||||||||||||||
|
Non-GAAP operating income (2)
|
$ | 79,537 | $ | 77,459 | $ | 246,769 | $ | 206,595 | |||||||||||
|
GAAP net income (loss)
|
$ | (83,985 | ) | $ | 37,621 | $ | (35,398 | ) | $ | 85,424 | |||||||||
|
Fair value of acquired MKS deferred maintenance
|
|||||||||||||||||||
|
revenue
|
- | 1,913 | 2,485 | 2,606 | |||||||||||||||
|
Stock-based compensation
|
11,900 | 12,944 | 51,305 | 45,402 | |||||||||||||||
|
Amortization of acquired intangible assets
|
|||||||||||||||||||
|
included in cost of license revenue
|
3,852 | 4,796 | 15,819 | 15,393 | |||||||||||||||
|
Amortization of acquired intangible assets
|
4,859 | 5,446 | 20,303 | 18,319 | |||||||||||||||
|
Acquisition-related charges included in
|
|||||||||||||||||||
|
general and administrative expenses
|
1,321 | 1,112 | 3,833 | 7,761 | |||||||||||||||
|
Restructuring charges
|
- | - | 24,928 | - | |||||||||||||||
|
Non-operating foreign currency transaction losses (3)
|
- | - | 761 | 5,107 | |||||||||||||||
|
Income tax adjustments (4)
|
122,255 | (7,662 | ) | 98,827 | (27,846 | ) | |||||||||||||
|
Non-GAAP net income
|
$ | 60,202 | $ | 56,170 | $ | 182,863 | $ | 152,166 | |||||||||||
|
GAAP diluted earnings (loss) per share
|
$ | (0.71 | ) | $ | 0.31 | $ | (0.30 | ) | $ | 0.71 | |||||||||
|
Stock-based compensation
|
0.10 | 0.11 | 0.42 | 0.38 | |||||||||||||||
|
Amortization of acquired intangibles
|
0.07 | 0.09 | 0.30 | 0.28 | |||||||||||||||
|
Acquisition-related charge
|
0.01 | 0.01 | 0.03 | 0.06 | |||||||||||||||
|
Restructuring charges
|
- | - | 0.21 | - | |||||||||||||||
|
Income tax adjustments
|
1.01 | (0.06 | ) | 0.82 | (0.23 | ) | |||||||||||||
|
Non-operating foreign currency transaction losses
|
- | - | 0.01 | 0.04 | |||||||||||||||
|
All other items identified above
|
- | 0.01 | 0.02 | 0.02 | |||||||||||||||
|
Non-GAAP diluted earnings per share
|
$ | 0.50 | $ | 0.47 | $ | 1.51 | $ | 1.26 | |||||||||||
|
GAAP diluted weighted average shares outstanding
|
119,048 | 120,091 | 118,705 | 120,974 | |||||||||||||||
|
Dilutive effect of stock based compensation plans
|
2,227 | - | 2,293 | - | |||||||||||||||
|
Non-GAAP diluted weighted average shares outstanding
|
121,275 | 120,091 | 120,998 | 120,974 | |||||||||||||||
| (2 | ) |
Operating margin impact of non-GAAP adjustments:
|
||||||||||||||||||
|
Three Months Ended
|
Year Ended
|
|||||||||||||||||||
|
September 30,
|
September 30,
|
September 30,
|
September 30,
|
|||||||||||||||||
| 2012 | 2011 | 2012 | 2011 | |||||||||||||||||
|
GAAP operating margin
|
17.7 | % | 15.1 | % | 10.2 | % | 10.0 | % | ||||||||||||
|
Fair value of deferred maintenance revenue
|
0.0 | % | 0.6 | % | 0.2 | % | 0.2 | % | ||||||||||||
|
Stock-based compensation
|
3.7 | % | 3.8 | % | 4.1 | % | 3.9 | % | ||||||||||||
|
Amortization of acquired intangibles
|
2.7 | % | 3.0 | % | 2.9 | % | 2.9 | % | ||||||||||||
|
Acquisition-related charges
|
0.4 | % | 0.3 | % | 0.3 | % | 0.7 | % | ||||||||||||
|
Restructuring charges
|
0.0 | % | 0.0 | % | 2.0 | % | 0.0 | % | ||||||||||||
|
Non-GAAP operating margin
|
24.5 | % | 22.7 | % | 19.6 | % | 17.7 | % | ||||||||||||
| (3 | ) |
In the first quarter of 2012 we recorded $0.8 million of foreign currency transaction losses related to MKS legal entity mergers completed during the quarter. In the third quarter of 2011, in connection with our acquisition of MKS, we had entered into forward contracts to reduce our foreign currency exposure related to changes in the Canadian to U.S. Dollar exchange rate from the time we entered into the agreement in early April to acquire MKS (the purchase price was in Canadian Dollars) and the closing date which occurred on May 31, 2011. We realized foreign currency losses of $4.4 million recorded as other expense related to the acquisition. In the first quarter of 2011 we recorded $0.7 million of foreign currency losses related to a previously announced litigation settlement in Japan.
|
||||||||||||||||||
| (4 | ) |
Reflects the tax effects of non-GAAP adjustments for the fourth quarter and full year of 2012 and 2011, which are calculated by applying the applicable tax rate by jurisdiction to the non-GAAP adjustments listed above, as well as one-time non-cash GAAP charges, net, of $124.5 million related to the establishment of a valuation allowance against our net U.S. deferred tax assets and $5.4 million, net primarily related to foreign tax credits which would be fully realized on a non-GAAP basis recorded in the fourth quarter of 2012; $3.3 million primarily related to acquired legal entity integration activities recorded in the third quarter of 2012; and $1.4 million related to the impact from a reduction in the statutory tax rate in Japan on deferred tax assets from a litigation settlement recorded in the first quarter of 2012. The third quarter of 2011 reflects a one-time non-cash GAAP charge of $1.9 million related to a legal entity reorganization.
|
||||||||||||||||||