Attached files
| file | filename |
|---|---|
| 8-K - FORM 8-K - PACIFIC GAS & ELECTRIC Co | form8k3qeps.htm |
| EX-99.1 - PRESS RELEASE - PACIFIC GAS & ELECTRIC Co | ex9901.htm |
* PG&E Corporation This presentation is not complete without the accompanying statements made by management during the webcast conference call held on October 29, 2012. This presentation, including Exhibits, and the accompanying press release, were attached to PG&E Corporation’s Current Report on Form 8-K that was furnished to the Securities and Exchange Commission on October 29, 2012, and along with the replay of the conference call, are also available on PG&E Corporation’s website at www.pge-corp.com. Third Quarter Earnings Call October 29, 2012

* Key Focus Areas Position company for success Rebuild relationships with key stakeholders Resolve gas issues Move forward with gas work planned in 2012 Work to resolve regulatory and legal proceedings Conduct rigorous benchmarking Build culture of continuous improvement Provide excellent service Meet commitments to customers and regulators

* Regulatory and Operational Updates Operational Updates Q3 Pipeline work: Validated MAOP* for over 800 miles of pipeline Pressure tested 85 miles of pipeline Installed 11 automated safety valves Installed 12 miles of pipe Hinkley update Residents have made selections – property purchase or water system Final remediation plan decision expected in 2013 * Maximum Allowable Operating Pressure Regulatory Developments Regulatory Developments PSEP Proposed Decision Approves scope of work, but disallows significant portion of requested funding, including all contingency and advice letter mechanism Reduces return on equity on 2012 – 2014 capex for five years

* 3Q 2012: Earnings Results

* 3Q 2012: Q over Q Comparison EPS from Operations (1) (1) EPS from Operations is not calculated in accordance with GAAP and excludes items impacting comparability. See Exhibit 4 of the Appendix for a reconciliation of EPS from Operations to EPS on a GAAP basis. (2) Other items reflect litigation and regulatory matters and miscellaneous items. See Exhibit 6 of the Appendix for the full walk. (2) (2)

* (1) Includes estimated 2012 cost of Pipeline Safety Enhancement Plan (PSEP) pending regulatory decision. The guidance range for 2012 does not include future insurance recoveries or potential penalties (other than those already accrued) or any potential punitive damages. It also does not reflect any capital write-off associated with the proposed decision in the PSEP. Changes from prior quarter are noted in blue. See Exhibit 1 of the Appendix for factors that could cause actual results to differ materially from the guidance presented and underlying assumptions. 2012 EPS Guidance

* (1) Reflects full Pipeline Safety Enhancement Plan (PSEP) and 2014 General Rate Case (GRC) requests, as well as amounts for electric transmission, gas transmission and other capital investments. PSEP requested rate base for 2012-2014 is ~$140M, ~$480M and ~$985M, respectively. GRC-related rate base authorized/requested for 2012-2014 is ~$18.5B, ~$19.4B, and ~$21.6B, respectively (2) Cost of Capital (CoC) filing requests 11% ROE and 52% equity (3) Earnings on construction work in progress (CWIP) offset by “below-the-line” costs which are expected to increase post-2012 (4) Amounts driven by capital expenditures, timing of cash flows, the potential expiration of bonus depreciation, unrecovered gas pipeline costs, planned incremental work across the Utility, and other factors * “Earnings from operations” is not calculated in accordance with GAAP and excludes items impacting comparability (such as natural gas matters) Factors Affecting EPS from Operations*

* Factors Affecting Natural Gas Matters
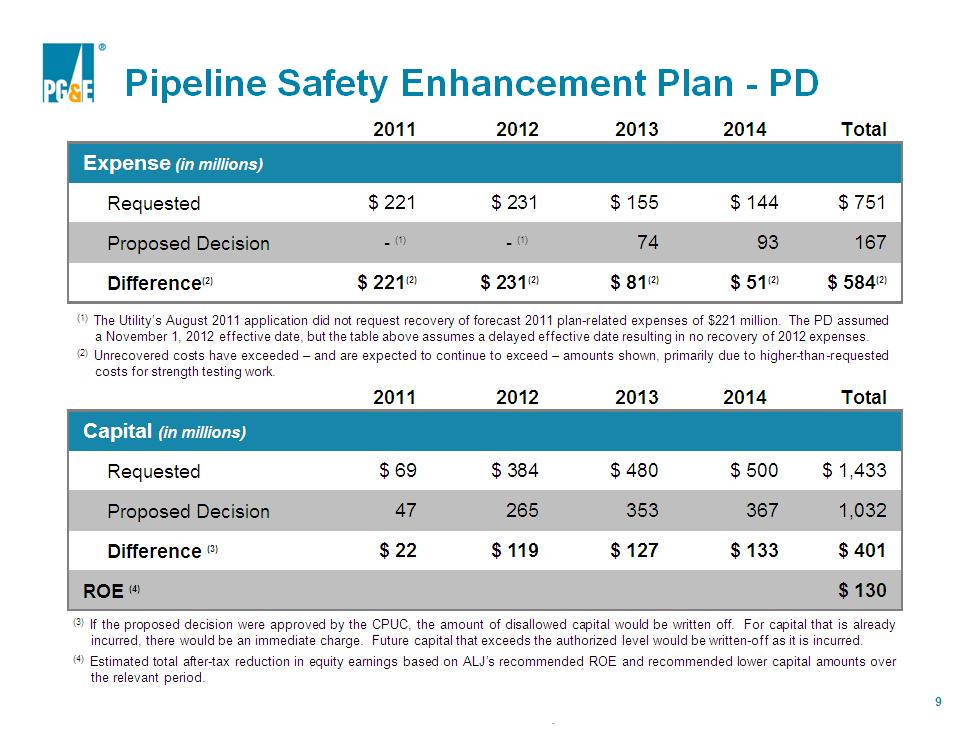
* Pipeline Safety Enhancement Plan - PD (3) If the proposed decision were approved by the CPUC, the amount of disallowed capital would be written off. For capital that is already incurred, there would be an immediate charge. Future capital that exceeds the authorized level would be written-off as it is incurred. (4) Estimated total after-tax reduction in equity earnings based on ALJ’s recommended ROE and recommended lower capital amounts over the relevant period. (1) The Utility’s August 2011 application did not request recovery of forecast 2011 plan-related expenses of $221 million. The PD assumed a November 1, 2012 effective date, but the table above assumes a delayed effective date resulting in no recovery of 2012 expenses. (2) Unrecovered costs have exceeded – and are expected to continue to exceed – amounts shown, primarily due to higher-than-requested costs for strength testing work.

* Appendix

* Exhibit 1: Safe Harbor Statement Page 12 Exhibit 2: Regulatory Calendar Page 13 Exhibit 3: Assumptions for 2012 Guidance Page 14 Exhibit 4: Reconciliation of PG&E Corporation Earnings from Operations Page 15 to Consolidated Income Available for Common Shareholders in Accordance with GAAP Exhibit 5: Reconciliation of Pacific Gas and Electric Company Earnings Page 16 from Operations to Consolidated Income Available for Common Stock in Accordance with GAAP Exhibit 6: Key Drivers of PG&E Corporation Earnings per Common Share Page 17 from Operations Exhibit 7: Operational Performance Metrics Page 18-19 Exhibit 8: Sales and Sources Summary Page 20 Exhibit 9: EPS Guidance Page 21 Exhibit 10: General Earnings Sensitivities Page 22 Exhibit 11: Summary of Selected Regulatory Cases Page 23-24 Table of Contents

* Management's statements regarding guidance for PG&E Corporation’s future financial results and earnings from operations per common share, the underlying assumptions, and general earnings sensitivities, constitute forward-looking statements that are necessarily subject to various risks and uncertainties. These statements reflect management’s judgment and opinions which are based on current expectations and various forecasts, estimates, and projections, the realization or resolution of which may be outside of management’s control. PG&E Corporation and the Utility are not able to predict all the factors that may affect future results. Some of the factors that could cause actual results to differ materially include: the outcomes of the investigations, enforcement matters, and litigation related to the Utility’s natural gas system operating practices and the San Bruno accident, including the ultimate amount of penalties or loss the Utility incurs; the outcomes of regulatory proceedings, such as the CPUC’s natural gas rulemaking proceeding, and ratemaking proceedings, such as the 2014 GRC and the 2013 cost of capital proceeding; the ultimate amount of costs the Utility incurs in the future that are not recovered through rates, including costs under its pipeline safety enhancement plan and to perform incremental work to improve the safety and reliability of its electric and natural gas operations; whether PG&E Corporation and the Utility are able to repair the reputational harm that they have suffered, and may suffer in the future, due to the San Bruno accident and the related civil litigation, the occurrence of adverse developments in the CPUC investigations or the criminal investigation, including any finding of criminal liability; the level of equity contributions that PG&E Corporation must make to the Utility to enable the Utility to maintain its authorized capital structure as the Utility incurs charges and costs, including costs associated with natural gas matters and penalties imposed in connection with investigations, that are not recoverable through rates or insurance; the impact of environmental remediation laws, regulations, and orders; the ultimate amount of the Utility’s environmental remediation costs; the extent to which the Utility is able to recover such costs through rates or insurance; and the ultimate amount of environmental costs the Utility incurs that are not recoverable, such as the remediation costs associated with the Utility’s natural gas compressor station site located near Hinkley, California; the impact of new legislation, regulations, recommendations, orders or policies applicable to the operations, security, safety, or decommissioning of nuclear generation facilities, the storage of spent nuclear fuel, seismic design, cooling water intake, or other issues; the occurrence of events, including cyber-attacks, that can cause unplanned outages, reduce generating output, disrupt the Utility’s service to customers, or damage or disrupt the facilities, operations, or information technology and systems owned by the Utility, its customers, or third parties on which the Utility relies; and the other factors and risks discussed in PG&E Corporation and the Utility’s 2011 Annual Report on Form 10-K and other reports filed with the Securities and Exchange Commission. Exhibit 1: Safe Harbor Statement

* Exhibit 2: Regulatory Calendar 11/26 – 12/6: Evidentiary hearings resume 8/20: CPSD Rebuttal Testimony 12/20: Final Decision Recordkeeping OII I. 11-02-016 Gas Pipeline Safety OIR R. 11-02-019 10/12: Proposed Decision 11/13: Comments on Proposed Decision 11/26: Reply Comments on Proposed Decision 8/15: CPSD Rebuttal Testimony Class Location OII I. 11-11-009 8/23-8/30: Hearings 11/26/12 – 1/8/13: Evidentiary hearings for financial analysis 8/20: CPSD Rebuttal Testimony 11/9: Intervenor briefs on financial analysis 10/11-11/1: Suspension of Hearings 9/24 -10/19: Evidentiary Hearings Gas Pipeline OII I. 12-01-007 11/19: PG&E reply briefs on financial analysis 9/5- 9/19: Evidentiary Hearings 11/9: Intervenor briefs on financial analysis 11/19: PG&E reply briefs on financial analysis 11/19: Concurrent reply briefs 11/9: Concurrent opening briefs 11/26/12 – 1/8/13: Evidentiary hearings for financial analysis 10/11-11/1: Suspension of Hearings 11/9: Intervenor briefs on financial analysis 11/19: PG&E reply briefs on financial analysis 11/26/12 – 1/8/13: Evidentiary hearings for financial analysis 11/26 – 12/6: Evidentiary hearings resume
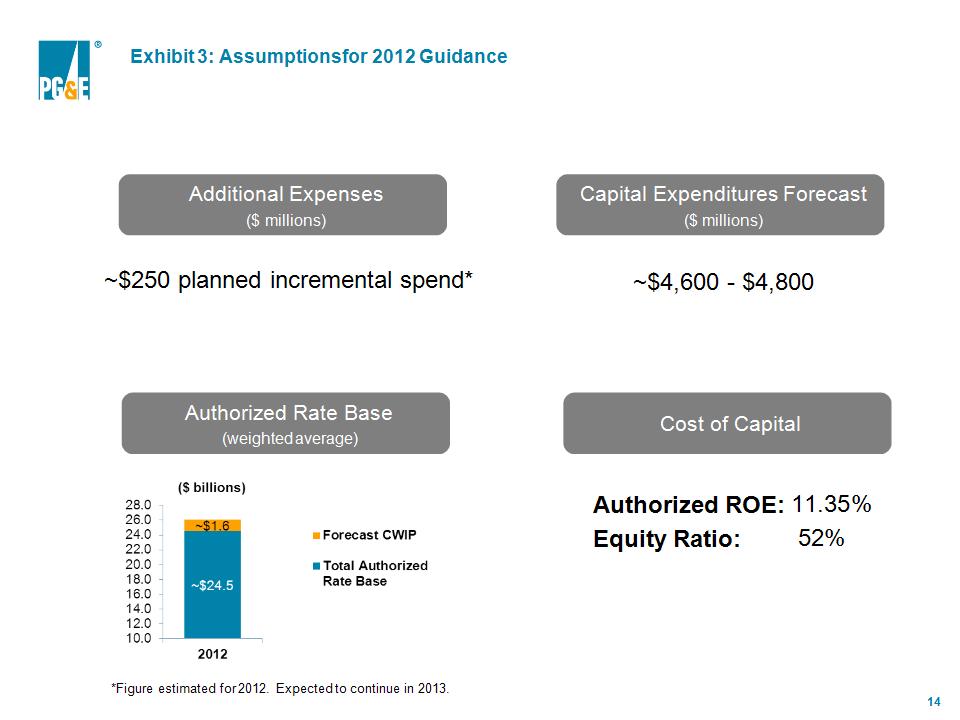
* ~$4,600 - $4,800 Capital Expenditures Forecast ($ millions) Authorized ROE: 11.35% Equity Ratio: 52% Cost of Capital Additional Expenses ($ millions) ~$250 planned incremental spend* Authorized Rate Base (weighted average) Exhibit 3: Assumptions for 2012 Guidance *Figure estimated for 2012. Expected to continue in 2013.

* (4) The Utility recorded charges of $14 million and $56 million, after-tax, during the three and nine months ended September 30, 2012, respectively, for environmental remediation costs associated with the Utility's natural gas compressor site located near Hinkley, California (“Hinkley natural gas compressor site”). “Earnings from operations” is not calculated in accordance with GAAP and excludes items impacting comparability as described in Note (2) below. Items impacting comparability reconcile earnings from operations with Consolidated Income Available for Common Shareholders as reported in accordance with GAAP. PG&E Corporation’s subsidiary, Pacific Gas and Electric Company (“Utility”) incurred net costs of $40 million and $386 million, pre-tax, during the three and nine months ended September 30, 2012, respectively, in connection with natural gas matters. For the three and nine months ended September 30, 2012, these amounts included pipeline-related costs to validate safe operating pressures, conduct strength testing, and perform other activities associated with safety improvements to the Utility’s natural gas pipeline system, as well as legal and regulatory costs. These costs were partially offset by insurance recoveries. Costs incurred for the nine months ended September 30, 2012 also included an increase in the accrual for third-party claims related to the San Bruno accident and a contribution to the City of San Bruno. There were no additional charges incurred during these periods related to penalties. Third Quarter, 2012 vs. 2011 (in millions, except per share amounts) Exhibit 4: Reconciliation of PG&E Corporation Earnings from Operations to Consolidated Income Available for Common Shareholders in Accordance with Generally Accepted Account Principles (“GAAP”)

* Please refer to Exhibit 4 for accompanying footnotes. Third Quarter and Year-to-Date, 2012 vs. 2011 (in millions) Exhibit 5: Reconciliation of Pacific Gas and Electric Company Earnings from Operations to Consolidated Income Available for Common Stock in Accordance with GAAP

* See Exhibit 4 for a reconciliation of EPS from Operations to EPS on a GAAP basis. Third Quarter and Year-to-Date, 2012 vs. 2011 ($/Share, Diluted) Exhibit 6: Key Drivers of PG&E Corporation Earnings per Common Share (“EPS”) from Operations
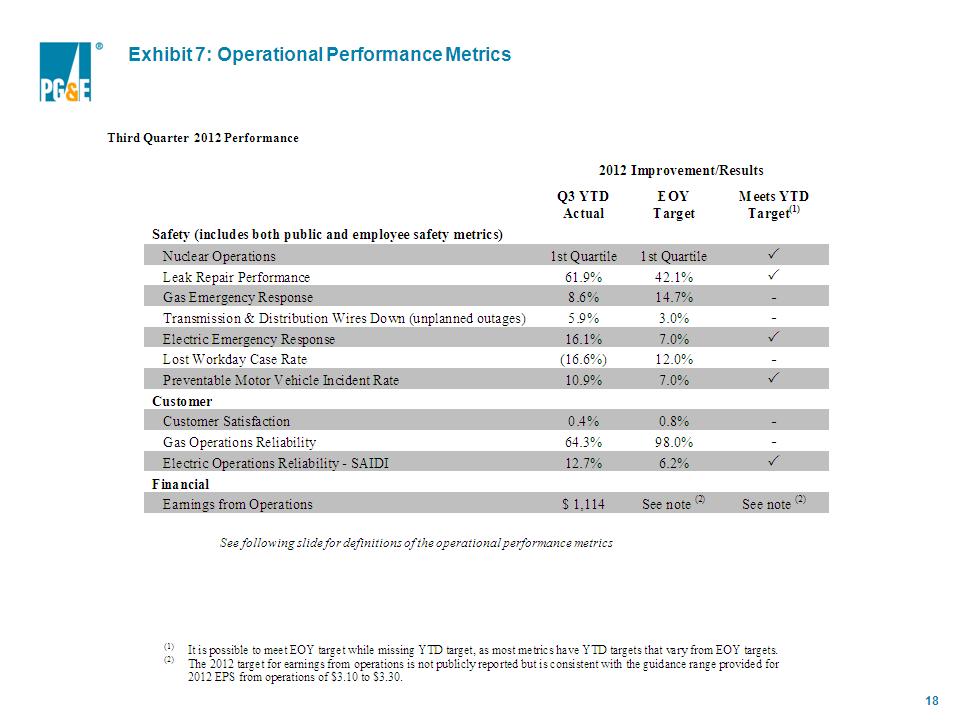
* Third Quarter 2012 Performance See following slide for definitions of the operational performance metrics Exhibit 7: Operational Performance Metrics

* The Operational Performance Metrics focus on three areas: safety (public and employee), customer service, and financial performance. The EOY goals for each metric except for nuclear performance are stated relative to percentage improvement in prior year performance. The YTD Actual column provides actual percentage improvement (or decline) through the current quarter. The column titled “Meets YTD Target” shows illustratively whether or not the metric has met the year-to-date target, which may be different from the EOY target. Safety Public safety metrics focus on Utility operations in three areas: The safety of the Utility’s nuclear power operations is represented by 12 performance indicators for nuclear power generation reported to the Institute of Nuclear Power Operations (“INPO”) and compared to industry benchmarks. The safety of the Utility’s natural gas operations is represented by (a) the percentage improvement in number of completed grade 2 leak repairs, and (b) the percentage improvement in emergency response times of when utility gas personnel are on-site within one hour, and within 30 minutes of receiving an immediate response gas emergency order. The safety of the Utility’s electric operations is represented by (a) the percentage improvement in the number of wire down events with resulting sustained unplanned outages, and (b) the percentage improvement in emergency response times of when utility electric personnel relieve 911 personnel at the site of a potential PG&E electric hazard within 60 minutes. Employee safety metrics focus on two areas: The percentage improvement in the number of Lost Workday Cases incurred per 200,000 hours worked. A lost workday case is a current year OSHA recordable incident that has resulted in at least one lost workday. The percentage improvement in the Preventable MVI Rate, which measures the number of chargeable motor vehicle incidents per one million miles driven. A chargeable incident is one where the employee-driver could have prevented an incident, but failed to take reasonable steps to do so. Customer Customer satisfaction and service reliability are measured in three areas. The percentage improvement in the Customer Satisfaction Score, which measures overall satisfaction with the Utility’s performance in delivering reliable service, pricing of services, and customer service experience. The score is weighted 60 percent for residential customers and 40 percent for small and medium business customers, based on a quarterly survey performed by an independent third-party research firm. Gas Operations Reliability is measured by the percentage improvement in the timeliness of jobs entered into the gas mapping system. Electric Operations Reliability is measured by the percentage improvement in the System Average Interruption Duration Index (“SAIDI”), which reflects the total time the average customer is without electric power, measured in minutes. Financial Earnings from operations measures PG&E Corporation’s earnings power from ongoing core operations. It allows investors to compare the underlying financial performance of the business from one period to another, exclusive of items that management believes do not reflect the normal course of operations (items impacting comparability). The measurement is not in accordance with GAAP. For a reconciliation of earnings from operations to earnings in accordance with GAAP, see Exhibit 4 PG&E Corporation Earnings from Operations and GAAP Income. Definitions of 2012 Operational Performance Metrics from Exhibit 7

* See the discussions under Electricity Distribution Operating Statistics and Natural Gas Statistics in the 2011 Annual Report on Form 10-K for additional information. Third Quarter, 2012 vs. 2011 Exhibit 8: Pacific Gas and Electric Company Sales and Sources Summary

* Items impacting comparability reconcile earnings from operations with Consolidated Income Available for Common Shareholders in accordance with GAAP. The range includes pipeline-related costs associated with the scope of work that the Utility expects to undertake on its natural gas pipeline system, as well as other items described below. The pipeline-related cost range of $450 million to $550 million includes costs associated with regulatory and legal proceedings and other gas pipeline costs that are not expected to be recoverable through rates. If the proposed decision regarding the Utility’s pipeline safety enhancement plan (“PSEP”) is adopted by the CPUC, the Utility would be prohibited from recovering PSEP-related expenses incurred before the effective date of a final decision and from recovering a significant portion of costs to be incurred under the PSEP in future periods. Although the Utility believes the ultimate amount of penalties could be materially higher than the $200 million accrued as of December 31, 2011, losses for penalties are recognized only when deemed probable and reasonably estimable under applicable accounting standards. The contribution to the City of San Bruno was to support the city and community’s recovery efforts related to the San Bruno accident. Based on the combined total of $375 million accrued in 2010 and 2011, the cumulative range for third-party claims is $455 million to $600 million. Although the Utility believes that a significant portion of the costs it incurs for third-party claims will be recovered through its insurance, insurance recoveries are recognized only when deemed probable under applicable accounting standards. The guidance provided does not include any potential future insurance recoveries or penalties (other than those already accrued) or any potential punitive damages. (3) The environmental-related costs range is an estimate that depends primarily on the outcome of a final groundwater remediation plan and other related activities associated with the Hinkley natural gas compressor site. Actual financial results for 2012 may differ materially from the EPS guidance provided. For a discussion of the factors that may affect future results, see Exhibit 1. Exhibit 9: PG&E Corporation EPS Guidance

* Actual financial results for 2012 may differ materially from the guidance provided. For a discussion of the factors that may affect future results, see Exhibit 1. Exhibit 10: General Earnings Sensitivities PG&E Corporation and Pacific Gas and Electric Company

* Exhibit 11: Pacific Gas and Electric Company Summary of Selected Regulatory Cases

* Exhibit 11: Pacific Gas and Electric Company Summary of Selected Regulatory Cases (continued)