Attached files
| file | filename |
|---|---|
| 8-K - 8-K - VEECO INSTRUMENTS INC | a12-24574_18k.htm |
| EX-99.1 - EX-99.1 - VEECO INSTRUMENTS INC | a12-24574_1ex99d1.htm |
Exhibit 99.2
|
|
Q3 2012 Financial Results Earnings Conference Call October 22, 2012 |
|
|
Safe Harbor Statement To the extent that this presentation discusses expectations or otherwise makes statements about the future, such statements are forward-looking and are subject to a number of risks and uncertainties that could cause actual results to differ materially from the statements made. These items include the risk factors discussed in the Business Description and Management's Discussion and Analysis sections of Veeco's Annual Report on Form 10-K for the year ended December 31, 2011 and subsequent Quarterly Reports on Form 10-Q and current reports on Form 8-K. Veeco does not undertake any obligation to update any forward-looking statements to reflect future events or circumstances after the date of such statements. In addition, this presentation includes non-GAAP financial measures. For GAAP reconciliation, please refer to the reconciliation section in this presentation as well as Veeco’s financial press releases and 10-K and 10-Q filings available on www.veeco.com. Note: All results presented herein are for Veeco’s “Continuing Operations” which excludes the Metrology business sold to Bruker Corporation on October 7, 2010 and reflects the discontinuation of Veeco’s CIGS Solar Systems Business in the third quarter of 2011. |
|
|
John Peeler, Chairman and CEO Q3 2012 Results Overview |
|
|
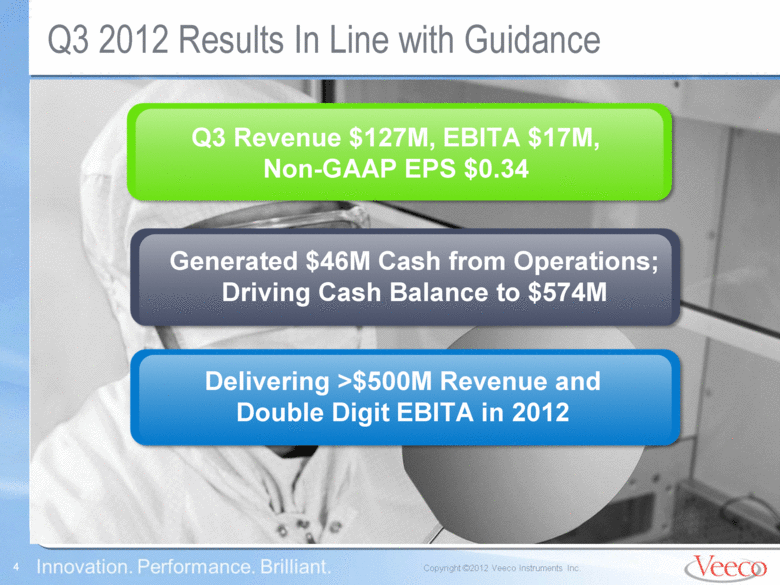
Q3 2012 Results In Line with Guidance Generated $46M Cash from Operations; Driving Cash Balance to $574M Delivering >$500M Revenue and Double Digit EBITA in 2012 Q3 Revenue $127M, EBITA $17M, Non-GAAP EPS $0.34 |
|
|
Macro Uncertainty and Excess Capacity Dampens Equipment Demand Q3 2012 bookings at $84M: represents trough levels in all businesses MOCVD continues to bump along the bottom Sequential decline in MBE: no production buys Data Storage customers froze capex: Post-flood overcapacity Weaker than expected hard drive demand All Veeco End Markets Impacted by Economic Weakness |
|
|
Veeco Wins Strategic LED Deals General Lighting is growing Fab utilization rates grew and stabilized Veeco secures key multi-million dollar deals: Three leaders in China add capacity Top Taiwan player again adds Veeco systems U.S. leader adds incremental capacity Japan LED maker expanding GaN-on-Si |
|
|
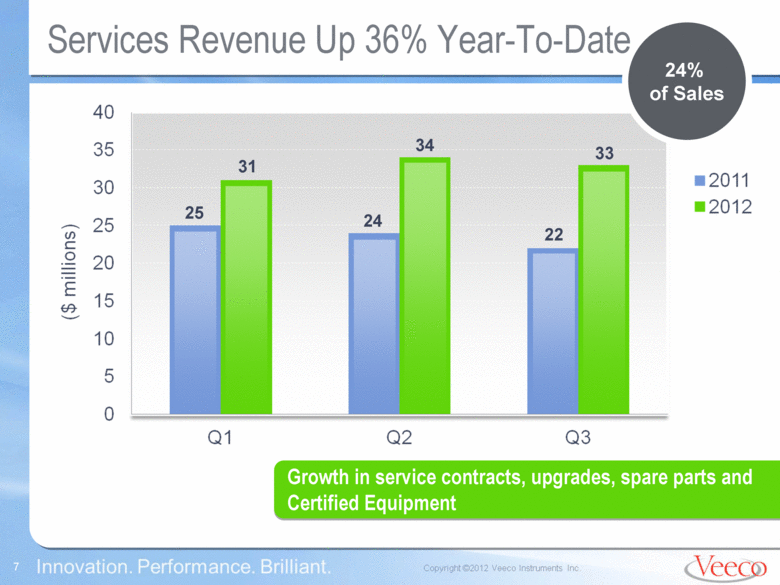
Services Revenue Up 36% Year-To-Date Growth in service contracts, upgrades, spare parts and Certified Equipment 25 31 34 24 22 33 24% of Sales ($ millions) 40 35 30 25 20 15 10 5 0 2011 2012 |
|
|
David Glass, CFO Q3 2012 Results & Q4 2012 Guidance |
|
|
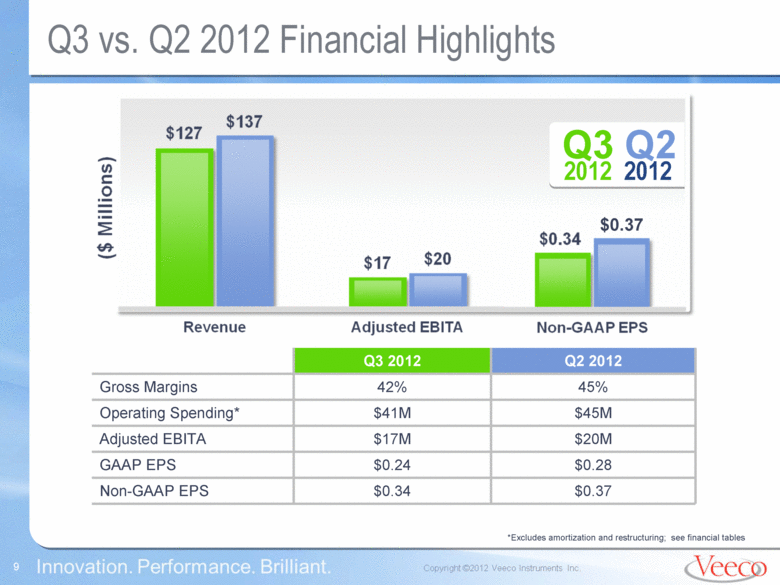
Q3 vs. Q2 2012 Financial Highlights z Q3 2012 Q2 2012 $0.37 Q3 2012 Q2 2012 Gross Margins 42% 45% Operating Spending* $41M $45M Adjusted EBITA $17M $20M GAAP EPS $0.24 $0.28 Non-GAAP EPS $0.34 $0.37 *Excludes amortization and restructuring; see financial tables ($ Millions) $127 $137 $17 $20 $0.34 Revenue |
|
|
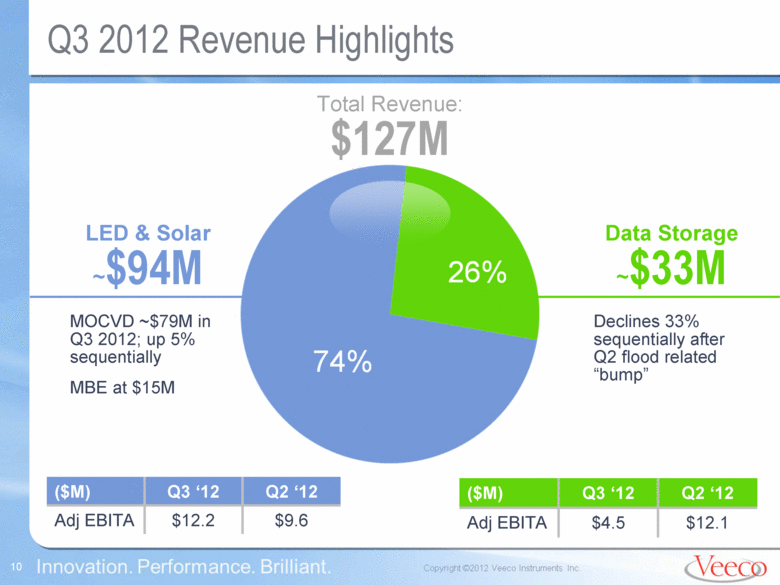
Q3 2012 Revenue Highlights Total Revenue: $127M LED & Solar ~$94M MOCVD ~$79M in Q3 2012; up 5% sequentially MBE at $15M ($M) Q3 ‘12 Q2 ‘12 Adj EBITA $12.2 $9.6 ($M) Q3 ‘12 Q2 ‘12 Adj EBITA $4.5 $12.1 Data Storage ~$33M Declines 33% sequentially after Q2 flood related “bump” 26% 74% |
|
|
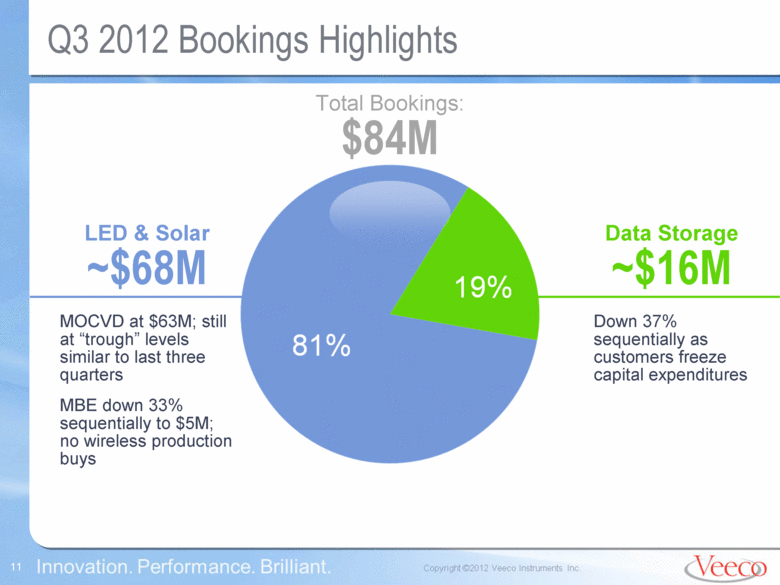
Q3 2012 Bookings Highlights Total Bookings: $84M LED & Solar ~$68M MOCVD at $63M; still at “trough” levels similar to last three quarters MBE down 33% sequentially to $5M; no wireless production buys Data Storage ~$16M Down 37% sequentially as customers freeze capital expenditures 19% 81% |
|
|
Improved Balance Sheet in Q3 2012 9/30/12 6/30/12 Cash & Short-term Investments* $574 $540 Accounts Receivable 60 95 Inventory 81 91 Fixed Assets, Net 99 97 Total Assets 958 950 Long-term Debt (including current portion) 2 3 Equity 819 797 ($ millions) Generated $46M in cash from operations Accounts receivable decreased to $60M (DSO = 43 days) Inventory declined by $10M to $81M (Turns improved to 3.6x) *Includes $0.9 million of restricted cash |
|
|
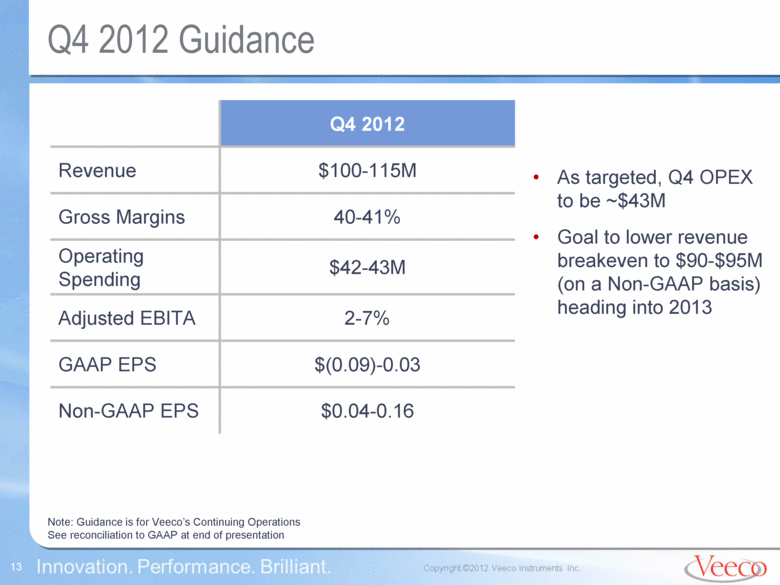
Q4 2012 Guidance Note: Guidance is for Veeco’s Continuing Operations See reconciliation to GAAP at end of presentation Q4 2012 Revenue $100-115M Gross Margins 40-41% Operating Spending $42-43M Adjusted EBITA 2-7% GAAP EPS $(0.09)-0.03 Non-GAAP EPS $0.04-0.16 As targeted, Q4 OPEX to be ~$43M Goal to lower revenue breakeven to $90-$95M (on a Non-GAAP basis) heading into 2013 |
|
|
John Peeler, Outlook & Summary |
|
|
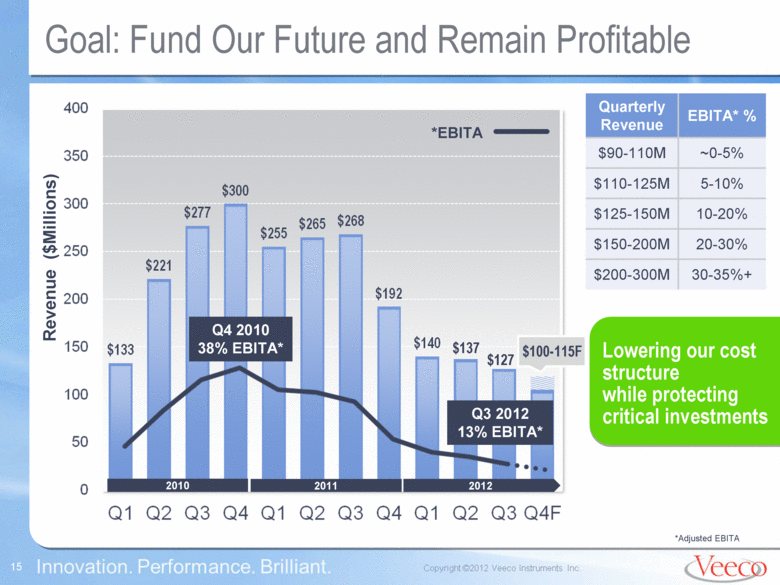
Goal: Fund Our Future and Remain Profitable Quarterly Revenue EBITA* % $90-110M ~0-5% $110-125M 5-10% $125-150M 10-20% $150-200M 20-30% $200-300M 30-35%+ Revenue ($Millions) *EBITA $137 $100-115F *Adjusted EBITA Q4 2010 38% EBITA* 2010 2011 2012 Lowering our cost structure while protecting critical investments Q3 2012 13% EBITA* $127 |
|
|
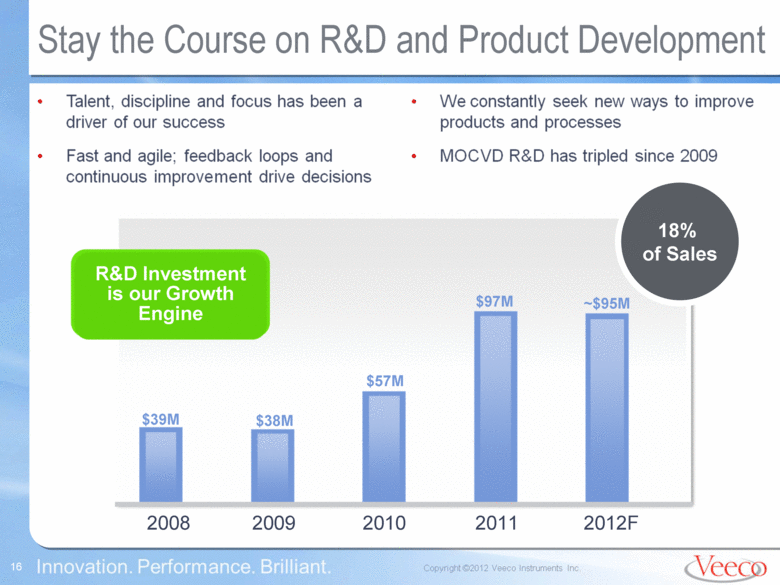
Stay the Course on R&D and Product Development $39M $38M $57M ~$95M R&D Investment is our Growth Engine 2008 2009 2010 2011 2012F $97M 18% of Sales |
|
|
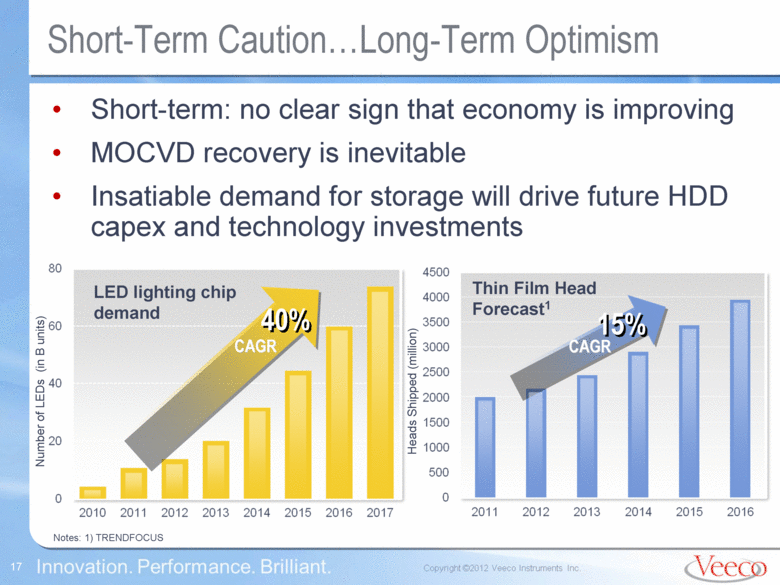
Short-Term Caution...Long-Term Optimism Short-term: no clear sign that economy is improving MOCVD recovery is inevitable Insatiable demand for storage will drive future HDD capex and technology investments 40% LED lighting chip demand CAGR Number of LEDs (in B units) Notes: 1) TRENDFOCUS Heads Shipped (million) 15% Thin Film Head Forecast1 CAGR |
|
|
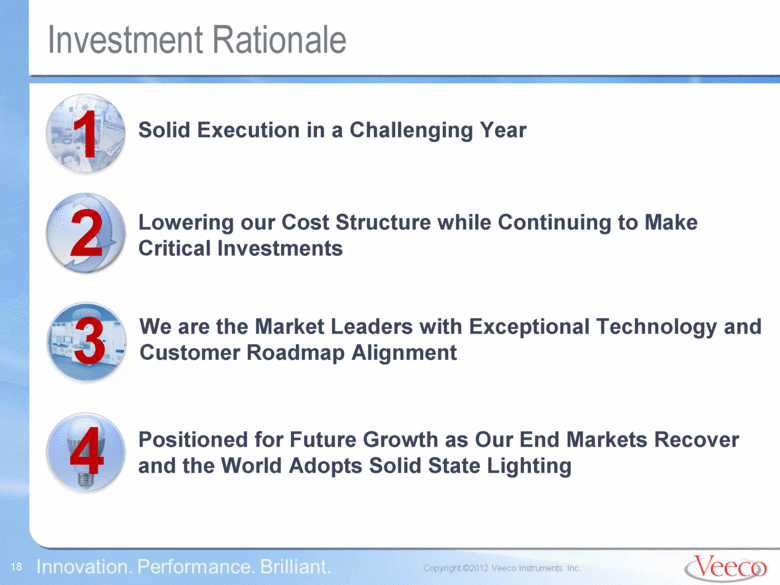
Investment Rationale 1 Solid Execution in a Challenging Year 3 Lowering our Cost Structure while Continuing to Make Critical Investments We are the Market Leaders with Exceptional Technology and Customer Roadmap Alignment Positioned for Future Growth as Our End Markets Recover and the World Adopts Solid State Lighting 2 4 |
|
|
Q3 2012 Financial Results – Q&A |
|
|
Additional Financial Slides |
|
|
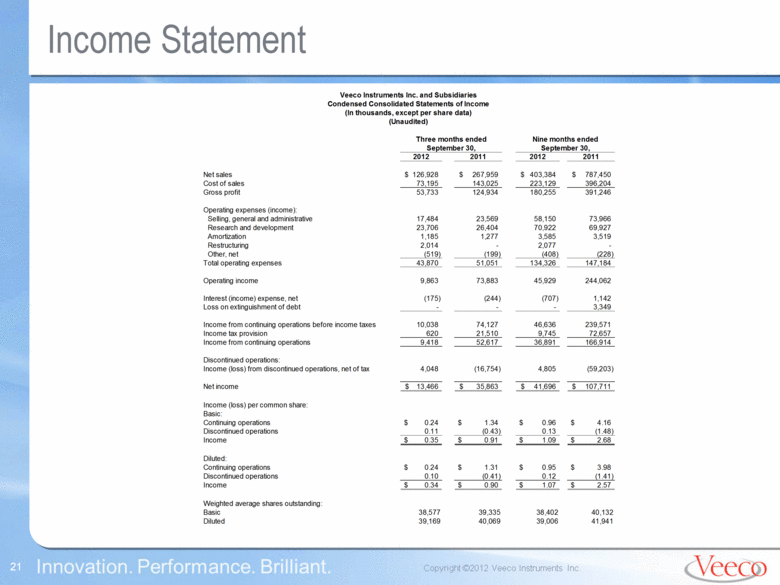
Income Statement 2012 2011 2012 2011 Net sales 126,928 $ 267,959 $ 403,384 $ 787,450 $ Cost of sales 73,195 143,025 223,129 396,204 Gross profit 53,733 124,934 180,255 391,246 Operating expenses (income): Selling, general and administrative 17,484 23,569 58,150 73,966 Research and development 23,706 26,404 70,922 69,927 Amortization 1,185 1,277 3,585 3,519 Restructuring 2,014 - 2,077 - Other, net (519) (199) (408) (228) Total operating expenses 43,870 51,051 134,326 147,184 Operating income 9,863 73,883 45,929 244,062 Interest (income) expense, net (175) (244) (707) 1,142 Loss on extinguishment of debt - - - 3,349 Income from continuing operations before income taxes 10,038 74,127 46,636 239,571 Income tax provision 620 21,510 9,745 72,657 Income from continuing operations 9,418 52,617 36,891 166,914 Discontinued operations: Income (loss) from discontinued operations, net of tax 4,048 (16,754) 4,805 (59,203) Net income 13,466 $ 35,863 $ 41,696 $ 107,711 $ Income (loss) per common share: Basic: Continuing operations 0.24 $ 1.34 $ 0.96 $ 4.16 $ Discontinued operations 0.11 (0.43) 0.13 (1.48) Income 0.35 $ 0.91 $ 1.09 $ 2.68 $ Diluted: Continuing operations 0.24 $ 1.31 $ 0.95 $ 3.98 $ Discontinued operations 0.10 (0.41) 0.12 (1.41) Income 0.34 $ 0.90 $ 1.07 $ 2.57 $ Weighted average shares outstanding: Basic 38,577 39,335 38,402 40,132 Diluted 39,169 40,069 39,006 41,941 September 30, Three months ended Nine months ended September 30, Veeco Instruments Inc. and Subsidiaries Condensed Consolidated Statements of Income (In thousands, except per share data) (Unaudited) |
|
|
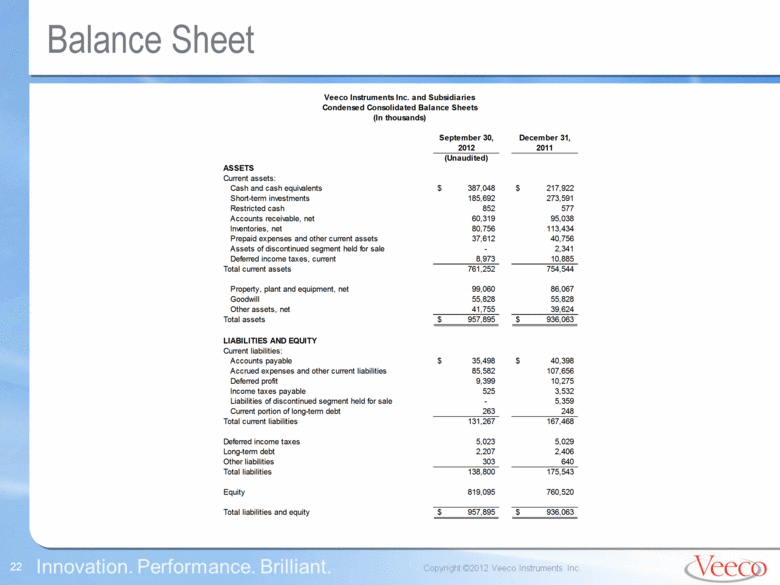
Balance Sheet September 30, December 31, 2012 2011 (Unaudited) ASSETS Current assets: Cash and cash equivalents 387,048 $ 217,922 $ Short-term investments 185,692 273,591 Restricted cash 852 577 Accounts receivable, net 60,319 95,038 Inventories, net 80,756 113,434 Prepaid expenses and other current assets 37,612 40,756 Assets of discontinued segment held for sale - 2,341 Deferred income taxes, current 8,973 10,885 Total current assets 761,252 754,544 Property, plant and equipment, net 99,060 86,067 Goodwill 55,828 55,828 Other assets, net 41,755 39,624 Total assets 957,895 $ 936,063 $ LIABILITIES AND EQUITY Current liabilities: Accounts payable 35,498 $ 40,398 $ Accrued expenses and other current liabilities 85,582 107,656 Deferred profit 9,399 10,275 Income taxes payable 525 3,532 Liabilities of discontinued segment held for sale - 5,359 Current portion of long-term debt 263 248 Total current liabilities 131,267 167,468 Deferred income taxes 5,023 5,029 Long-term debt 2,207 2,406 Other liabilities 303 640 Total liabilities 138,800 175,543 Equity 819,095 760,520 Total liabilities and equity 957,895 $ 936,063 $ Veeco Instruments Inc. and Subsidiaries Condensed Consolidated Balance Sheets (In thousands) |
|
|
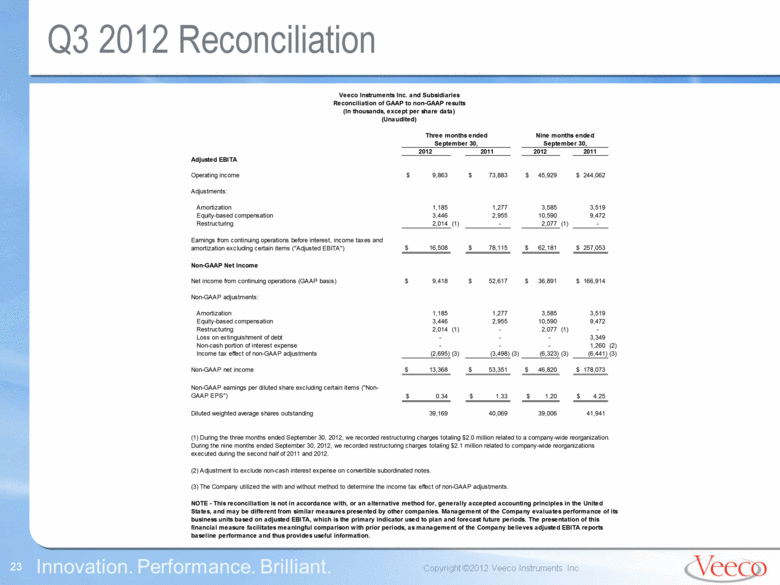
Q3 2012 Reconciliation 2012 2011 2012 2011 Adjusted EBITA Operating income 9,863 $ 73,883 $ 45,929 $ 244,062 $ Adjustments: Amortization 1,185 1,277 3,585 3,519 Equity-based compensation 3,446 2,955 10,590 9,472 Restructuring 2,014 (1) - 2,077 (1) - 16,508 $ 78,115 $ 62,181 $ 257,053 $ Non-GAAP Net Income Net income from continuing operations (GAAP basis) 9,418 $ 52,617 $ 36,891 $ 166,914 $ Non-GAAP adjustments: Amortization 1,185 1,277 3,585 3,519 Equity-based compensation 3,446 2,955 10,590 9,472 Restructuring 2,014 (1) - 2,077 (1) - Loss on extinguishment of debt - - - 3,349 Non-cash portion of interest expense - - - 1,260 (2) Income tax effect of non-GAAP adjustments (2,695) (3) (3,498) (3) (6,323) (3) (6,441) (3) Non-GAAP net income 13,368 $ 53,351 $ 46,820 $ 178,073 $ Non-GAAP earnings per diluted share excluding certain items ("Non- GAAP EPS") 0.34 $ 1.33 $ 1.20 $ 4.25 $ Diluted weighted average shares outstanding 39,169 40,069 39,006 41,941 Veeco Instruments Inc. and Subsidiaries Reconciliation of GAAP to non-GAAP results (In thousands, except per share data) (Unaudited) September 30, September 30, Nine months ended Three months ended (3) The Company utilized the with and without method to determine the income tax effect of non-GAAP adjustments. (2) Adjustment to exclude non-cash interest expense on convertible subordinated notes. NOTE - This reconciliation is not in accordance with, or an alternative method for, generally accepted accounting principles in the United States, and may be different from similar measures presented by other companies. Management of the Company evaluates performance of its business units based on adjusted EBITA, which is the primary indicator used to plan and forecast future periods. The presentation of this financial measure facilitates meaningful comparison with prior periods, as management of the Company believes adjusted EBITA reports baseline performance and thus provides useful information. Earnings from continuing operations before interest, income taxes and amortization excluding certain items ("Adjusted EBITA") (1) During the three months ended September 30, 2012, we recorded restructuring charges totaling $2.0 million related to a company-wide reorganization. During the nine months ended September 30, 2012, we recorded restructuring charges totaling $2.1 million related to company-wide reorganizations executed during the second half of 2011 and 2012. |
|
|
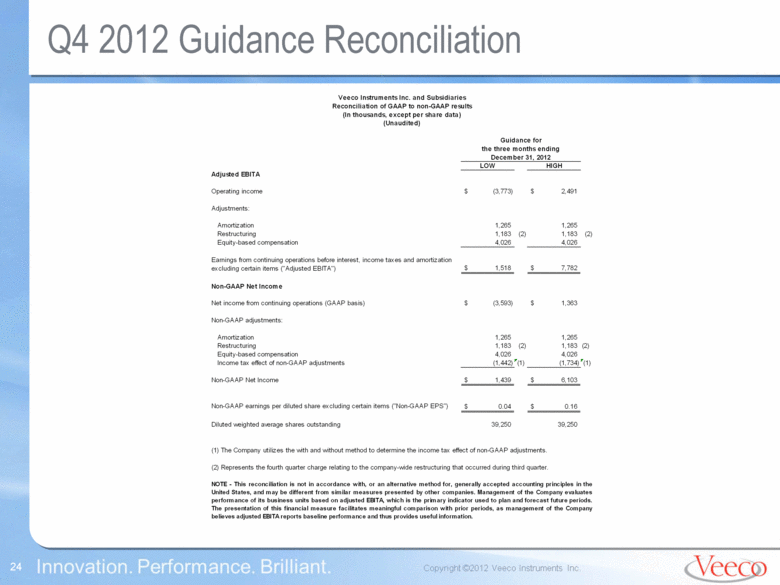
Q4 2012 Guidance Reconciliation LOW HIGH Adjusted EBITA Operating income (3,773) $ 2,491 $ Adjustments: Amortization 1,265 1,265 Restructuring 1,183 (2) 1,183 (2) Equity-based compensation 4,026 4,026 1,518 $ 7,782 $ Non-GAAP Net Income Net income from continuing operations (GAAP basis) (3,593) $ 1,363 $ Non-GAAP adjustments: Amortization 1,265 1,265 Restructuring 1,183 (2) 1,183 (2) Equity-based compensation 4,026 4,026 Income tax effect of non-GAAP adjustments (1,442) (1) (1,734) (1) Non-GAAP Net Income 1,439 $ 6,103 $ Non-GAAP earnings per diluted share excluding certain items ("Non-GAAP EPS") 0.04 $ 0.16 $ Diluted weighted average shares outstanding 39,250 39,250 (1) The Company utilizes the with and without method to determine the income tax effect of non-GAAP adjustments. (2) Represents the fourth quarter charge relating to the company-wide restructuring that occurred during third quarter. NOTE - This reconciliation is not in accordance with, or an alternative method for, generally accepted accounting principles in the United States, and may be different from similar measures presented by other companies. Management of the Company evaluates performance of its business units based on adjusted EBITA, which is the primary indicator used to plan and forecast future periods. The presentation of this financial measure facilitates meaningful comparison with prior periods, as management of the Company believes adjusted EBITA reports baseline performance and thus provides useful information. Earnings from continuing operations before interest, income taxes and amortization excluding certain items ("Adjusted EBITA") Veeco Instruments Inc. and Subsidiaries Reconciliation of GAAP to non-GAAP results (In thousands, except per share data) (Unaudited) Guidance for the three months ending December 31, 2012 |
|
|
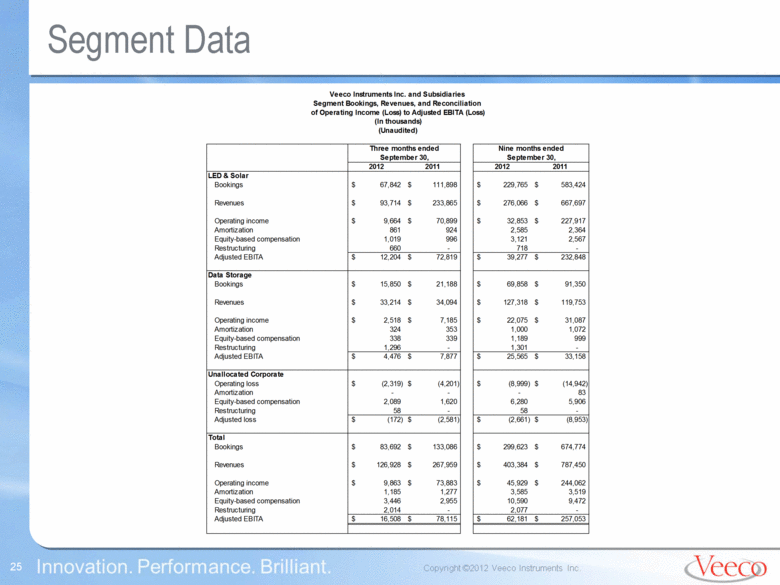
Segment Data 2012 2011 2012 2011 LED & Solar Bookings 67,842 $ 111,898 $ 229,765 $ 583,424 $ Revenues 93,714 $ 233,865 $ 276,066 $ 667,697 $ Operating income 9,664 $ 70,899 $ 32,853 $ 227,917 $ Amortization 861 924 2,585 2,364 Equity-based compensation 1,019 996 3,121 2,567 Restructuring 660 - 718 - Adjusted EBITA 12,204 $ 72,819 $ 39,277 $ 232,848 $ Data Storage Bookings 15,850 $ 21,188 $ 69,858 $ 91,350 $ Revenues 33,214 $ 34,094 $ 127,318 $ 119,753 $ Operating income 2,518 $ 7,185 $ 22,075 $ 31,087 $ Amortization 324 353 1,000 1,072 Equity-based compensation 338 339 1,189 999 Restructuring 1,296 - 1,301 - Adjusted EBITA 4,476 $ 7,877 $ 25,565 $ 33,158 $ Unallocated Corporate Operating loss (2,319) $ (4,201) $ (8,999) $ (14,942) $ Amortization - - - 83 Equity-based compensation 2,089 1,620 6,280 5,906 Restructuring 58 - 58 - Adjusted loss (172) $ (2,581) $ (2,661) $ (8,953) $ Total Bookings 83,692 $ 133,086 $ 299,623 $ 674,774 $ Revenues 126,928 $ 267,959 $ 403,384 $ 787,450 $ Operating income 9,863 $ 73,883 $ 45,929 $ 244,062 $ Amortization 1,185 1,277 3,585 3,519 Equity-based compensation 3,446 2,955 10,590 9,472 Restructuring 2,014 - 2,077 - Adjusted EBITA 16,508 $ 78,115 $ 62,181 $ 257,053 $ September 30, September 30, Veeco Instruments Inc. and Subsidiaries Segment Bookings, Revenues, and Reconciliation of Operating Income (Loss) to Adjusted EBITA (Loss) (In thousands) (Unaudited) Three months ended Nine months ended |

