Attached files
| file | filename |
|---|---|
| 8-K - POLARIS INDUSTRIES INC. 8-K - Polaris Inc. | a50445551.htm |
| EX-99.1 - EXHIBIT 99.1 - Polaris Inc. | a50445551ex99_1.htm |
Exhibit 99.2
POLARIS INDUSTRIES INC. Third Quarter 2012 Earnings Results October 18, 2012
Safe Harbor Except for historical information contained herein, the matters set forth in this document, including but not limited to management’s expectations regarding 2012 and 2013 sales, shipments, net income, cash flow, and manufacturing realignment transition costs and savings, are forward-looking statements that involve certain risks and uncertainties that could materially forward statements cause actual results to differ from those forward-looking statements. Potential risks and uncertainties include such factors as product offerings, promotional activities and pricing strategies by competitors; manufacturing realignment transition costs; acquisition integration costs; warranty expenses; impact of changes in Polaris stock prices on incentive compensation; foreign currency exchange rate fluctuations; environmental and product safety regulatory activity; effects of weather; commodity costs; uninsured product liability claims; uncertainty in the retail and wholesale credit markets; changes in tax policy and overall economic conditions, including inflation, consumer confidence and spending and relationships with dealers and suppliers. Investors are also directed to consider other risks and uncertainties discussed in our 2011 annual report and Form 10-K filed by the Company with the Securities and Exchange Commission. The Company does not undertake any duty to any person to provide updates to its forward-looking statements. The data source for retail sales figures included in this presentation is registration information provided by Polaris dealers in North America and compiled by the Company or Company estimates. The Company must rely on information that its dealers supply concerning retail sales, and other retail sales data sources and this information is subject to revision. Q3-2012 2
Scott Wine, CEO POLARIS INDUSTRIES INC. Third Quarter 2012 Earnings Results October 18, 2012
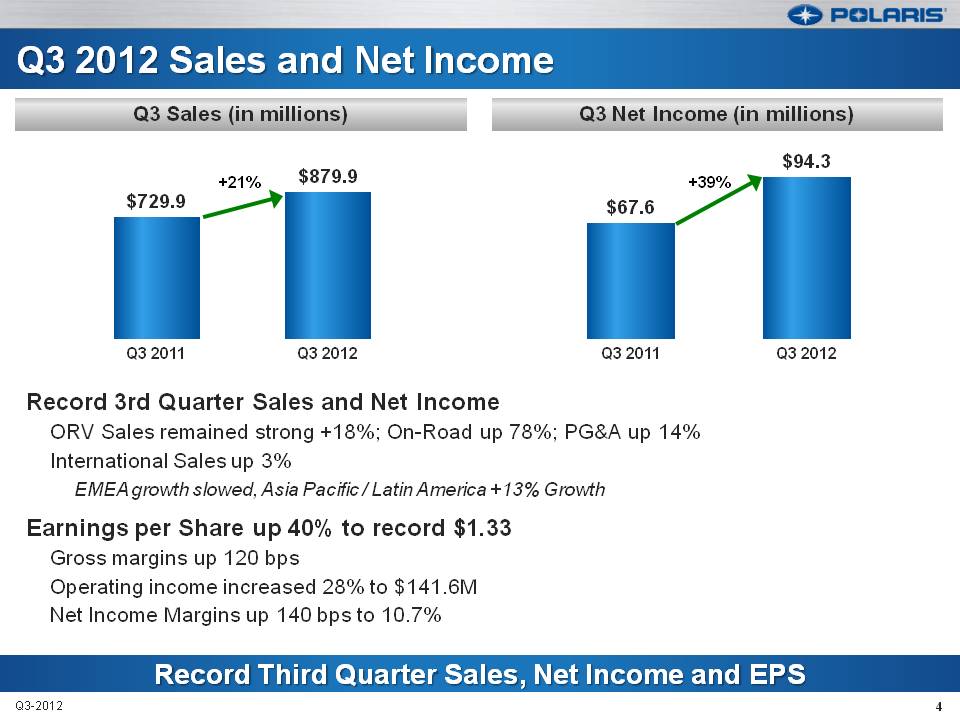
Q3 2012 Sales and Net Income Q3 Sales (in millions) Q3 Net Income (in millions) $729.9 +21% $879.9 Q3 2011 Q3 2012 $67.6 +39% $94.3 Q3 2011 Q3 2012 Record 3rd Quarter Sales and Net Income ORV Sales remained strong +18%; On-Road up 78%; PG&A up 14% International Sales up 3% EMEA growth slowed, Asia Pacific / Latin America +13% Growth Earnings per Share up 40% to record $1.33 Gross margins up 120 bps Operating income increased 28% to $141.6M Net Income Margins up 140 bps to 10.7% Record Third Quarter Sales, Net Income and EPS Q3-2012 4
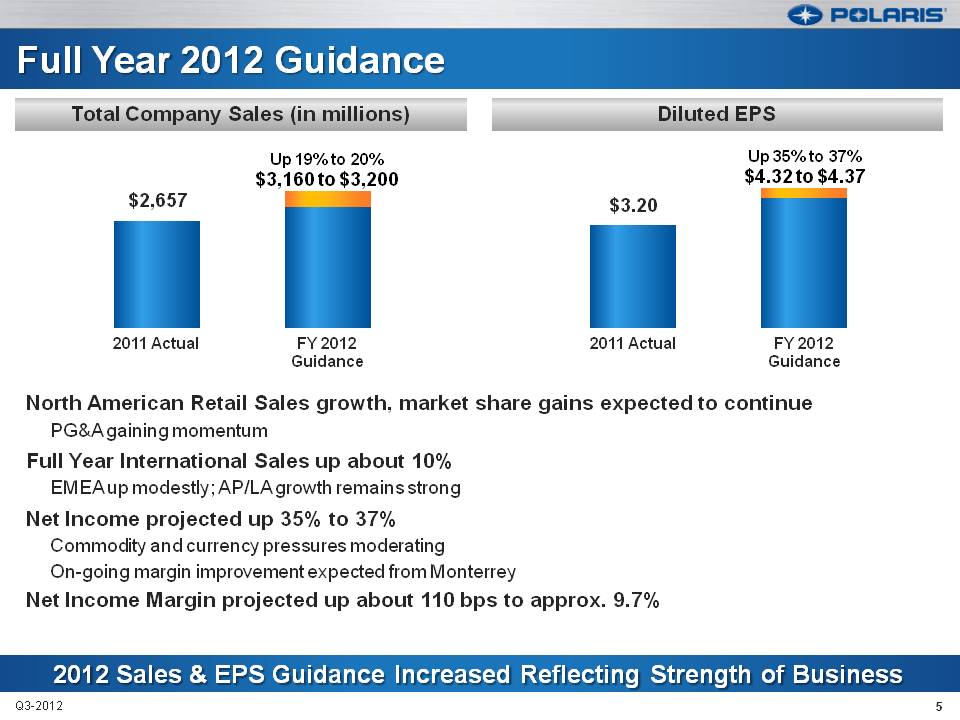
Full Year 2012 Guidance Total Company Sales (in millions) Diluted EPS $2,657 2011 Actual Up 19% to 20% $3,160 to $3,200 FY 2012 Guidance $3.20 2011 Actual Up 35% to 37% $4.32 to $4.37 FY 2012 Guidance North American Retail Sales growth, market share gains expected to continue PG&A gaining momentum Full Year International Sales up about 10% EMEA up modestly; AP/LA growth remains strong Net Income projected up 35% to 37% Commodity and currency pressures moderating On-going margin improvement expected from Monterrey Net Income Margin projected up about 110 bps to approx. 9.7% 2012 Sales & EPS Guidance Increased Reflecting Strength of Business Q3-2012 5
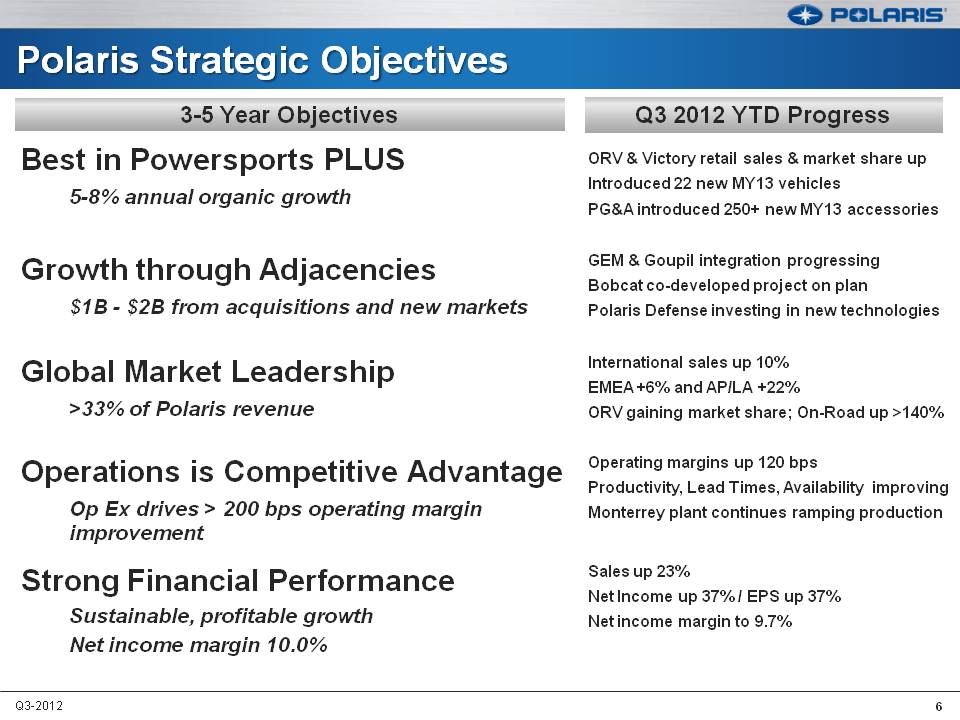
Polaris Strategic Objectives 3-5 Year Objectives Q3 2012 YTD Progress Best in Powersports PLUS 5-8% annual organic growth ORV & Victory retail sales & market share up Introduced 22 new MY13 vehicles PG&A introduced 250+ new MY13 accessories Growth through Adjacencies $1B - $2B from acquisitions and new markets GEM & Goupil integration progressing Bobcat co-developed project on plan Polaris Defense investing in new technologies Global Market Leadership >33% of Polaris revenue International sales up 10% EMEA +6% and AP/LA +22% ORV gaining market share; On-Road up >140% Operations is Competitive Advantage Op Ex drives > 200 bps operating margin improvement Operating margins up 120 bps Productivity, Lead Times, Availability improving Monterrey plant continues ramping production Strong Financial Performance Sustainable, profitable growth Net income margin 10.0% Sales up 23% Net Income up 37% / EPS up 37% Net income margin to 9.7% Q3-2012 6
Bennett Morgan President & COO POLARIS INDUSTRIES INC. Third Quarter 2012 Earnings Results October 18, 2012
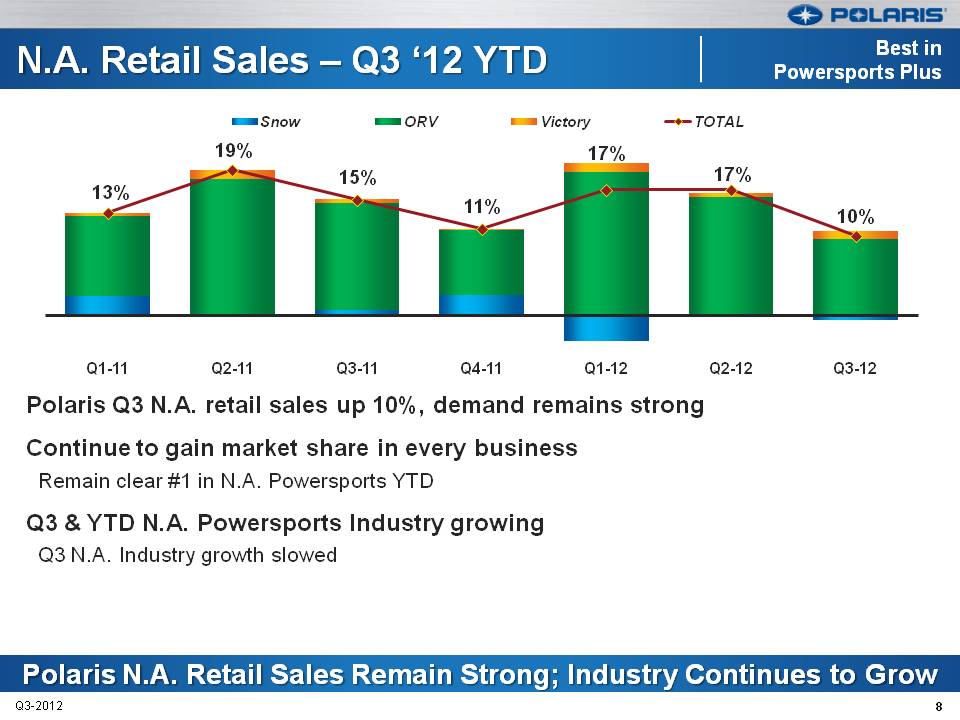
N.A. Retail Sales – Q3 ‘12 YTD Best in Powersports Plus Snow ORV Victory TOTAL 13% 19% 15% 11% 17% 17% 10% Q1-11 Q2-11 Q3-11 Q4-11 Q1-12 Q2-12 Q3-12 Polaris Q3 N.A. retail sales up 10%, demand remains strong Continue to gain market share in every business Remain clear #1 in N.A. Powersports YTD Q3 & YTD N.A. Powersports Industry growing Q3 N.A. Industry growth slowed Polaris N.A. Retail Sales Remain Strong; Industry Continues to Grow Q3-2012 8
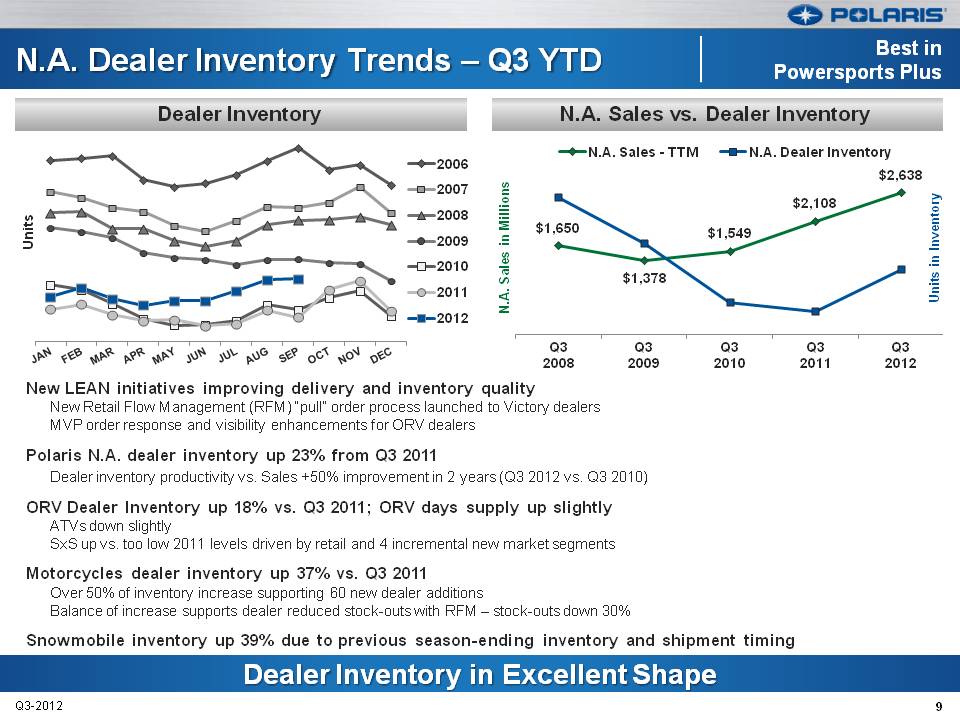
N.A. Dealer Inventory Trends – Q3 YTD Best in Powersports Plus Dealer Inventory N.A. Sales vs. Dealer Inventory Units 2006 2007 2008 2009 2010 2011 2012 JAN FEB MAR APR MAY JUN JUL AUG SEP OCT NOV DEC N.A. Sales - TTM N.A. Dealer Inventory N.A. Sales in Millions Units in Inventory $1,650 $1,378 $1,549 $2,108 $2,638 Q3 2008 Q3 2009 Q3 2010 Q3 2011 Q3 2012 New LEAN initiatives improving delivery and inventory quality New Retail Flow Management (RFM) “pull” order process launched to Victory dealers MVP order response and visibility enhancements for ORV dealers Polaris N.A. dealer inventory up 23% from Q3 2011 Dealer inventory productivity vs. Sales +50% improvement in 2 years (Q3 2012 vs. Q3 2010) ORV Dealer Inventory up 18% vs. Q3 2011; ORV days supply up slightly ATVs down slightly SxS up vs. too low 2011 levels driven by retail and 4 incremental new market segments Motorcycles dealer inventory up 37% vs. Q3 2011 Over 50% of inventory increase supporting 60 new dealer additions Balance of increase supports dealer reduced stock-outs with RFM – stock-outs down 30% Snowmobile inventory up 39% due to previous season-ending inventory and shipment timing Dealer Inventory in Excellent Shape Q3-2012 9
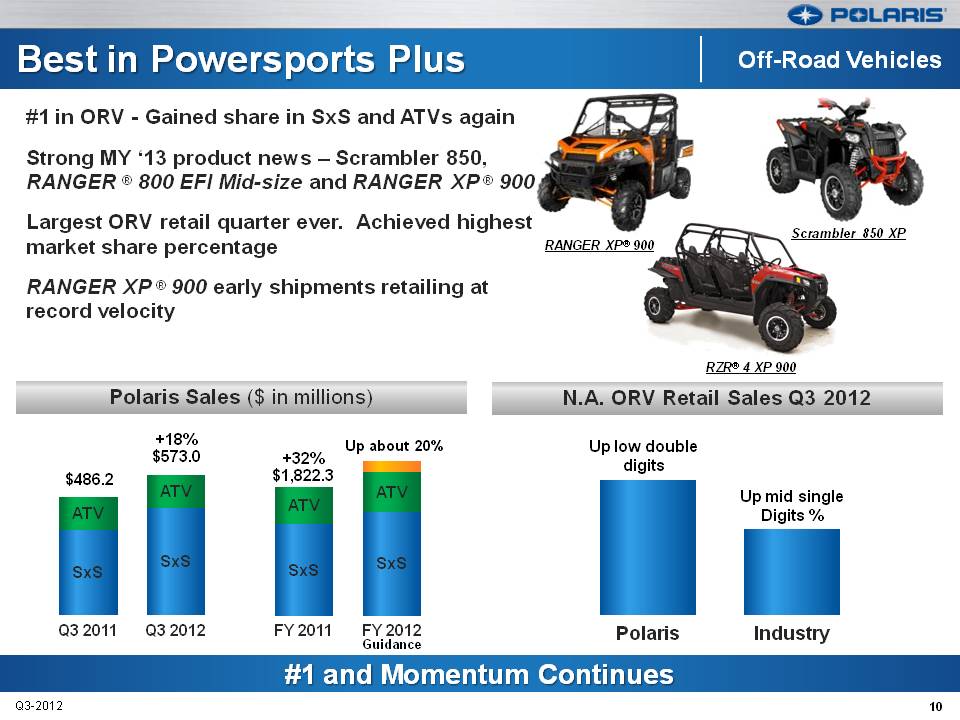
Best in Powersports Plus Off-Road Vehicles #1 in ORV - Gained share in SxS and ATVs again Strong MY ‘13 product news – Scrambler 850, RANGER ® 800 EFI Mid-size and RANGER XP® 900 Largest ORV retail quarter ever. Achieved highest market share percentage RANGER XP® 900 early shipments retailing at record velocity RANGER XP® 900 Scrambler 850 XP RZR® 4 XP 900 Polaris Sales ($ in millions) N.A. ORV Retail Sales Q3 2012 $486.2 +18% $573.0 +32% $1,822.3 Up about 20% ATV ATV ATV ATV SxS SxS SxS SxS Q3 2011 Q3 2012 FY 2011 FY 2012 Guidance Up low double digits Up mid single Digits % Polaris Industry #1 and Momentum Continues Q3-2012 10
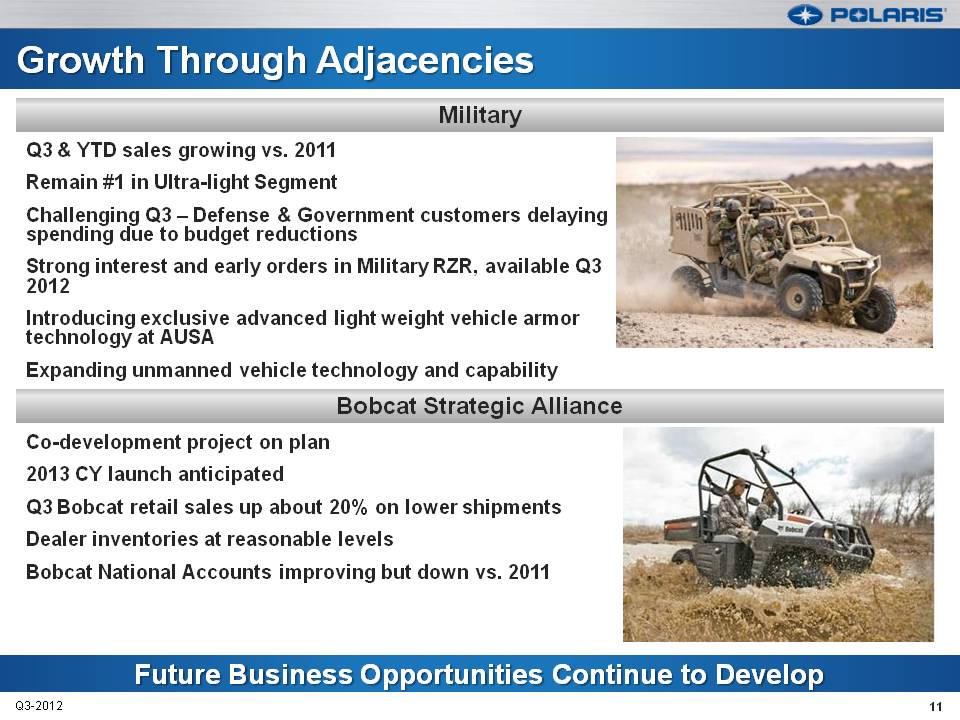
Growth Through Adjacencies Military Q3 & YTD sales growing vs. 2011 Remain #1 in Ultra-light Segment Challenging Q3 – Defense & Government customers delaying spending due to budget reductions Strong interest and early orders in Military RZR, available Q3 2012 Introducing exclusive advanced light weight vehicle armor technology at AUSA Expanding unmanned vehicle technology and capability Bobcat Strategic Alliance Co-development project on plan 2013 CY launch anticipated Q3 Bobcat retail sales up about 20% on lower shipments Dealer inventories at reasonable levels Bobcat National Accounts improving but down vs. 2011 Future Business Opportunities Continue to Develop Q3-2012 11
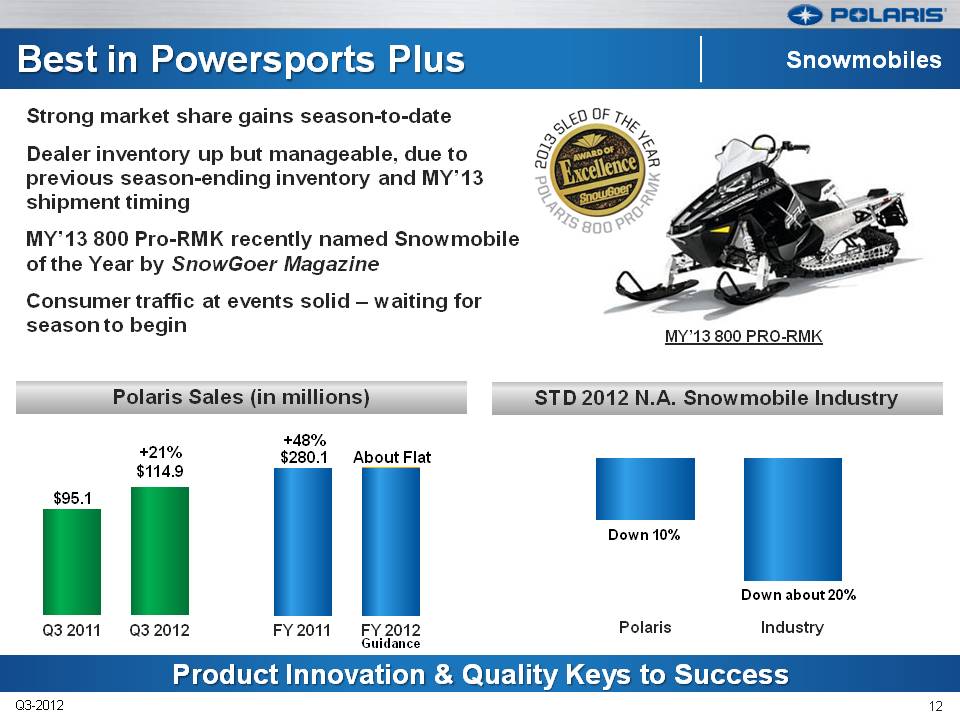
Best in Powersports Plus Snowmobiles Strong market share gains season-to-date Dealer inventory up but manageable, due to previous season-ending inventory and MY’13 shipment timing MY’13 800 Pro-RMK recently named Snowmobile of the Year by SnowGoer Magazine Consumer traffic at events solid – waiting for season to begin MY’13 800 PRO-RMK Polaris Sales (in millions) STD 2012 N.A. Snowmobile Industry $95.1 +21% $114.9 +48% $280.1 About Flat Q3 2011 Q3 2012 FY 2011 FY 2012 Guidance Down 10% Down about 20% Polaris Industry Product Innovation & Quality Keys to Success Q3-2012 12
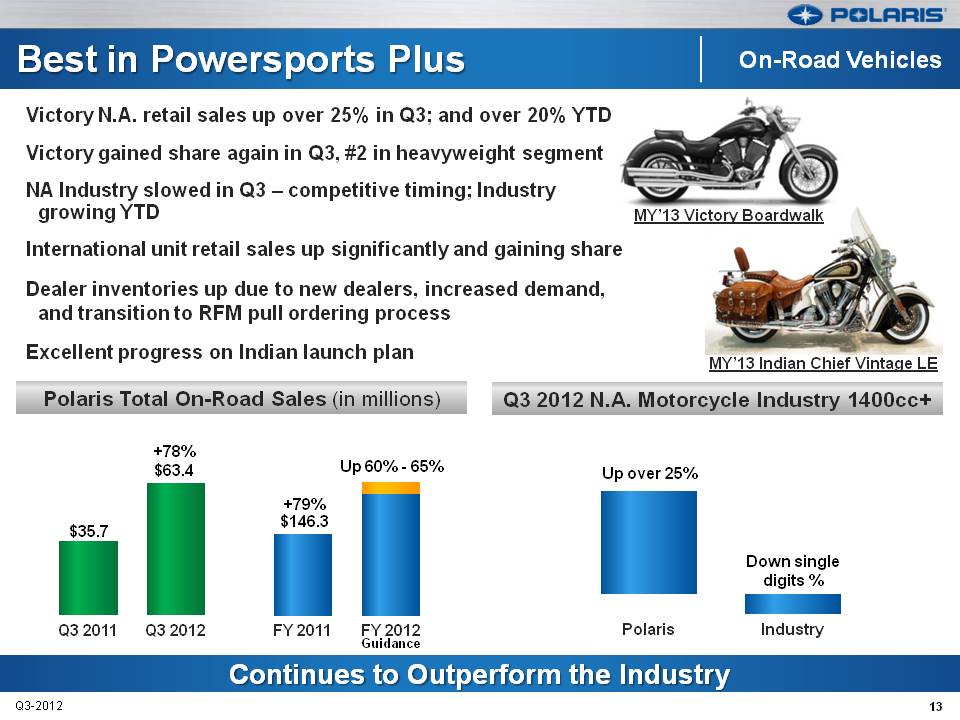
Best in Powersports Plus On-Road Vehicles Victory N.A. retail sales up over 25% in Q3; and over 20% YTD Victory gained share again in Q3, #2 in heavyweight segment NA Industry slowed in Q3 – competitive timing; Industry growing YTD International unit retail sales up significantly and gaining share Dealer inventories up due to new dealers, increased demand, and transition to RFM pull ordering process Excellent progress on Indian launch plan MY’13 Victory Boardwalk MY’13 Indian Chief Vintage LE Polaris Total On-Road Sales (in millions) Q3 2012 N.A. Motorcycle Industry 1400cc+ $35.7 +78% $63.4 +79% $146.3 Up 60% - 65% Q3 2011 Q3 2012 FY 2011 FY 2012 Guidance Up over 25% Down single digits % Polaris Industry Continues to Outperform the Industry Q3-2012 13
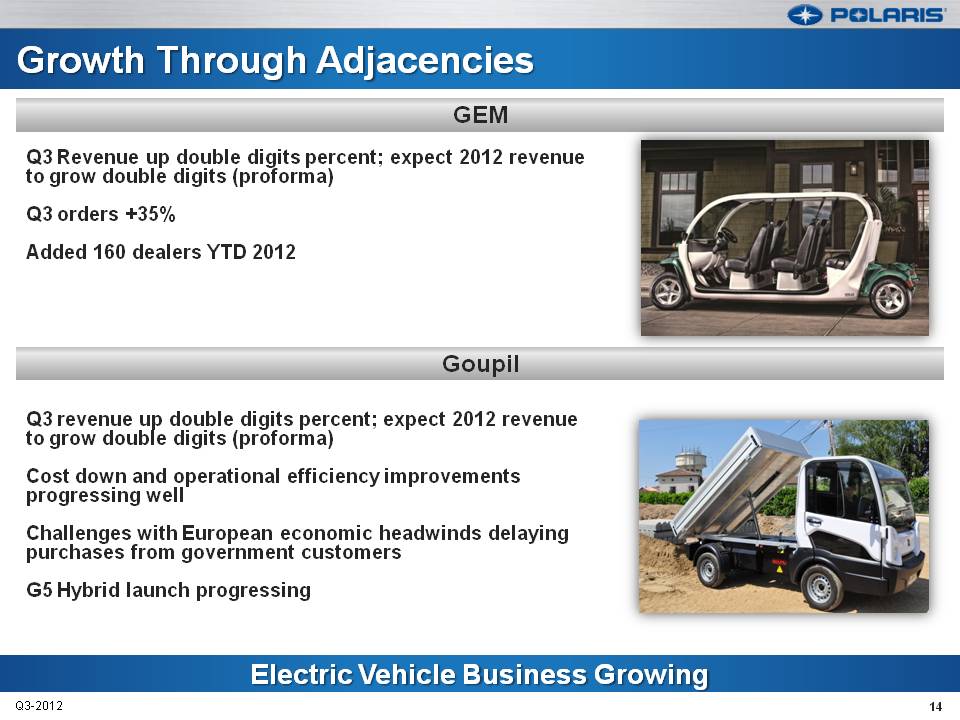
Growth Through Adjacencies GEM Q3 Revenue up double digits percent; expect 2012 revenue to grow double digits (proforma) Q3 orders +35% Added 160 dealers YTD 2012 Goupil Q3 revenue up double digits percent; expect 2012 revenue to grow double digits (proforma) Cost down and operational efficiency improvements progressing well Challenges with European economic headwinds delaying purchases from government customers G5 Hybrid launch progressing Electric Vehicle Business Growing Q3-2012 14
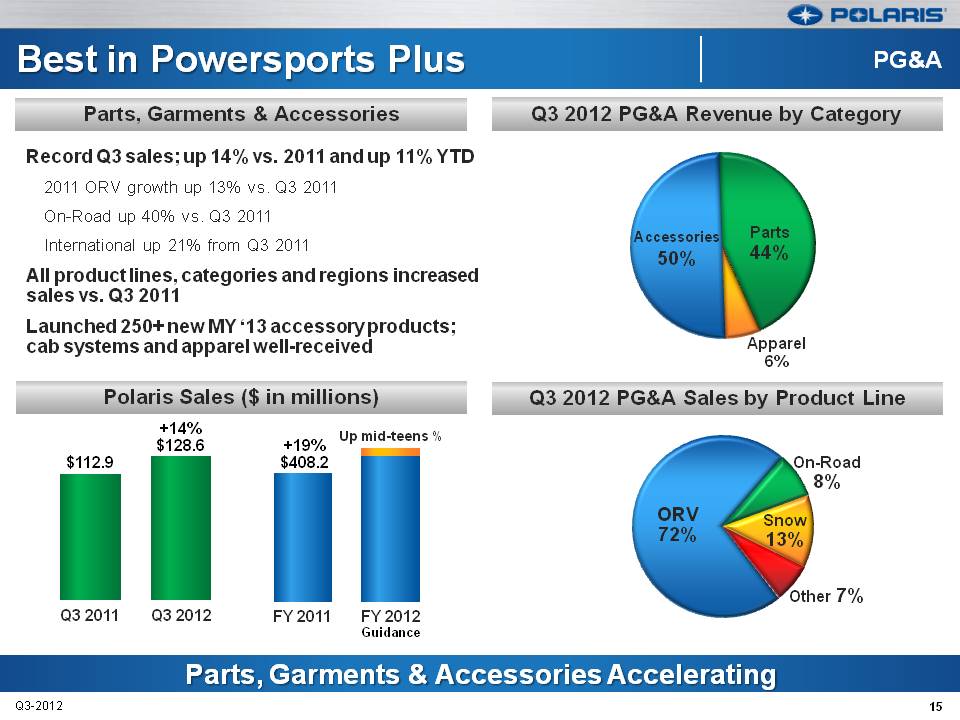
Best in Powersports Plus PG&A Parts, Garments & Accessories Record Q3 sales; up 14% vs. 2011 and up 11% YTD 2011 ORV growth up 13% vs. Q3 2011 On-Road up 40% vs. Q3 2011 International up 21% from Q3 2011 All product lines, categories and regions increased sales vs. Q3 2011 Launched 250+ new MY ‘13 accessory products; cab systems and apparel well-received Q3 2012 PG&A Revenue by Category Accessories 50% Parts 44% Apparel 6% Polaris Sales ($ in millions) $112.9 +14% $128.6 +19% $408.2 Up mid-teens % Q3 2011 Q3 2012 FY 2011 FY 2012 Guidance Q3 2012 PG&A Sales by Product Line ORV 72% Snow 13% On-Road 8% Other 7% Parts, Garments & Accessories Accelerating Q3-2012 15
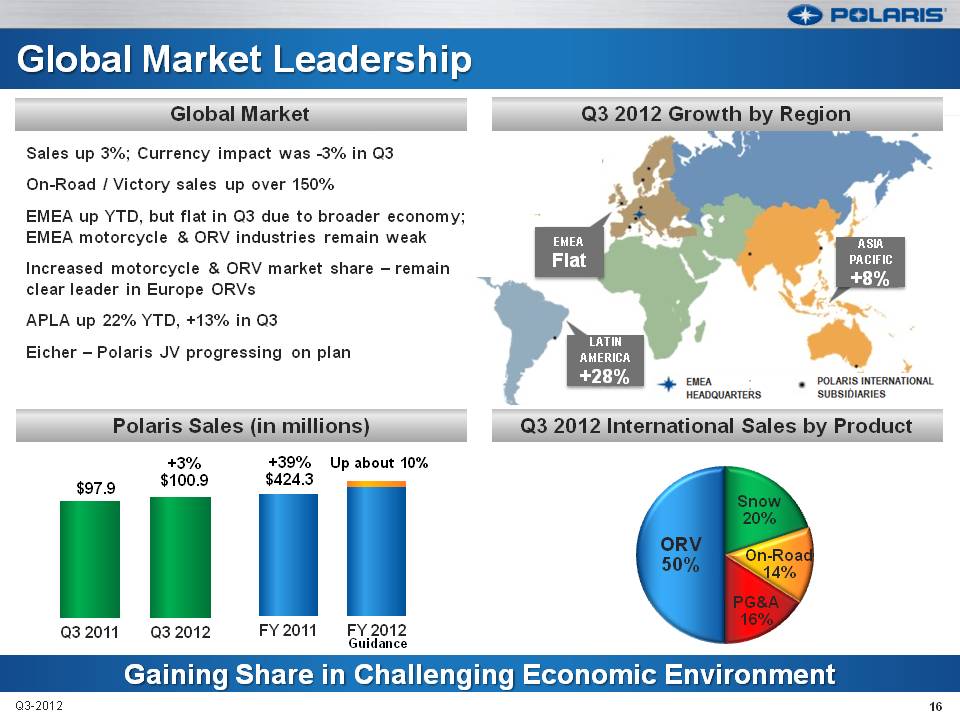
Global Market Leadership Global Market Sales up 3%; Currency impact was -3% in Q3 On-Road / Victory sales up over 150% EMEA up YTD, but flat in Q3 due to broader economy; EMEA motorcycle & ORV industries remain weak Increased motorcycle & ORV market share – remain clear leader in Europe ORVs APLA up 22% YTD, +13% in Q3 Eicher – Polaris JV progressing on plan Q3 2012 Growth by Region EMEA Flat ASIA PACIFIC +8% LATIN AMERICA +28% EMEA HEADQUARTERS POLARIS INTERNATIONAL SUBSIDIARIES Polaris Sales (in millions) $97.9 +3% $100.9 +39% $424.3 Up about 10% Q3 2011 Q3 2012 FY 2011 FY 2012 Guidance Q3 2012 International Sales by Product ORV 50% Snow 20% On-Road 14% PG&A 16% Gaining Share in Challenging Economic Environment Q3-2012 16
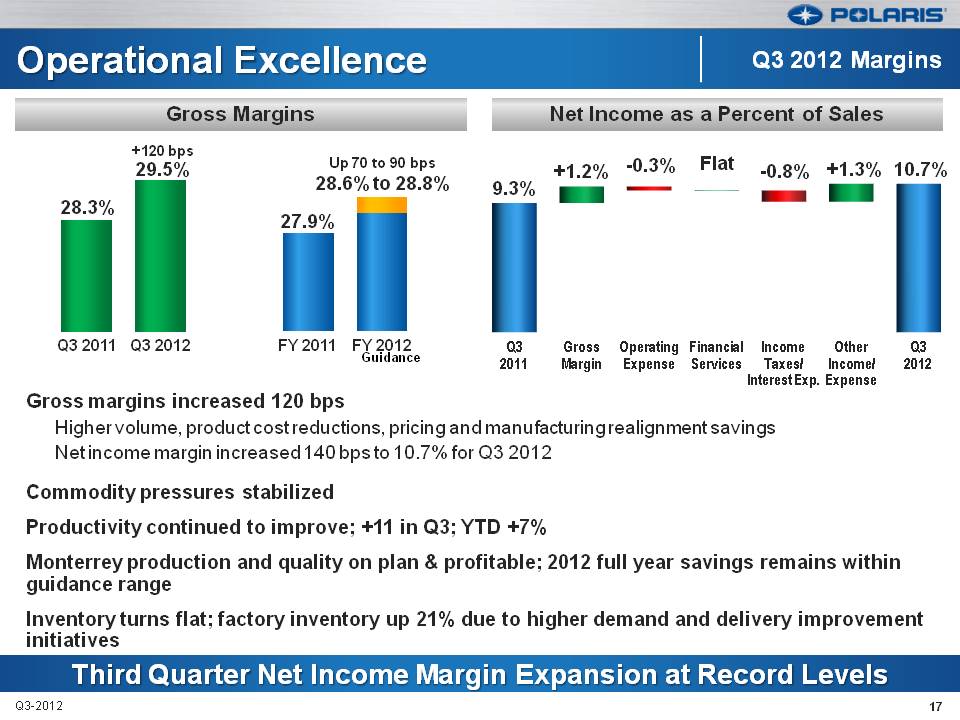
Operational Excellence Q3 2012 Margins Gross Margins 28.3% +120 bps 29.5% 27.9% Up 70 to 90 bps 28.6% to 28.8% Q3 2011 Q3 2012 FY 2011 FY 2012 Guidance Net Income as a Percent of Sales 9.3% +1.2% -0.3% Flat -0.8% +1.3% 10.7% Q3 2011 Gross Margin Operating Expense Financial Services Income Taxes/Interest Exp. Other Income/Expense Q3 2012 Gross margins increased 120 bps Higher volume, product cost reductions, pricing and manufacturing realignment savings Net income margin increased 140 bps to 10.7% for Q3 2012 Commodity pressures stabilized Productivity continued to improve; +11 in Q3; YTD +7% Monterrey production and quality on plan & profitable; 2012 full year savings remains within guidance range Inventory turns flat; factory inventory up 21% due to higher demand and delivery improvement initiatives Third Quarter Net Income Margin Expansion at Record Levels Q3-2012 17
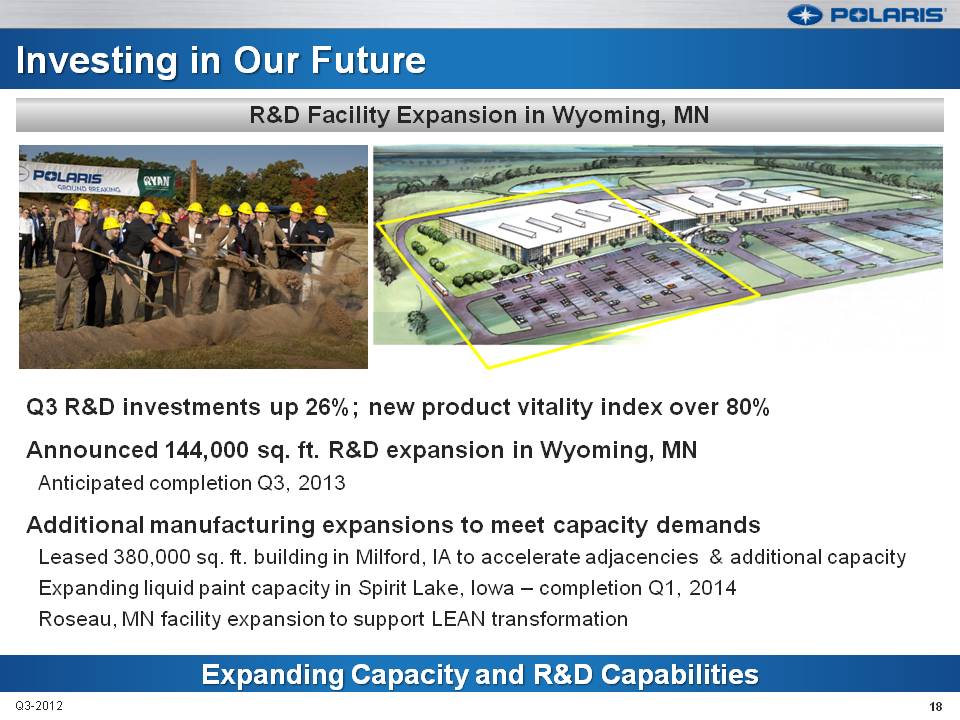
Investing in Our Future R&D Facility Expansion in Wyoming, MN Q3 R&D investments up 26%; new product vitality index over 80% Announced 144,000 sq. ft. R&D expansion in Wyoming, MN Anticipated completion Q3, 2013 Additional manufacturing expansions to meet capacity demands Leased 380,000 sq. ft. building in Milford, IA to accelerate adjacencies & additional capacity Expanding liquid paint capacity in Spirit Lake, Iowa – completion Q1, 2014 Roseau, MN facility expansion to support LEAN transformation Expanding Capacity and R&D Capabilities Q3-2012 18
Mike Malone V.P. Finance & CFO POLARIS INDUSTRIES INC. Third Quarter 2012 Earnings Results October 18, 2012
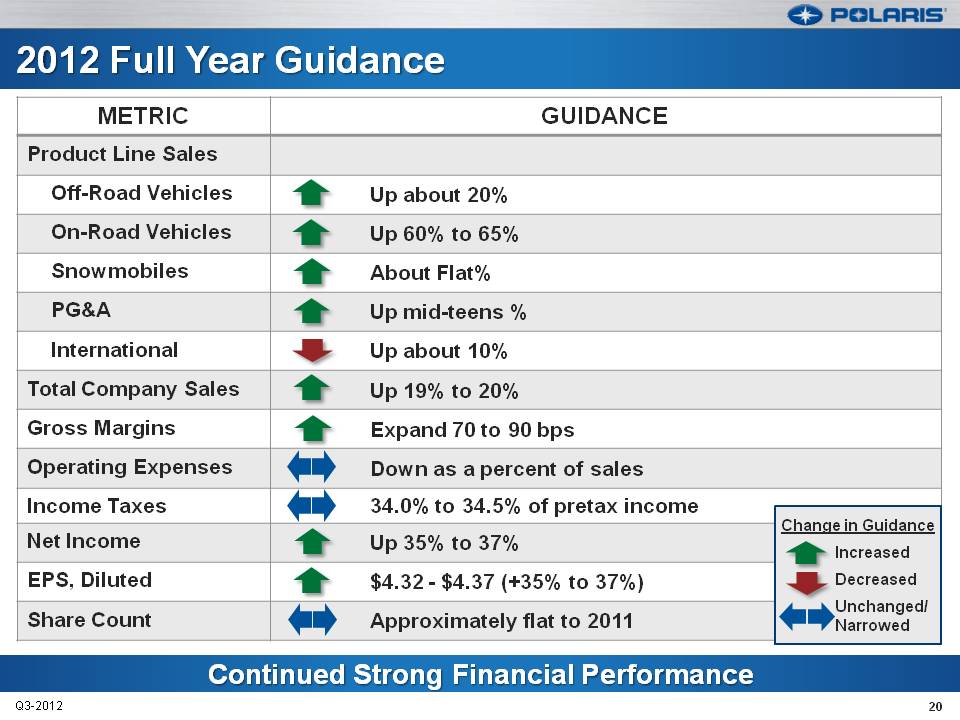
2012 Full Year Guidance METRIC GUIDANCE Product Line Sales Off-Road Vehicles Up about 20% On-Road Vehicles Up 60% to 65% Snowmobiles About Flat% PG&A Up mid-teens % International Up about 10% Total Company Sales Up 19% to 20% Gross Margins Expand 70 to 90 bps Operating Expenses Down as a percent of sales Income Taxes 34.0% to 34.5% of pretax income Net Income Up 35% to 37% EPS, Diluted $4.32 - $4.37 (+35% to 37%) Share Count Approximately flat to 2011 Change in Guidance Increased Decreased Unchanged/ Narrowed Continued Strong Financial Performance Q3-2012 20
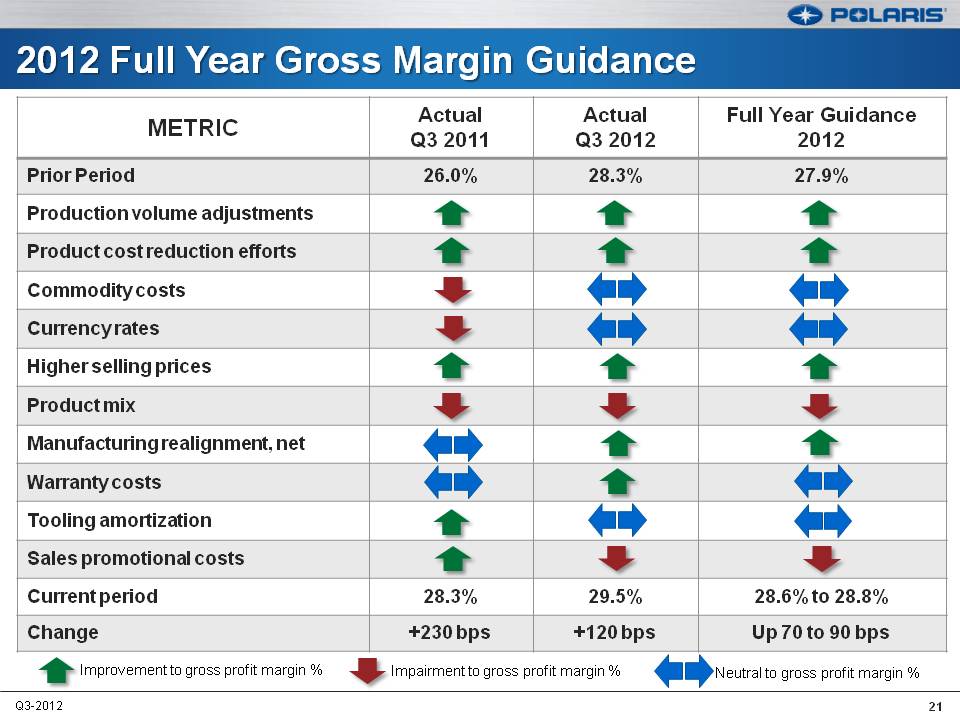
2012 Full Year Gross Margin Guidance METRIC Actual Q3 2011 Actual Q3 2012 Full Year Guidance 2012 Prior Period 26.0% 28.3% 27.9% Production volume adjustments Product cost reduction efforts Commodity costs Currency rates Higher selling prices Product mix Manufacturing realignment, net Warranty costs Tooling amortization Sales promotional costs Current period 28.3% 29.5% 28.6% to 28.8% Change +230 bps +120 bps Up 70 to 90 bps Improvement to gross profit margin % Impairment to gross profit margin % Neutral to gross profit margin % Q3-2012 21
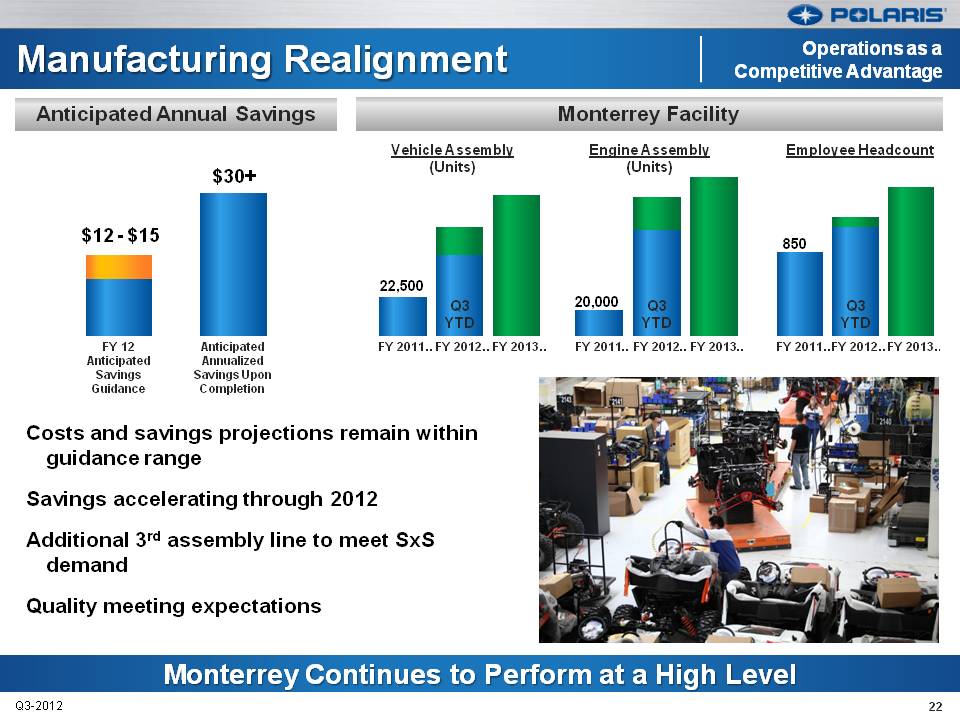
Manufacturing Realignment Operations as a Competitive Advantage Anticipated Annual Savings $12 - $15 $30+ FY 12 Anticipated Savings Guidance Anticipated Annualized Savings Upon Completion Monterrey Facility Vehicle Assembly (Units) Engine Assembly (Units) Employee Headcount 22,500 Q3 YTD FY 2011…FY 2012…FY 2013… 20,000 Q3 YTD FY 2011…FY 2012…FY 2013… 850 Q3 YTD FY 2011…FY 2012…FY 2013… Costs and savings projections remain within guidance range Savings accelerating through 2012 Additional 3rd assembly line to meet SxS demand Quality meeting expectations Monterrey Continues to Perform at a High Level Q3-2012 22
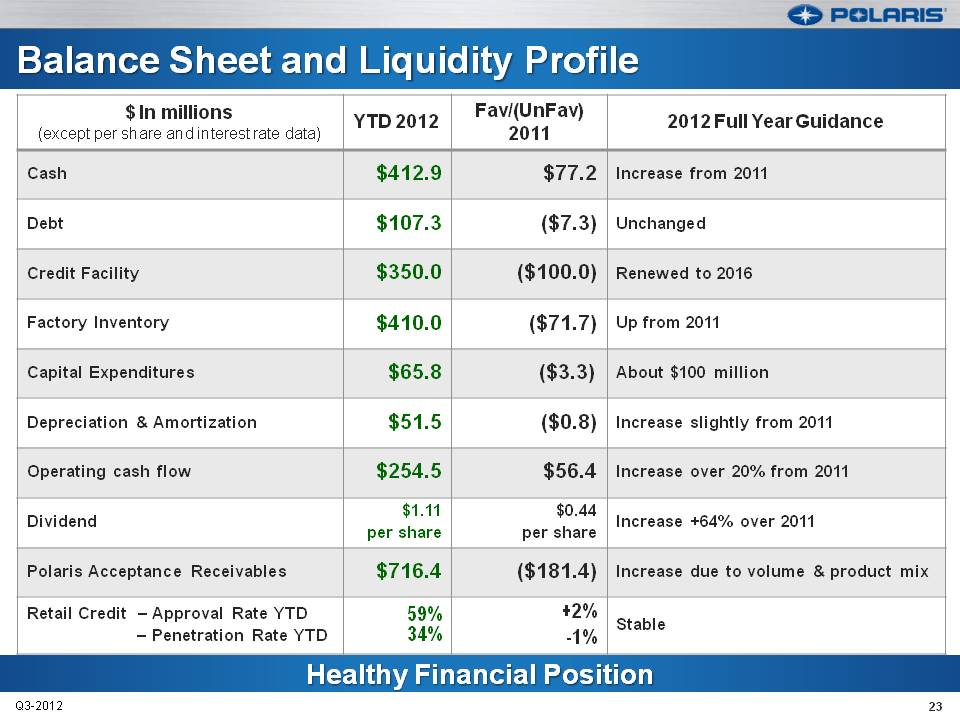
Balance Sheet and Liquidity Profile $ In millions (except per share and interest rate data) YTD 2012 Fav/(UnFav) 2011 2012 Full Year Guidance Cash $412.9 $77.2 Increase from 2011 Debt $107.3 ($7.3) Unchanged Credit Facility $350.0 ($100.0) Renewed to 2016 Factory Inventory $410.0 ($71.7) Up from 2011 Capital Expenditures $65.8 ($3.3) About $100 million Depreciation & Amortization $51.5 ($0.8) Increase slightly from 2011 Operating cash flow $254.5 $56.4 Increase over 20% from 2011 Dividend $1.11 per share $0.44 per share Increase +64% over 2011 Polaris Acceptance Receivables $716.4 ($181.4) Increase due to volume & product mix Retail Credit – Approval Rate YTD 59% +2% – Penetration Rate YTD 34% -1% Stable Healthy Financial Position Q3-2012 23

Scott Wine, CEO POLARIS INDUSTRIES INC. Third Quarter 2012 Earnings Results October 18, 2012
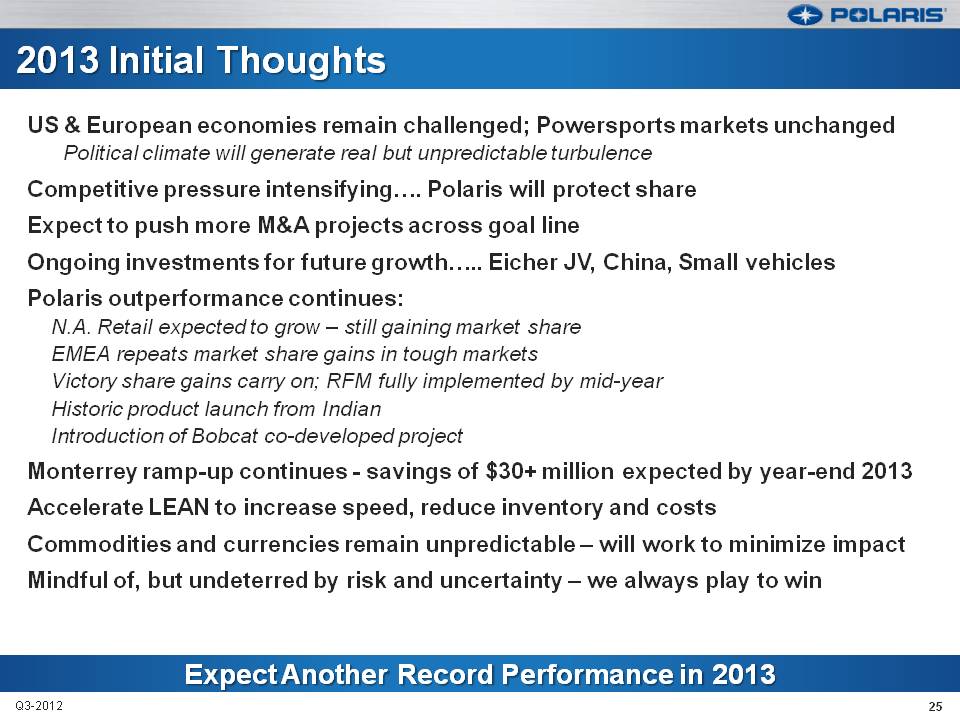
2013 Initial Thoughts US & European economies remain challenged; Powersports markets unchanged Political climate will generate real but unpredictable turbulence Competitive pressure intensifying…. Polaris will protect share Expect to push more M&A projects across goal line Ongoing investments for future growth….. Eicher JV, China, Small vehicles Polaris outperformance continues: N.A. Retail expected to grow – still gaining market share EMEA repeats market share gains in tough markets Victory share gains carry on; RFM fully implemented by mid-year Historic product launch from Indian Introduction of Bobcat co-developed project Monterrey ramp-up continues - savings of $30+ million expected by year-end 2013 Accelerate LEAN to increase speed, reduce inventory and costs Commodities and currencies remain unpredictable – will work to minimize impact Mindful of, but undeterred by risk and uncertainty – we always play to win Expect Another Record Performance in 2013 Q3-2012 25
Thank you Q&A Q3-2012 26