Attached files
| file | filename |
|---|---|
| 8-K - FORM 8-K - Chaparral Energy, Inc. | d420650d8k.htm |
 Chaparral Energy
October, 2012
Chaparral Energy
October, 2012
Exhibit 99.1 |
 2
2
This presentation contains "forward-looking statements" within the meaning of
Section 27A of the Securities Act of 1933, as amended, and Section 21E of the Securities
Exchange Act of 1934, as amended. These forward-looking statements are subject
to certain risks, trends and uncertainties that could cause actual results to differ materially
from those projected. Among those risks, trends and uncertainties are our ability to find
oil and natural gas reserves that are economically recoverable, the volatility of oil and
natural gas prices and significantly depressed natural gas prices since the middle of
2008, the uncertain economic conditions in the United States and globally, the decline in
the values of our properties that have resulted in and may in the future result in additional ceiling
test write-downs, our ability to replace reserves and sustain production, our estimate of
the sufficiency of our existing capital sources, our ability to raise additional capital
to fund cash requirements for future operations, the uncertainties involved in prospect
development and property acquisitions or dispositions and in projecting future rates of
production or future reserves, the timing of development expenditures and drilling of wells, hurricanes and
other natural disasters, including the impact of the oil spill in the Gulf of Mexico on our
present and future operations, the impact of government regulation, and the operating
hazards attendant to the oil and natural gas business. In particular, careful
consideration should be given to cautionary statements made in the various reports we have
filed with the Securities and Exchange Commission. We undertake no duty to update or revise these
forward-looking statements. |
 Company Representative
Joe Evans
Chief Financial Officer
& Executive Vice President
3
3 |
 Chaparral Overview
Founded in 1988, Based in Oklahoma City
Core areas —
Mid-Continent (Oklahoma) and Permian Basin (W. Texas)
Oil-weighted producer (64% oil; 36% gas); R/P ratio 18 years
Second largest oil producer in Oklahoma
Stable 1P base with large potential upside –
742 MMBoe
Near-term growth potential through drilling in
conventional &
emerging plays ~ 450,000 acres Long-term growth through CO
2
EOR –
74 fields
1
As of 12/31/11 using SEC methodology
Company Statistics
Q2, 2012
Production (Boe/d)
~23,300
Proved Reserves (MMBoe)¹
156.3
Proved Reserves PV-10 ($mm)¹
$2,309
TTM EBITDA ($mm)
$305
4
4 |
 5
5
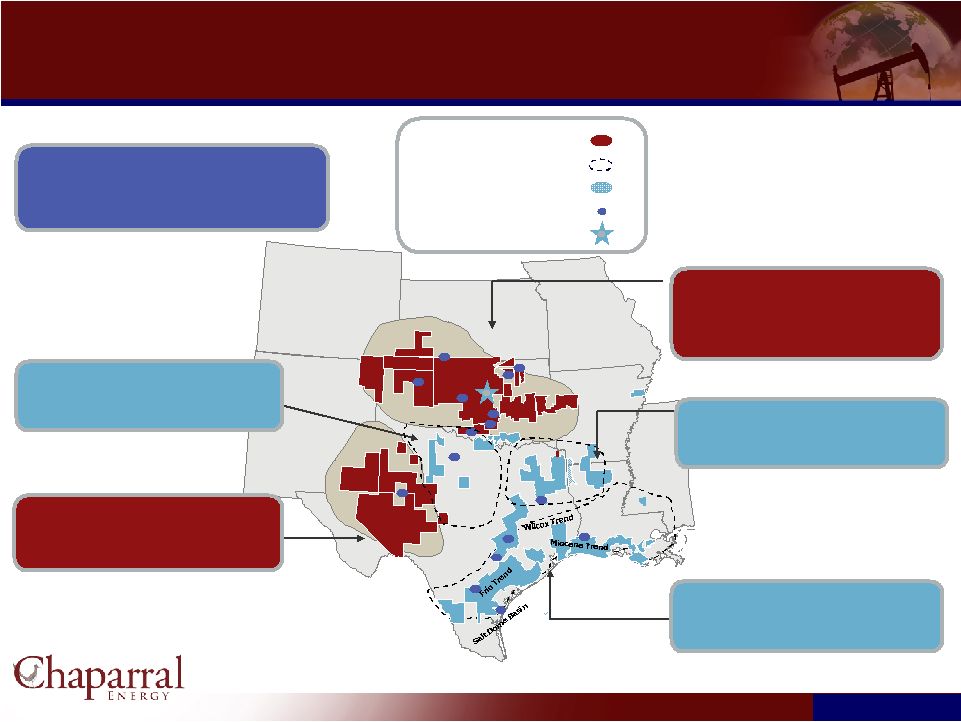
Operating Areas
Operating Areas
As of December 31, 2011 (SEC)
Core Area
Growth Area
Acreage
Field Offices
Headquarters
North Texas
Reserves: 3.9 MMBoe, 3% of total
Production: 0.5 Mboe/d, 2% of total
Permian Basin
Reserves: 19.3 MMBoe, 12% of total
Production: 3.6 MBoe/d, 15% of total
Company Total
December 2011 proved reserves –
156.3 MMBoe
2011 average daily production –
23.7
MBoe/d
Acreage (gross / net): 1,178,489 / 590,324
Val Verde
Basin
Sabine
Uplift
Midland
Basin
Delaware
Basin
Ouachita
Uplift
Arkoma
Basin
Fort
Worth
Basin
Anadarko
Woodford
Basin
OKC
Gulf Coast
Reserves: 3.2 MMBoe, 2% of total
Production: 0.9 MBoe/d, 4% of total
Mid-Continent
(Anadarko Basin & Central Oklahoma)
Reserves: 122.2 MMBoe, 78% of total
Production: 17.0 MBoe/d, 72% of total
Ark-La-Tex
Reserves: 7.2 MMBoe, 5% of total
Production: 1.3 MBoe/d, 6% of total |
 Strong
Record of Reserve and Production Growth Strong Record of Reserve and Production
Growth Year-End SEC Reserves (MMBoe)
(1)
2003 –
2011 CAGR = 15%
Annual Production (MMBoe)
2003 –
2011 CAGR = 16%
Chaparral’s reserve replacement ratio averaged 422% per year since 2003
6
6
Year
Oil
Gas
2007
$96.01
$6.80
2008
$44.60
$5.62
2009
$61.18
$3.87
2010
$79.43
$4.38
2011
$96.19
$4.11
1)
Reserves as of December 31
for each year calculated
using flat SEC
pricing per the following:
6
6 |
 Net
Debt / EBITDA Liquidity ($mm)
Financial Position to Execute Strategy
Financial Position to Execute Strategy
Strong Financial Position
No senior note maturities before 2020
Hedge positions in place to secure cash
flow in near term
Budget CAPEX within free cash flow
(including divestiture proceeds)
$325
$300
$400
7
7
* As of Q2, 2012 |
 Capital Budget ($mm)
Component
2008
2009
2010
2011
2012
Budget
2012
Expanded
Budget
2012
%
Drilling
$168
$76
$196
$172
$131
$201
44%
EOR
24
14
36
86
127
168
37%
Enhancements
53
32
39
32
26
16
3%
Acquisitions
46
18
41
17
15
40
9%
Other (P&E,
Capitalized G&A, etc)
48
14
32
28
31
35
7%
Total
$339
$154
$344
$336
$330
$460
100%
Key Drilling Areas
Northern OK Mississippi
Horizontal
$73
Anadarko Cleveland Sand
46
Anadarko Granite Wash
22
Marmaton
15
Bone Spring / Avalon
10
Hogshooter
7
Other
28
Total
$201
8
8
EOR Field
N. Burbank
$104
Panhandle Area
60
Other
3
Total
$168
*99% of Capital Program is Oil Focused |
 9
9
Resource Potential
Resource Potential |
  10
10
Breakdown By Significant Play
Breakdown By Significant Play
(1) Based on 03/31/12 Preliminary Reserves at SEC Pricing
Play
Net Acreage
Est Drilling
Density
Development
Success
Factor
Risked Net
Undrilled
Wells
Unrisked Net
Undrilled
Wells
Proved
Reserves
Risked
Unproven
Resource
(m acres)
(acres)
(MMBoe)
(MMBoe)
EOR
96
30
200
NOMP -Core
(210 mbo/well)
93
160
65%
378
581
1.9
77
NOMP -Emerging
(160 mbo/well)
167
160
33%
344
1,044
0.5
55
Woodford
(550 mbo/well)
23
80
45%
134
300
2.5
73
Marmaton
(125 mbo/well)
48
160
50%
150
300
0
19
Bone Spring
(320 mbo/well)
19
160
50%
59
119
0
19
Avalon
(260 mbo/well)
19
160
50%
59
119
0
15
Cleveland
(300 mbo/well)
10
160
100%
45
45
5
14
Granite Wash
(300 mbo/well)
10
160
100%
14
14
5
4
Total Drilling
in Key Plays
389
1,184
2,522
15
276
Other
113
107
Total
Resources
485
158
583
Key Drilling Plays
(1) |
 11
11
Conventional
drilling
(IRR:
50%
-
75%)
—
Anadarko Granite Wash
—
Anadarko Cleveland Sand
Unconventional
resource
play
drilling
(IRR:
35%
-
75%)
—
Northern Oklahoma Mississippi Play (“NOMP”): 260,000 net acres
—
Panhandle Marmaton: ~48,000 acres
—
Anadarko Woodford Shale: ~23,000 acres
—
Bone Spring/Avalon Shale: ~19,000 acres
Chaparral owns an inventory of 76 possible candidate
CO2-EOR fields.
—
Proved reserves of 45.1 MMBoe from EOR designated fields as of
12/31/11
—
200+ MMBoe of total potential reserves
CO2
fields exhibit low-risk and stable production.
—
IRR: 25% –
40%
Chaparral is Well Positioned for
Near–Term and Long–Term Growth
Near–Term Growth Drivers
Long–Term Growth Drivers |
 Northern Oklahoma Mississippi Play
The Northern Oklahoma Mississippi Play (“NOMP”) is a
key near–term focus area for Chaparral
Chaparral acreage over 260,000 net acres in the NOMP
Over 132 MMBoe of potential
1,600 unrisked drilling well inventory
Chaparral Acreage
12
12
Overview
NOMP Asset Map
NOMP Well Economics
IP Rates:
100 - 700 Boe/d
EUR:
100 - 400 MBoe
Well Cost:
$2.5 - 4.0 million
% Oil:
60% - 90%
IRR:
35% - 75%
KS
OK |
 CHK –SERENITY 1-3H
IP: 1250 BOPD, 1064 MCFD
20 MONTH CUM: 177 MBO, 125 MMCF
*5 WELLS PER SECTION PROJECT
CHK –ONEIL LAND 1-15H (37.5% WI)
IP_10: 318 BOPD, 1410 MCFD
Northern Oklahoma Mississippi Play
Northern Oklahoma Mississippi Play
Chaparral Dover/Hennessey
Project
Surrounding Mississippi Vertical Production,
Very Low Drainage, Emerging Activity
Net Acres: 15,400 (11,220 Verified)
Net Potential Wells: 87.5 (70.13)
Chaparral Major/Garfield
Project
Surrounding Mississippi Vertical
Production
Net Acres: 12,000 (9,700 Verified)
Net Potential Wells: 59.81 (54.75)
*Currently Leasing*
Chaparral Perry/Polo Project
Surrounding Mississippi Vertical Production
Mississippi/WDFD Horizontal Activity
Net Acres: 7,450 (6,300 Verified)
Net Potential Wells: 46.56 (39.31)
RANGE RESOURCES CHAT PROJECT
IP_9: 122 BOPD, 330 MCFD, 177 BOEPD
SDR–KASPER 1H-2
IP: 341 BOEPD
SANDRIDGE/PANTHER/DEVON MEDFORD PROJECTS
IP_8: 327 BOPD, 1373 MCFD
SDR –KILIAN 1-7H
IP: 750 BOPD, 1014 MCFD
SANDRIDGE GIBBON PROJECT
IP_4: 227 BOPD, 863 MCFD, 371 BOEPD
DEVON PROJECT
MATTHEW 1-33H
IP: 550 BOPD, 500 MCFD
*DVN Leased ~250M Acres
SDR –SPENCER 1-25H
IP: 521 BOEPD
SANDRIDGE RINGWOOD PROJECT
IP_4: 172 BOPD, 775 MCFD, 301 BOEPD
WICKLUND & PLYMOUTH PROJECTS
IP_8: 345 BOPD, 836 MCFD , 484 BOEPD
SDR –CLO 1-16H
IP: 404 BOPD, 2813 MCFD
Chaparral Yellowstone Project
IP_30: 199 BOPD, 566 MCFD, 294 BOEPD
Net Acres: 7,000
Net Potential Wells: 43.8
2 Proposed Addnl 2012
6 Currently Operated Wells
Chaparral Dacoma Project
IP_43: 348 BOPD, 1,896 MCFD, 664 BOEPD
Net Acres: 3,500
Net Potential Wells: 21.9
1 Proposed Producer –1 Proposed SWD 2012
4 Currently Operated Wells
Several Non-Operated
EAGLE ENERGY + CHK DACOMA PROJECTS
IP_43: 348 BOPD, 1896 MCFD, 664 BOEPD
Chaparral Wildhorse
Concession
137,460 Net Acres (Over +340 Sections)
Cutthroat Gap 1H-29, Denoya 1H-5,
Blackdog’s Band, Itsike, Great White Hair,
Big Elk
KS
OK
Vitruvian -Bowling 2-32H
IP: 516 BOPD, 211 MCFD 4053 BWPD
SPYGLASS
IP_8: 212 BOEPD
TERRITORY RESOURCES
RED ROCK PROJECT
IP_5: 351 BOPD, 426 MCFD, 422 BOEPD
SPYGLASS–SOUTH BEND 1A-11H
IP (10-DAY):
696 BOPD, 506 MCFD, 780 BOEPD
EUR: 214 MBOE, 87% OIL
CALYX ENERGY AMI
Wheeler 14-1H
IP: 160 BOPD, 434 MCFD, 232 BOEPD
Spirit Creek 15-1H
IP: 180 BOPD, 177 MCFD, 210 BOEPD
State M 16-2H
IP: 302 BOPD, 588 MCFD, 400 BOEPD
Chaparral Burbank MH Project
Nabhi 1H-22
Salt Creek 1H-10
Scout 1H
New Gulf & Pablo Projects
New Gulf –QUARY 1H
IP: 130 BOPD, 300 MCFD
RF USA –
TAHARA 1-28H
IP: 240 BOPD, 260 MCFD
EAGLE –LONGHURST 3H-34
IP: 2225 BOPD, 4767 MCFD
60 DAYCUM: 106 MBO, 243 MMCF
TERRITORY RESOURCES ACTIVITY
Scouting Report: 250 BOPD
CHESAPEAKE ENERGY ACTIVITY
SLAWSON ACTIVITY
30-Day IP:
733 BOPD, 863 MCFD, 879 BOEPD
CHK -GREENLEE 16H
IP (10 DAY):
353 BOPD, 1318 MCFD, 573 BOEPD
~40% OIL CUT
SANDRIDGE ENID PROJECT
IP_4: 160 BOPD, 776 MCFD, 290 BOEPD
Chaparral Billings-West Prospect
~5,280 Leased
*Currently Leasing*
Chaparral Emerging Area
SANDRIDGE & CHESAPEAKE WAKITA PROJECT
IP_77: 167 BOPD, 890 MCFD
SHELL GULF MEXICO
ALL TIGHT HOLED
Chaparral Core Area
SANDRIDGE COMANCHE CO –MISS EXTENSION (SDT II)
IP_3: 123 BOPD, 625 MCFD, 227 BOEPD (30 DAYS)
SDR –PUFFINBARGER 2-28H
IP_30: 2221 BOPD, 1815 MCFD
43 DAYCUM: 74 MBO, 68 MMCF
Erikson 6H &
7H
Dean 2H-7
Davison
2H-3
Schupbach 1H-
20
Schultz 2H
Philips 2H
Murrow
2H
Ruby
Joachim
Elsie(s)
LeForce
Boyd
Daisy
Shire
BLUE DOLPHIN –SCHOELING 1H
IP: 650 BOPD, 4 MMCFD, 1316 BOEPD
VITRUVIAN/DEVON ACTIVITY
MAVERICK BROS FONDA PROJECT
IP_2: 92 BOPD, 1963 MCFD, 419 BOEPD
(Chaparral Hillsdale
Prospect)
SOURCE ENERGY FANNIE PROJECT
Chaparral Jefferson/Nash
Project
IP_8: 327 BOPD, 1373 MCFD, 556
BOEPD
Net Acres: 5,020
Net Potential Wells: 31.38
1 Proposed Addnl 2012
3 Currently Operated Wells
Several Non-Operated
LONGFELLOW ENERGY ACTIVITY
B&W PROJECT
13
13
NOMP Core Area
Emerging Area
Chaparral Acreage |
 14
14
NOMP: Recent Results
NOMP: Recent Results
Current
Net
Production
–
4,000
Boepd
2012
Capital
-
$73
mm
NOMP Core (93,000 Net Acres)
Significant industry activity in the play
Drilled or participated in 37 wells to date (18 operated); 2 WOCU
1-3 additional wells in 2012
Average IP ~600 Boepd
Current
Net
Production
–
3,375
Boepd
45% Oil
Emerging NOMP (167,000 Net Acres)
In de-risking phase –
industry activity increasing
Drilled 6 wells to date
Average IP ~200+ Boepd
Current
Net
Production
–
625
Boepd
92% Oil |
 Marmaton Shelf Play
Johnston 1H-24
IP +300 Boepd
Leatherman 1H-14
2012 Location
Lamaster 1H-23
2012 Location
Jay 1H-1098
2012 Location
Wright 1H-1099
2012 Location
Marmaton Production
Chaparral Acreage
Net Acreage
48,000
EUR/well (MBoe)
150
Cost per Well (MM$)
$3.6
Cornell 1H-30
2012 Location
Buy Area
Ochiltree Co, Tx
15
15 |
 16
16
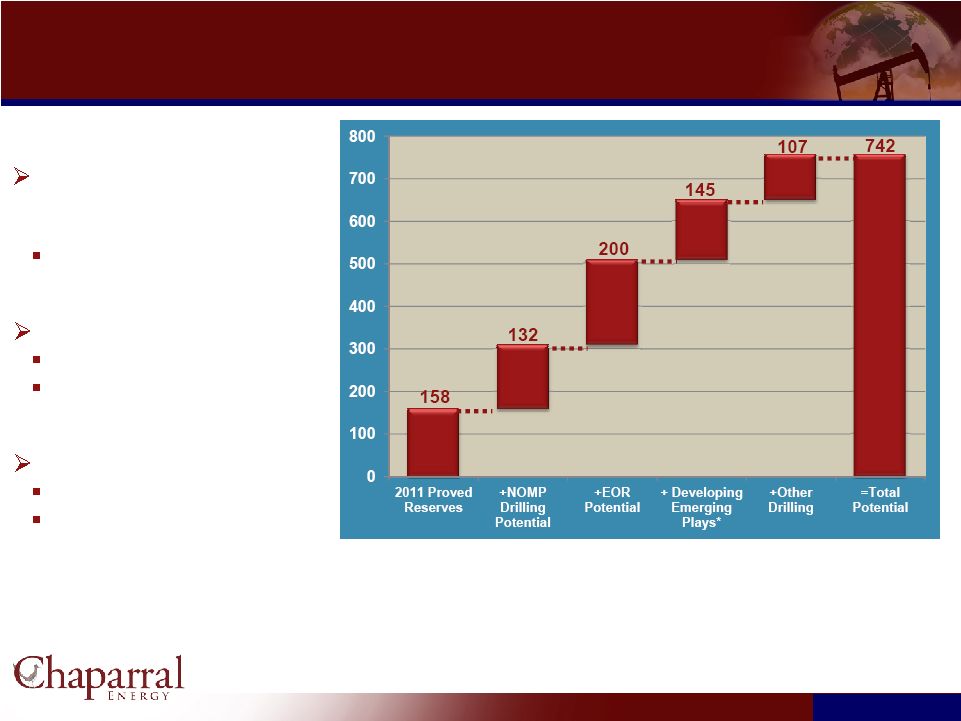
Potential in Excess of 740 MMBoe
Potential in Excess of 740 MMBoe
Near-term + Long-term
strategy yields significant
value increase
~ 70% Oil
Near-term focus on NOMP
De-risk play, unlock value
Production growth
Long-term focus on EOR
Low-risk production upside
Long-life, stable production
* Woodford, Bone Spring, Avalon, Cleveland Sand, Granite
Wash, and Marmaton
(1) |
 17
17
Chaparral:
Chaparral:
A Growing Mid-Continent
CO
2
EOR Company
A Growing Mid-Continent
CO
2
EOR Company |
 CO
2
EOR Focused Areas
CO
2
EOR Focused Areas
18
18
CO
2
Project Inventory
74
units
with
1P,
2P
&
3P
EOR
reserves
9 units with proved reserves
9 units with CO
2
injection
CO
2
Infrastructure –
473 Miles
318 miles of active line
68 miles under construction
87 miles of inactive line
CO
2
Supply
47
MMscf/D
of
existing
CO
2
supply
43 MMscf/D new CO
2
supply
CO2 Tertiary Recovery Projects
Panhandle Area
Permian Basin
Central
Oklahoma
Area
Burbank
Area |
 19
19
Currently Owned CO
2
Development Potential and
Infrastructure
Currently Owned CO
2
Development Potential and
Infrastructure |
 EOR
2012 Capital Budget (1)
EOR 2012 Capital Budget
(1)
20
20
Budget by Category
($mm)
2011
Actual
2012
Budget
2012
Expanded
Budget
Infrastructure / Pipelines
14
90
106
Drilling
17
13
24
Enhancements / CO
2
Purchases
55
24
37
Total
$86
$127
$168
2012 Field Projects ($mm)
Panhandle
Area
Permian
Basin
Central
Oklahoma
Area
Burbank
Area
(1)
Does not include Capitalized G&A |
 Processing Rate: The Key to Improved Rate of
Return
Processing Rate: The Key to Improved Rate of
Return
21
21
5N/13E
2
3
4
5
8
9
10
11
14
15
16
17
20
21
22
23
26
27
28
29
32
33
34
35
WSW
WSW
WSW
WSW
WSW
WSW
WSW
WSW
WSW
WSW
WSW
WSW
3
WHMU
2-33
BEATY
9-3
PUMU
6-3
HMU
6-5
HMU
1
JEFFUS
9-6
PUMU
1-B
BOLLINGER
58
WHMU
2
WHMU
2-M
WITT
1WSW
WHMU
1
C A BLAKE
1
TALBOT
2
JULIAN
2
LANGSTON
1-5
WELSH
1-7
1-8
SHATTUCK
1
WELCH
1
HITCH
2
BLAKE
1
G W FERGUSON
1
D M WILSON
1
HAMSON `A`
1
HISER
1
4-1
HINDS A
1
COPPOCK `A`
1
HISER
1
H L WITT
1
DELONG303
1
PRICE
1
LANDERS
A-1
BOLLINGER
1-31
HOAR3-C
1-32
HAAR
1-33
BEATY
1
JULIAN
1
JEFFREY
2-32
HAAR
1-D
SPARKS
1-A
34-1
HMU
1
HAAR
37-1
HMU
1
TIM GLODEN UNIT
38-1
HMU
40-1
HMU
1
BLAKE
2-23
DIXON
35-2
HMU
3
JEFFUS
39-1
HMU
1
STEINKUEHLER
11-2
HMU
36-2
HMU
24-2
HMU
1-15
WILSON
10-2
HMU
75
WHMU
18-2
HMU
6-13WIW
HMU
82
WHMU
83
WHMU
85
WHMU
38-2
HMU
36-3
HMU
37-2
HMU
24-3
HMU
9-2
HMU
3-L 603W
POSTLE MORROW
901-S
POSTLE MORROW L-3
3-L 403W
POSTLE
3-L 404W
POSTLE MORROW
3-L 704W
POSTLE MORROW
903W
POSTLE MORROW L-3POSTLE MORROW L-3
100W
P U M U 3-L
11-6-G
EPMG
35-3
HMU
35-4
HMU
J
32-3
HMU
22-3
HMU
4-A
HARTMAN
18-3
HMU
21-3
HMU
17-4
HMU
22-4
HMU
7-3
PUMU
7-4
PUMU
105
POSTLE KEYES UNIT
13-2
HMU
98
WHMU
104
WHMU
106
WHMU
6-3
PUMU
10-3
P U M U
10-3A
POSTLE UPPER
5-8
PUMU
2-D
HAAR
7-6
PUMU
7-5
PUMU
15-2
EPMG
9-10
PUMU
14-2
EAST POSTLE
15-3
EPMG
112
WHMU
9-11
PUMU
16#1
KIRBY
7-7
PUMU
8-9
PUMU
5-9Tal
PUMU
24-4
HMU
2
260
WHMU
282
WHMU
36-4
HMU
31-2
HMU
35-5
HMU
201
WHMU
205
WHMU
17-8
HMU
22-5
HMU
21-4
HMU
30-2
HMU
32-4
HMU
207
WHMU
WHMU
301
WHMU
202
WHMU
212
WHMU
206WHMU
WHMU
17-5
HMU
17-6
HMU
19-1
HMU
17-7
HMU
39-2
HMU
6-15
JULIAN
3-A
HARTMAN
6-11
HMU
1-A
BLAKE
6-12
HMU
2-A
WELSH
9-1
HMU
5-2
HMU
60
WHMU
1-P
STATE
19-2
HMU
2 SWD
SPARKS D
2-D
HICKS
2-18
GLODEN
4-A
FINDLAY
31-1C
HMU
301W
POSTLE MORROW
2-1
HMU
2-E
HICKS
13-1
EPMG
2-D
SPARKS
501 W
POSTLE MORROW
2-276
G W FERGUSON UNIT
1-29
4 (275)
BLAKE
9-5
PUMU
7-1
PUMU
7-2
PUMU
SWD 1
JULIAN
6-4
HMU
7-6
HMU
8-7
PUMU
8-8
PUMU
4-1
HMU
6-1
PUMU
5-1
HMU
1-M
G E NELSON A
16-2
HMU
5-1
PUMU
3-M
TALBERT
12-1
HMU
2-M-A
WEEKS
12-3
HMU
4-M
WEEKS-WELCH
14-1
HMU
11-1
HMU
1
MAMIE CLINKINGBEARD
13-1
HMU
5
WHMU
7
WHMU
6
61
WHMU
1-B
JULIAN
1-C
JULIAN
9
JULIAN
6-10
HMU
59
WHMU
2
LOWERY
2
FRANKLIN LUNS
2-A-B
LUNSFORD
24-1
HMU
35-1
HMU
5
WEEKS-WELCH
14-2
HMU
15-1
HMU
18-1
HMU
01-B
GREENE
1-18
GLODEN
11-3
11-4
EPMG(BEATY4B)
10-2
1-D
HAAR
1-E
HAAR
HAAR
1-F
MILLER
3-1
HMU
21-1
HMU
30-B-1
HMU
21-2
HMU
2-B
BOLLINGER
27-1
CAVETT
2-A
CAVETT
33-1
HMU
17-1
HMU
17-2
HMU
17-3
HMU
1-A
FOWKES
401W
POSTLE MORROW
2-B
GLODEN
1-A
HARTMAN
1-D
HICKS
1-C
HINDS
601
POSTLE MORROW L-3
1001S
2-D
HINDS
1-B
HISER
22-2
HMU
1-C
SPARKS
2-C
SPARKS
1-E
SPARKS
32-1
HMU
2-B
STEWART
22-1
HMU
2-B
(BEATY
33-10
14-4
HMU
38-3
HMU_PROPOSED
41-1
HMU_PROPOSED
41-2
HMU_PROPOSED
41-3
HMU_PROPOSED
6-20
Julian_Proposed
8-10
JULIAN
10-4
PUMU
9-12
PUMU
WHMU_PROPO
Hovey Morrow Unit (HMU)
Time
25% hcpv Inj./Yr
10% hcpv Inj./Yr
HMU Model: Processing Rate v. Reserve Recovery
•
CO
2
Injection initiated Sep’07
•
Processing Rates Average 25% hcpv Inj./Yr |
 22
22
North Burbank CO
2
Development
North Burbank CO
2
Development |
 North
Burbank Unit – Overview
North Burbank Unit –
Overview
Chaparral’s
North
Burbank
Unit
is
its
largest
EOR
field
and
plans
to
introduce
CO
2
injection
into
the
North
Burbank Unit in 1Q 2013
Chaparral
anticipates
that
it
will
spend
$800
million
associated
with
this
EOR
project
throughout
the
life
of
the field
23
23
23
23
Total OOIP
1,163 MMBbls
Primary Production
239 MMBbls
Secondary Recovery
211 MMBbls
Tertiary Potential
119 MMBbls
Net Tertiary Potential
100 MMBbls |
 Burbank in Perspective
24
24
110 Years |
 Coffeyville CO
2
System
Coffeyville CO
2
System
25
25
The Coffeyville CO
2
System
$84 million of total capital expenditures
23,500 HP compression facility
68.3-mile 8-inch pipeline with potential
capacity of approximately 60 MMcf/d.
CO
2
is sourced from the CVR Partners
fertilizer plant in Coffeyville, KS.
Online and Operational in January
2013
Oklahoma
Kansas
Coffeyville CO2 System
Asset Map
Panhandle
CO2
System
Coffeyville
CO2
System |
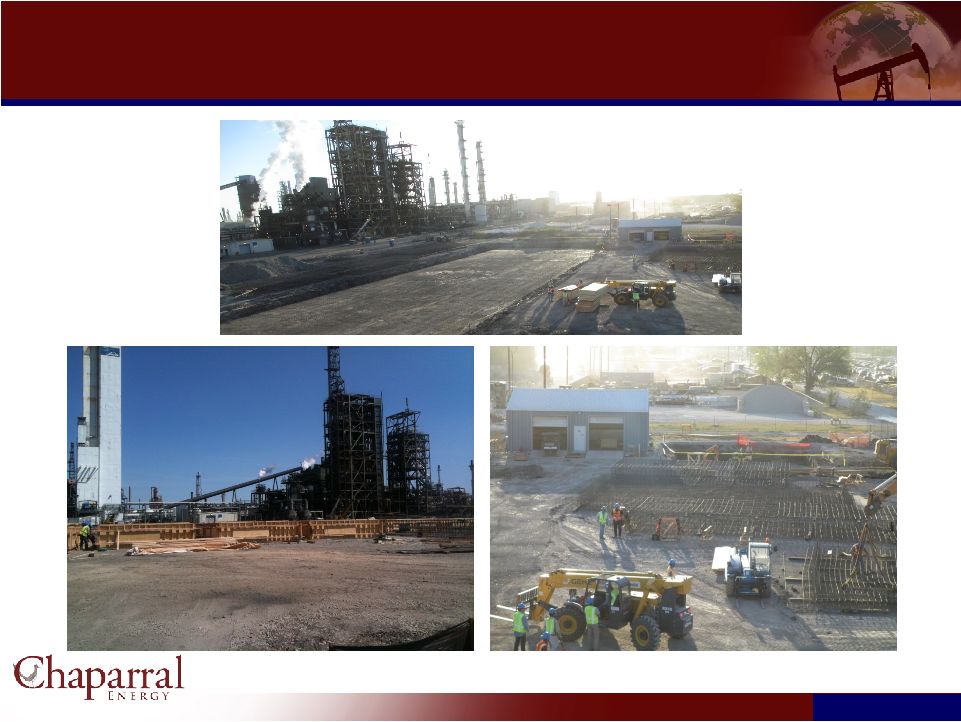
 Coffeyville CO
2
Compression Facility
Coffeyville CO
2
Compression Facility
26
26 |
 Coffeyville CO
2
Facility: Foundation Construction
Coffeyville CO
2
Facility: Foundation Construction
27
27 |
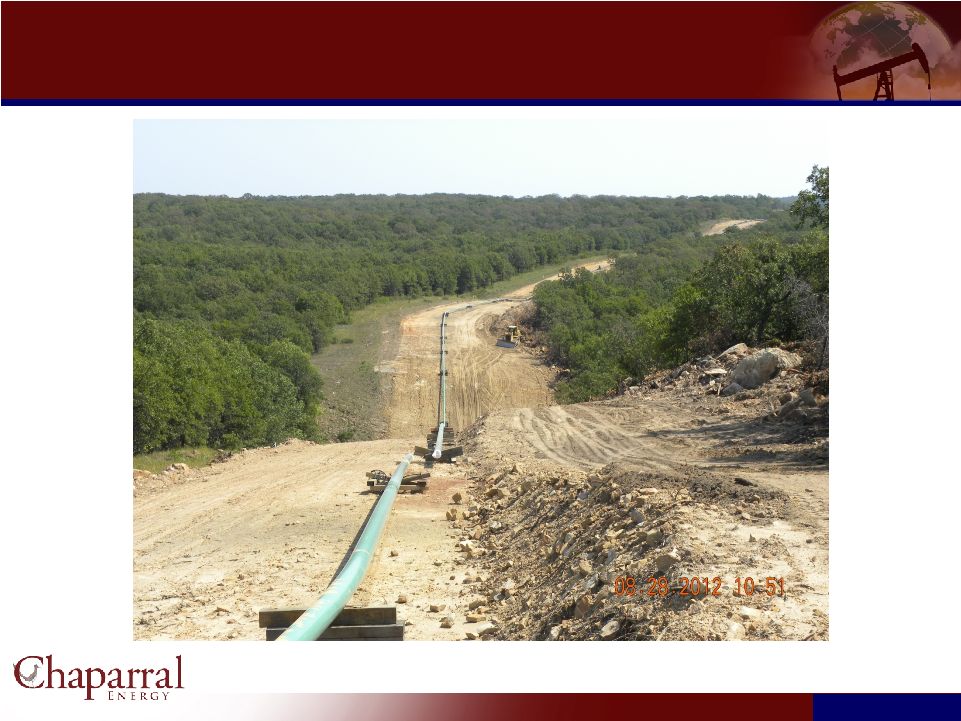
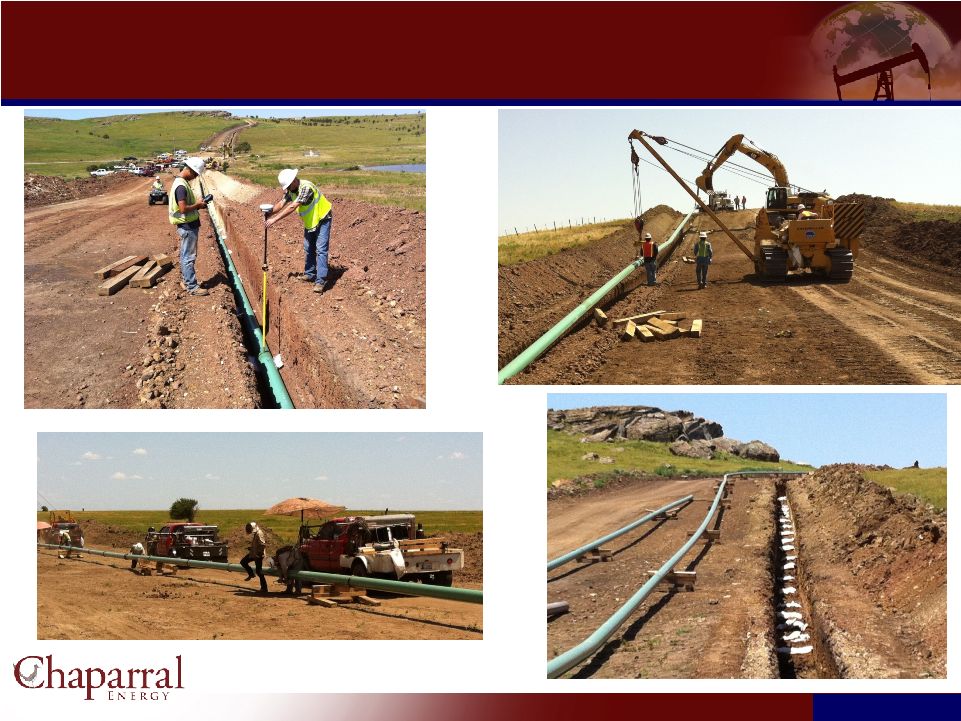 Coffeyville CO
2
Pipeline: Construction
Coffeyville CO
2
Pipeline: Construction
28
28 |
 29
29
Coffeyville CO
2
Pipeline: Construction
Coffeyville CO
2
Pipeline: Construction |
 30
30
Other Recently Installed CO
2
Injection Projects
Other Recently Installed CO
2
Injection Projects |
 Camrick CO
2
–EOR Flood
Camrick CO
2
–EOR Flood
31
31 |
 32
32
North Perryton CO
2
–EOR Flood
North Perryton CO
2
–EOR Flood |
 33
33
Booker Area CO
2
–EOR Flood
Booker Area CO
2
–EOR Flood |
 34
34
Farnsworth Area CO
2
–EOR Flood (West Side Only)
Farnsworth Area CO
2
–EOR Flood (West Side Only) |
 Monthly Incremental EOR
35
35
|
 Financial Overview
36
36 |
 37
37
Financial Summary
Financial Summary
2009
2010
2011
1H 2012
Price
Oil & NGL –
Wellhead ($/Bbl)
$55.04
$74.53
$87.52
$84.12
Gas –
Wellhead ($/Mcf)
$3.51
$4.36
$4.08
$2.21
Production (MMBoe)
7.6
8.1
8.7
4.2
Oil & NGL (MMBbls)
3.9
4.0
5.0
2.6
Gas (Bcf)
22.6
23.7
21.6
9.4
Financial Data ($mm)
Operating Expenses:
Lease Operating Expenses
$94.1
$106.1
$121.4
$63.7
Production and Ad Valorem Taxes
20.3
26.5
34.3
15.5
General and Administrative Expenses (excludes noncash deferred
comp) 22.7
27.3
38.3
23.9
Interest Expense
$90.1
$83.6
$96.7
$48.6
EBITDA
$224
$288
$313
$153
Total Capital Expenditures
$154
$344
$336
$275 |
 Financial Metrics per Boe
Production (Boe) / Day
LOE / Boe
EBITDA / Boe
G&A / Boe
38
38 |
 Operating Statistics
2011 Results
2012
Guidance
Capital Expenditures
$336 million
$460 million
Production
8.7 MMBoe
8.8 -
9.0 MMBoe
General and Administrative
$4.86/Boe
$5.75 -
$6.25/Boe
Lease Operating Expense
$14.03/Boe
$14.25 -
$14.75/Boe
2011 Results and 2012 Guidance
2011 Results and 2012 Guidance
39
39 |
 40
40
Hedge Portfolio
Note:
Dollars
represent
average
strike
price
of
hedges
(includes
all
derivative
instruments)
Gas Basis Hedges
YR
Price
% TP
’12
$
0.23
85%
’13
$
0.20
84%
’14
$
0.23
70%
% of Total Proved Reserves Hedged (as of September 21, 2012)
|
 Question & Answer
41
41 |