Attached files
| file | filename |
|---|---|
| 8-K - FORM 8-K - RETAIL PROPERTIES OF AMERICA, INC. | d419753d8k.htm |
 INVESTOR
PRESENTATION October 2012
Exhibit 99.1 |
 This
presentation
contains
“forward-looking
statements”
within
the
meaning
of
the
safe
harbor
from
civil
liability
provided
for
such
statements
by
the
Private
Securities
Litigation
Reform
Act
of
1995
(set
forth
in
Section
27A
of
the
Securities
Act
of
1933,
as
amended,
or
the
Securities
Act,
and
Section
21E
of
the
Securities
Exchange
Act
of
1934,
as
amended,
or
the
Exchange
Act).
In
particular,
statements
pertaining
to
our
capital
resources,
portfolio
size,
quality
and
performance, dividend policy and results of operations contain forward-looking statements.
Forward-looking statements involve numerous risks and uncertainties and you should not rely on them as predictions of future events.
Forward-looking statements depend on assumptions, data or methods which may be incorrect or
imprecise and we may not be able to realize them. We do not guarantee that the transactions and events described will happen as
described
(or
that
they
will
happen
at
all).
You
can
identify
forward-looking
statements
by
the
use
of
forward-looking
terminology
such
as
“believes,”
“expects,”
“may,”
“should,”
“seeks,”
“intends,”
“plans,”
“pro
forma,”
“estimates,”
“focus,”
“contemplates,”
“aims,”
“continues,”
“would”
or “anticipates”
or the negative of these words and phrases or similar words or phrases. You can also identify
forward-looking statements by discussions of strategies, plans or intentions. The
following factors, among others, could cause actual results and future events to differ materially from those set forth or contemplated in the forward-looking statements:
general
economic,
business
and
financial
conditions,
and
changes
in
our
industry
and
changes
in
the
real
estate
markets
in
particular;
adverse economic and other developments in the Dallas-Fort Worth-Arlington area, where
we have a high concentration of properties; general
volatility
of
the
capital
and
credit
markets
and
the
demand
for
and
market
price
of
our
Class
A
common
stock;
changes in our business strategy;
defaults on, early terminations of or non-renewal of leases by tenants;
bankruptcy or insolvency of a major tenant or a significant number of smaller tenants;
increased interest rates and operating costs;
declining real estate valuations and impairment charges;
availability, terms and deployment of capital;
our failure to obtain necessary outside financing;
our expected leverage;
decreased rental rates or increased vacancy rates;
our
failure
to
generate
sufficient
cash
flows
to
service
our
outstanding
indebtedness;
difficulties in identifying properties to acquire and completing acquisitions;
risks of real estate acquisitions, dispositions and redevelopment, including the cost of
construction delays and cost overruns; our failure to successfully operate
acquired properties and operations; our projected operating results;
our ability to manage our growth effectively;
our failure to successfully redevelop properties;
our
ability
to
successfully
transition
certain
corporate
office
functions
from
related
parties
to
third
parties
or
to
us;
estimates relating to our ability to make distributions to our shareholders in the
future; impact of changes in governmental regulations, tax law and rates and similar
matters; our failure to qualify as a REIT;
future terrorist attacks in the U.S.;
environmental
uncertainties
and
risks
related
to
natural
disasters;
lack or insufficient amounts of insurance;
availability of and our ability to attract and retain qualified personnel;
retention of our senior management team;
our understanding of our competition;
changes in real estate and zoning laws and increases in real property tax rates;
our ability to comply with the laws, rules and regulations applicable to companies; and
other risk factors, including those detailed in the sections of our most recent form 10-K
and form 10-Q filed with the SEC titled “Risk Factors.” You should not
place undue reliance on any forward-looking statements, which are based only on information currently available to us (or to third parties making the forward-looking statements). We undertake no obligation to publicly
release any revisions to such forward-looking statements to reflect events or circumstances
after the date of this presentation, except as required by applicable law. All information
presented as of 6/30/12, unless otherwise noted 2
Disclaimer |
 Large,
diversified, high quality retail portfolio Significant
ability
to
enhance
portfolio
value
through
continued lease-up
Diversified base of value-oriented retail tenants
Capital structure positioned for growth
Opportunity to enhance portfolio and balance sheet through dispositions
of non-core and non-strategic assets
Attractive dividend yield of 5.9%¹
Experienced management team with proven track record
Executing a strategic growth plan to strengthen the Company’s retail
Executing a strategic growth plan to strengthen the Company’s retail
portfolio, improve its balance sheet, and
portfolio, improve its balance sheet, and
streamline its operating platform
streamline its operating platform
1
Based on September 28, 2012 closing price of $11.32 and an annualized dividend of $0.6625 per
share based on second quarter dividend of $0.165625 per share. Each dividend is
determined quarterly by the Company’s Board of Directors, at its discretion
3
Investment Highlights |
 Enhancing
portfolio value. Continuing to grow value through: —
Strong leasing momentum
—
Stabilized cash flows
—
Active asset management focused on risk mitigation and tenant retention
Strengthening balance sheet. Reducing leverage and overall risk profile is a top
priority:
—
Successfully raise capital
—
Execute strategic disposition program
Streamlining operating platform. Further enhance corporate governance:
—
Terminated the majority of our service agreements with The Inland Group
—
Achieved fully independent Board of Directors (excluding an executive
director)
—
Relocating corporate headquarters off The Inland Group campus by
year-end
4
Foundations of Strategic Growth Plan
RPAI is working to deliver enhanced stockholder value and to
position the Company for long-term success |
 Aon lease
renewal —
Active approach to asset management resulted in lease extensions
and prepared the asset for sale
Sold $227 M of assets YTD, most notably:
—
Mervyns 13-asset portfolio for $100 M, with proceeds used to repay the
mortgage debt related to the 23-asset portfolio
—
Cost Plus for $63 M, which reduced our non-core GLA by approximately
25%
Addressed all remaining 2012 debt maturities, as of October 1, 2012
Achieved fully independent Board of Directors (excluding an executive
director), and separation from The Inland Group through service agreement
terminations and headquarters move
Russell 1000 index inclusion in June 2012
5
Execution of strategic initiatives lead to path for growth
Execution of strategic initiatives lead to path for growth
and sustainability
and sustainability
Executing Strategic Initiatives |
 Financial and Operational Goals
89.0%
90.6%¹
94% -
95%
4.1%³
0.7%²
2% at
stabilized occupancy²
Less than 10% secured
debt per year
Goal
2 Quarter 2012
Year End 2008
16%
27%
1
2.2 million square feet of GLA was returned via big box retailer bankruptcies during
2009 2
Annual, year-over-year growth rate
3
Quarterly, year-over-year growth rate
4
Ratio is as of December 31, 2009, the first period for which the metric was reported
7.6x
Reduce Combined Net Debt to
EBITDA to 6.0 –
7.0x
8.9x
4
6
Strong results represent a foundation for growth
Strong results represent a foundation for growth
Drive occupancy
Grow
same store NOI
Reduce leverage
Create staggered
debt maturity profile
Reduce share of non-
core assets (ABR%)
0%
18%
9%
nd |
 Reported 2Q12
Operating FFO of $0.23 per share Reported same store NOI growth of +4.1% YOY
Increased retail portfolio percent leased 230 bps YOY to 91.0% and
increased retail portfolio occupancy 180 bps YOY to 88.1%
Executed 148 new and renewal retail leases for 707,000 square feet of
space
Executed strategic lease renewal with Aon for 819,000 square feet of office
space
Generated positive comparable cash leasing spreads, including pro rata
share of unconsolidated joint ventures, of 7.5% on new leases and 4.3% on
renewal leases, for a blended spread of 5.0%
Strong 2Q12 Financial & Operational
Performance
7
Positive results reflect successful implementation
Positive results reflect successful implementation
of strategic plans
of strategic plans |
 Asset
Type Estimated Closing
Estimated Sale Proceeds
Year-to-date Q3¹
Various
Closed
$227 M
Remaining Mervyns
Assets
Single-tenant retail
Q4
$52 M -
$72 M
Aon Office Building
Non-core office
Q4
$145 M -
$160 M
Other
Various
Q4
$24 M -
$91 M
Total
$450 M -
$550 M
1
Includes pad sales, earnouts, and the GMAC deed-in-lieu transaction
2012
disposition
program
includes
$450
-
$550
M
of
non-core
and
non-strategic
dispositions, of
which $227 M has closed year-to-date
Refocusing RPAI on multi-tenant retail through the anticipated dispositions of its largest
industrial asset, its largest office asset, and over half of its single-tenant
retail portfolio Estimated
net
proceeds
of
$200
-
$300
M
will
further
de-lever
balance
sheet
and
improve
risk
profile
8
Non-Core and Non-Strategic Disposition Program
Strengthening Balance Sheet |
 •Only
13.2% ¹
of our retail annualized base rent expires before 2014
•Renewed approximately 76% of expiring leases since beginning of 2009
Stable cash flows
•Currently operating at a historically wide spread between occupancy and percent leased
rate —Spread at June 30, 2012 was 290 bps, up 50 bps year-over-year
—
Strong leasing
momentum
•Consolidated
retail
operating
portfolio
percent
leased
of
91.0%²
as
compared
to
96.9%³
as
of
December
31,
2007
•The successful re-tenanting of big box space has allowed for renewed focus on small
shops, which represent 1.7 million square feet, or approximately 490 bps of potential
occupancy across the retail operating
portfolio
—94.5% leased on space over 10,000 square
feet
—81.3% leased on space under 10,000 square feet
•Over 800,000 square feet of additional space in leasing pipeline
Substantial
lease-up
opportunity
•Focus on value enhancing strategies such as risk mitigation, tenant retention,
long-term capital planning and asset sustainability initiatives
•Disciplined capital recycling through the disposition of non-core and
non-strategic assets Active asset
management
1
Includes our pro rata share of unconsolidated joint ventures
2
Includes leases signed but not commenced
3
Includes only leases commenced
Positioning RPAI for long-term value creation
Positioning RPAI for long-term value creation
9
Enhancing Portfolio Value
Maximizing NOI Through Internal Growth
1,013,000 square feet of newly signed leases, representing $12.9 M of contractually obligated
ABR, have not yet commenced |
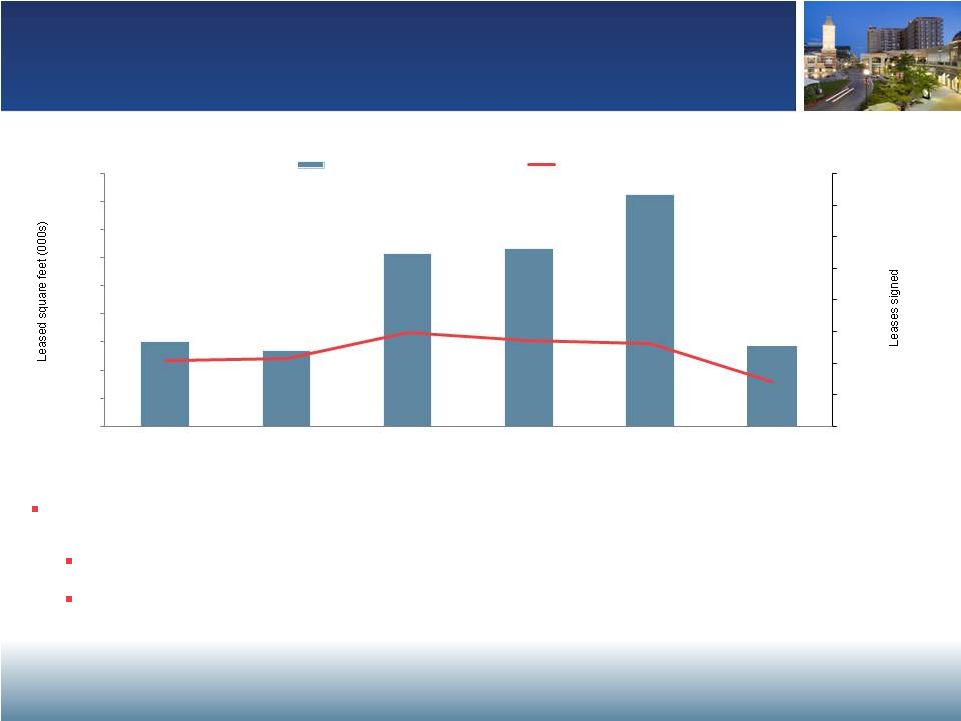 Over 800,000
square feet in the leasing pipeline, consisting of 550,000 square feet of anchor transactions and over
250,000 square feet of small shop transactions
Note: Consolidated retail operating portfolio; includes new and renewal leases
Robust leasing pipeline driving improving occupancy rate
Robust leasing pipeline driving improving occupancy rate
10
Capitalizing on Substantial Lease-up Opportunity
Enhancing Portfolio Value
1,503
1,352
3,085
3,171
4,121
1,424
416
426
593
545
522
286
0
200
400
600
800
1,000
1,200
1,400
1,600
0
500
1,000
1,500
2,000
2,500
3,000
3,500
4,000
4,500
2007
2008
2009
2010
2011
YTD Q2 2012
Leased square feet
Leases signed
Leasing pipeline contains almost 200,000 square feet of fully negotiated LOI’s
11 prospective tenants are in negotiations for multiple spaces |
 Continuing to
focus on controlling costs and corporate overhead Terminating a majority of service
agreements with The Inland Group, including:
—
Investment advisory and mortgage servicing
—
Communication services
—
Insurance & risk management services
—
Property tax services
—
Personnel services
—
Technology services
Signed lease for new office space and will move off The Inland Group
campus by year-end
All non-executive Directors are qualified as independent, as of May 2012
Corporate Governance Enhancements
Streamlining Operating Platform
11
Committed to developing and maintaining integrated
Committed to developing and maintaining integrated
best-in-class real estate platform
best-in-class real estate platform |
 Company
Overview 12 |
 259
Number of properties
Consolidated retail operating property summary
34.9 M square feet
Gross leasable area (GLA)
Location
35 states
Average portfolio age
~10 years
Occupancy / percent leased
88.1% / 91.0%¹
Annualized base rent (ABR)²
$434.2 M / $447.1 M¹
ABR per square foot²
$14.13 / $14.09¹
Breakdown based on GLA
Number of tenants
~1,500 Tenants
Largest tenant
3.3% of ABR
Non-retail portfolio based on ABR
11 office and 3 industrial properties
13
Power Center 45%
Community/Neighborhood Center 36%
Lifestyle Center 9%
Single User 10%
Non-retail 8.5%
Retail 91.5%
Includes leases signed but not commenced for approximately 1,013,000 square feet of GLA
representing $12.9 M of annualized base rent at lease commencement
ABR excludes $1.4 million from our development properties and $0.4 M for rental
abatements for the 12 months ending June 30, 2013
1
2
RPAI at a Glance |
 Large Diversified Retail Portfolio
High geographic diversity
Strong multi-tenant 3-mile demographics in top 50 MSAs
Significant presence in top MSAs
Breakdown based on GLA
68% of multi-tenant ABR located in top 50 Metropolitan
Statistical Areas (MSAs)
FL
Gross Leasable Area (GLA)
More than 5mm sq.ft.
1–5mm sq.ft.
Less than 1mm sq.ft.
2.9mm sq.ft
7.1mm sq.ft.
1.8mm sq.ft.
1.6mm sq.ft.
2.3mm sq.ft.
Strategically located assets diversified by geography, retail property type,
Strategically located assets diversified by geography, retail property type,
and tenant base
and tenant base
14
Power Center 45%
Top 50
MSAs
68%
Other
MSAs
32%
Single User 10%
Community /
Neighborhood Center
36%
Lifestyle Center 9%
—
Best Buy, Target, Home Depot, Kohl’s, Wal-Mart,
Lowe’s; or
—
A national or regional grocer
Over
90%
of
multi-tenant
assets
located
in
markets
outside
of
the top 50 MSAs are anchored by:
—
Average population of 89,626
—
Expected
population
growth
of
6.6%
over
the
next
five
years
—
Average
household
income
of
$83,152 |
 Power
center –
Summerville,
SC
GLA: 272,000 sq.ft.
Occupancy: 99.2%
ABR per leased sq.ft.: $13.44
Community
center
–
Newport
News,
VA
GLA: 308,000 sq.ft.
Occupancy: 95.0%
ABR per leased sq.ft.: $17.11
Community
center
–
Denton,
TX
GLA: 339,000 sq.ft.
Occupancy: 96.8%
ABR per leased sq.ft.: $14.58
Lifestyle
center
–
Southlake,
TX
GLA:
840,000 sq.ft.
Occupancy: 86.5%
ABR per leased sq.ft.: $28.37
Power
center
–
Temecula,
CA
GLA: 293,000 sq.ft.
Occupancy: 96.3%
ABR per leased sq.ft.: $12.48
Community
center
–
Chicago,
IL
GLA: 261,000 sq.ft.
Occupancy: 95.4%
ABR per leased sq.ft.: $21.56
Power
center
–
Seattle,
WA
GLA: 303,000 sq.ft.
Occupancy: 97.3%
ABR per leased sq.ft.: $11.96
Lifestyle
center
–
Plano,
TX
GLA: 391,000 sq.ft.
Occupancy: 88.2%
ABR per leased sq.ft.: $25.74
Southlake Town Square
Denton Town Crossing
Commons at Temecula
Northgate North
The Brickyard
Azalea Square
Jefferson Commons
Shops at Legacy
Note: Occupancy figures represent economic occupancy
15
Representative Properties |
 National Platform with Local Focus
Client-focused organization with significant local and regional on-the-ground
presence 19 strategically located property management offices
Over 180 employees dedicated to operations, including over 80 property managers and
senior leasing agents with an average of 15 years experience in the industry
GLA
(000s sq.ft.)
Regional breakdown
10,627
7,589
8,617
8,040
ABR
($000s)
$136,764
103,486
101,787
92,134
Total
34,873
$434,171
Note: Reflects consolidated retail operating portfolio
Experienced and talented employee base
Experienced and talented employee base
with nationwide coverage
with nationwide coverage
West
East
South
North
16 |
 1
Represents retail operating portfolio including our pro rata share of unconsolidated joint
ventures Rank
Tenant
# of Stores
GLA(000s)
ABR(000s)
% of Retail ABR
1
Best Buy Co, Inc.
30
1,069
$ 14,568
3.3%
2
Ahold USA, Inc.
11
661
12,935
2.9%
3
The TJX Companies Inc.
47
1,242
11,770
2.6%
4
Rite Aid Corporation
35
425
10,399
2.3%
5
PetSmart, Inc.
39
707
9,821
2.2%
6
Ross Stores, Inc.
38
990
9,448
2.1%
7
Bed Bath & Beyond Inc.
28
726
9,232
2.1%
8
The Home Depot, Inc.
9
1,097
9,135
2.0%
9
Kohl's Corporation
14
1,143
8,095
1.8%
10
The Sports Authority, Inc.
17
690
7,952
1.8%
11
Supervalu Inc.
10
562
7,705
1.7%
12
Pier 1 Imports, Inc.
39
390
7,252
1.6%
13
Publix Super Markets Inc.
15
634
6,703
1.5%
14
Michaels Stores, Inc.
29
588
6,592
1.5%
15
Edwards Theaters, Inc.
2
219
6,558
1.5%
16
Dicks Sporting Goods, Inc.
13
568
6,525
1.5%
17
Wal-Mart Stores, Inc.
6
903
5,985
1.3%
18
Office Depot, Inc.
22
439
5,737
1.3%
19
Staples, Inc.
18
342
4,663
1.0%
20
Rave Cinemas, LLC
2
162
4,626
1.0%
Total
424
13,557
$165,701
37.0%
Approximately 1,500 tenants with
approximately 3,200 leases
32 tenants each lease space at
more than 15 of our locations,
representing 8.8 M square feet
Over 90% of our shopping centers
anchored or shadow-anchored by
retailers selling basic household
goods or clothing
Shadow anchors provide
additional stability and traffic
generation
—
For example, we have 43 Target,
18 Home Depot and 13 Wal-
Mart shadow anchors
Diversity reduces risk of overexposure
Diversity reduces risk of overexposure
17
Diversified Base of Value-Oriented
Retail Tenants
Top 20 retail tenants represent 37% of retail ABR
1 |
 Portfolio has
strong line-up of grocery anchors —
74
of
our
196
multi-tenant
retail
properties
1
are
anchored
or
shadow-anchored
by a grocery store, and an additional 48 properties have a non-traditional
grocery component
2
Annual grocer sales average $25 M
3
or $501 per square foot, translating into an
estimated 18,000
4
shopper visits per week
1
Includes wholly-owned and unconsolidated joint ventures
2
Non-traditional component is defined as stores containing a Wal-Mart or Target branded
location 3
Includes only tenants that report sales
4
Estimate of shopper visits based on $26.78 sales per customer transaction (source: www.fmi.org
“FMI Facts & Figures”) 18
Dominant Grocery Anchors Drive Traffic |
 CAPITAL
MARKETS 19 |
 Raised $293 M
of common equity and began trading on the NYSE in early April
Closed a new $650 M unsecured credit facility in February, comprised of
a $350 M revolver and a $300 M term loan
—
Available borrowings can increase to $850 M in certain circumstances
—
In 3Q12, we entered into an interest rate swap transaction to fix the
variable rate portion of the term loan at 0.54% through February
2016 (spread on the line of credit was 2.50%, as of June 30, 2012)
Originated ten mortgages totaling $281 M at a weighted average interest
rate of 4.53% and a weighted average term of 9.4 years
As of October 1, 2012, addressed all remaining 2012 debt maturities
Providing financial flexibility to enhance balance sheet
Providing financial flexibility to enhance balance sheet
and position RPAI for growth
and position RPAI for growth
20
Strengthening Balance Sheet
Over $1.2 B of Capital Raised in 2012 |
 Historical Leverage Profile
Total Consolidated Debt ($M)
Combined Net
Debt / Combined
Adjusted EBITDA
8.9x
8.5x
7.6x
8.3x
Improving our risk profile by reducing leverage
Improving our risk profile by reducing leverage
is a top priority
is a top priority
21 |
 Capital Structure Positioned for Growth
Amount
Interest
Capitalization ($M)
Credit statistics
$130
Unsecured Revolving
Line of Credit
2.75%
300
Unsecured
Term
Loan
2.75%
2,562
Mortgage Debt
6.03%
139
Mezzanine
Debt
12.62%
2
Margin Debt
1.74%
$3,133
Total Debt
5.87%
(102)
Less Cash
$3,031
Net Debt
Combined Net Debt to
Combined Adjusted EBITDA
7.6x
Fixed
Rate
Debt
85.2%
Weighted Average Maturity
5.5 years
Weighted Average Interest
Rate
5.87%
Strong liquidity position, with $102 M of cash and
$220 M of availability on the unsecured line of credit
at June 30, 2012
Additional deleveraging is expected to come from the
continued lease-up of the portfolio and the execution
of the non-core and non-strategic disposition program
Objective of becoming an investment grade borrower
Objective of becoming an investment grade borrower
22
1
1
2
1
Subsequent to quarter end, we entered into an interest rate swap transaction to convert the
variable portion of $300 million of floating rate debt to a fixed rate of 0.54% through
February 2016. As a result, the all-in interest rate on the term loan would have been
3.04% and our fixed rate debt would have comprised 95% of our total debt 2 $14 million of mezzanine debt was repaid on July 2, 2012. The
remaining $125 million of mezzanine debt is open for prepayment in 1Q13, subject to a prepayment penalty |
 Debt Maturity Profile ($M)
$258
8.2%
$307
9.8%
$251
8.0%
$602
19.2%
$349
11.1%
$1,367
43.7%
Weighted
average
interest rate
5.67%
5.48%
6.90%
5.11%
3.20%
6.83%
Note: Excludes mortgage discount of $1.7 million, as of 6/30/2012
23
$0
$100
$200
$300
$400
$500
$600
$700
$800
$900
$1,000
$1,100
$1,200
$1,300
$1,400
2012
2013
2014
2015
2016
Thereafter
Mortgages payable
Notes payable
Credit facility
Margin payable
Manageable Near-Term Debt Maturities |
 Experienced Management Team
Executive
Experience
Steven P. Grimes
President
& Chief Executive Officer
Former experience as Chief Operating Officer & Chief
Financial Officer
Director with the mortgage brokerage firm of Cohen
Financial
Senior Manager with Deloitte & Touche
Named to the Board in March 2011
Shane C. Garrison
EVP
Chief Operating Officer
& Chief Investment Officer
Vice President of Asset Management of RPAI US
Management LLC
Head of Asset Management for ECI Properties
General Manager of the Midwest region for Circuit
City
Angela Aman
EVP
Chief Financial Officer
& Treasurer
Former Director of Capital Markets
Portfolio Manager at RREEF
Investment Banker for Deutsche Bank
Niall J. Byrne
EVP
& President of
Property Management
Senior Vice President of RPAI Holdco Management LLC
Vice President of Asset Management of American
Landmark Properties, Ltd.
Senior Vice President / Director of Operations for
Providence Management Company, LLC
Dennis K. Holland
EVP
General Counsel
& Secretary
Associate Counsel for The Inland Real Estate Group,
Inc.
Deputy General Counsel with Heller Financial, Inc.
Subsequently employed by GE Capital following the
acquisition of Heller Financial
Average 22+ years of real
estate industry experience
Successfully navigated most
recent economic crisis
Senior executive focus on
operations
In-house management and
leasing
Dedicated
Management Team
Board elected annually
All non-management board
members are independent
Board of Directors
24 |
 APPENDIX
NON-GAAP RECONCILIATIONS
25 |
 Non-GAAP Financial Measures
A-1
A-1
As defined by the National Association of Real Estate Investment Trusts (NAREIT), an industry
trade group, Funds from Operations (FFO) means net (loss) income computed in accordance with generally accepted
accounting principles (GAAP), excluding gains (or losses) from sales of investment properties,
plus depreciation and amortization and impairment charges on investment properties, including adjustments for
unconsolidated joint ventures in which we hold an interest. We have adopted the NAREIT
definition in our computation of FFO and believe that FFO, which is a non-GAAP performance measure, provides an
additional and useful means to assess the operating performance of real estate investment
trusts (REITs). We believe that, subject to the following limitations, FFO provides a basis for comparing our performance
and operations to those of other REITs. FFO is not intended to be an alternative to "Net
Income" as an indicator of our performance, nor an alternative to "Cash Flows from Operating Activities" as determined by
GAAP as a measure of our capacity to pay distributions. Depreciation and amortization related
to investment properties for purposes of calculating FFO include loss on lease terminations, which encompasses the
write-off of tenant-related assets, including tenant improvements and in-place
lease values, as a result of early lease terminations. Loss on lease terminations included in depreciation and amortization for FFO
excludes the write-off of tenant-related above and below market lease intangibles that
are otherwise included in "Loss on lease terminations" in our condensed consolidated statements of operations.
Operating FFO is defined as FFO excluding the impact of gains and losses from the early
extinguishment of debt and other items as denoted within the calculation that we do not believe are representative of the
operating results of our core business platform. We consider Operating FFO a meaningful,
additional measure of operating performance primarily because it excludes the effects of transactions and other events
which we do not consider representative of the operating results of our core business
platform. Operating FFO does not represent an alternative to "Net Income" as an indicator of our performance, nor an
alternative to "Cash Flows from Operating Activities" as determined by GAAP as a
measure of our capacity to pay dividends. Further, comparison of our presentation of Operating FFO to similarly titled measures for
other REITs may not necessarily be meaningful due to possible differences in definition and
application by such REITs. We define Net Operating Income (NOI) as operating revenues (rental income, tenant recovery
income, other property income, excluding straight-line rental income, amortization of lease inducements and
amortization of acquired above and below market lease intangibles) less property operating
expenses (real estate tax expense and property operating expense, excluding straight-line ground rent expense and
straight-line bad debt expense). We believe that is a useful measures of our operating
performance. Other REITs may use different methodologies for calculating NOI, and accordingly, our NOI may not be
comparable to other REITs. We believe that NOI provides an operating perspective not
immediately apparent from GAAP operating income or net (loss) income. We use NOI to evaluate our performance on a
property-by-property basis because these measures allow management to evaluate the
impact that factors such as lease structure, lease rates and tenant base, which vary by property, have on our operating
results. However, these measures should only be used as an alternative measure of our
financial performance. As of June 30, 2012, Same Store NOI represents NOI from our Same Store portfolio consisting of
270 operating properties acquired or place in service prior to April 1, 2011. NOI from Other Investment Properties
represents NOI primarily from our development properties, two additional phases of existing
properties acquired during the third quarter of 2011, two non-stabilized operating properties and one property that
was partially sold to our RioCan joint venture during the third quarter of 2011, which did not
qualify for discontinued operations accounting treatment. In addition, we have included University Square, the property
for which we have ceased making the monthly debt service payment and for which we have
attempted to negotiate with the lender in “Other Investment Properties” due to the uncertainty of the timing of the
transfer of ownership of this property. Prior to this quarter, we had included University
Square in the Same Store portfolio. NOI consists of the sum of Same Store NOI and NOI from Other Investment Properties.
The Same Store portfolio as of December 31, 2008 consisted of 294 operating properties
acquired or placed into service prior to January 1, 2007. Adjusted EBITDA represents net income (loss) before interest, income taxes, depreciation and
amortization, as further adjusted to eliminate the impact of certain items that we do not consider indicative of our
ongoing performance. Combined Adjusted EBITDA represents Adjusted EBITDA plus our pro rata
share of the EBITDA adjustments from our investment property unconsolidated joint ventures, including
discontinued operations associated with those ventures. We believe that Adjusted EBITDA and
Combined Adjusted EBITDA are useful because they allow investors and management to evaluate and compare our
performance from period to period in a meaningful and consistent manner in addition to
standard financial measurements under GAAP. Adjusted EBITDA and Combined Adjusted EBITDA are not measurements of
financial performance under GAAP and should not be considered as alternatives to net income,
as an indicator of operating performance or any measure of performance derived in accordance with GAAP. Our
calculations of Adjusted EBITDA and Combined Adjusted EBITDA may be different from the
calculation used by other companies and, accordingly, comparability may be limited.
Net Debt to Adjusted EBITDA represents (i) our total debt less cash and cash equivalents
divided by (ii) Adjusted EBITDA for the prior 12 months. Combined Net Debt to Combined Adjusted EBITDA represents (i) the
sum of (A) our total debt less cash and cash equivalents plus (B) our pro rata share of our
investment property unconsolidated joint ventures' total debt less our pro rata share of these joint ventures' cash and cash
equivalents divided by (ii) Combined Adjusted EBITDA for the prior 12 months. We believe that
these ratios are useful because they provide investors with information regarding total debt net of cash and cash
equivalents, which could be used to repay debt, compared to our performance as measured using
Adjusted EBITDA and Combined Adjusted EBITDA. Funds From Operation (FFO)
Operating FFO
Net Operating Income (NOI)
Same
Store
NOI
and
NOI
from
Other
Investment
Properties
Adjusted
EBITDA
and
Combined
Adjusted
EBITDA
Net
Debt
to
Adjusted
EBITDA
and
Combined
Net
Debt
to
Combined
Adjusted
EBITDA |
 Three Months
Ended June 30, Twelve Months Ended December 31,
(in thousands)
2012
2011
2008¹
2007¹
Same Store investment properties
$105,402
$101,252
$477,954
$474,628
Other investment properties
166
2,590
32,712
23,754
Total net operating
income
105,568
103,842
510,666
498,382
Other income (expense):
Straight-line rental income,
net
228
(132)
12,851
15,882
Amortization of acquired above and below market lease intangibles, net
376
426
2,504
3,200
Amortization of lease
inducements
(72)
(15)
-
-
Straight-line ground rent
expense
(910)
(948)
(5,186)
(3,806)
Straight-line bad debt
expense
-
-
(8,749)
(1,877)
Insurance captive
income
-
-
1,938
1,890
Depreciation and
amortization
(58,289)
(58,742)
(265,587)
(257,132)
Provision for impairment of investment
properties
(1,323)
-
(80,000)
(13,560)
Loss on lease
terminations
(1,177)
(3,355)
(67,092)
(11,788)
Insurance captive
expenses
-
-
(2,874)
(1,598)
General and administrative
expenses
(6,543)
(5,043)
(19,997)
(16,535)
Advisor asset management fee
-
-
-
(23,750)
Dividend
income
615
522
24,010
23,729
Interest
income
19
170
4,329
13,671
Gain on extinguishment of debt,
net
-
3,715
-
2,486
Gain on contribution of investment properties
-
-
-
11,749
Equity in (loss) income of unconsolidated joint ventures, net
(1,286)
(1,981)
(4,939)
96
Interest
expense
(40,537)
(55,644)
(224,015)
(217,771)
Co-venture obligation
expense
(397)
(1,792)
-
-
Recognized gain (loss) on marketable securities,
net 7,265
277
(160,888)
(19,967)
Impairment of goodwill
-
-
(377,916)
-
Loss on investment in unconsolidated joint venture
-
-
(5,524)
-
Loss on interest rate locks
-
-
(16,778)
-
Other income/(expense),
net
2,479
171
(1,062)
237
Total other
expense
(99,552)
(122,371)
(1,194,975)
(494,844)
Income (loss) from continuing
operations
6,016
(18,529)
(684,309)
3,538
Discontinued operations:
Operating income,
net
490
1,709
1,096
2,200
Gain on sales of investment properties,
net
6,847
702
-
37,296
Income from discontinued
operations
7,337
2,411
1,096
39,496
Gain on sales of investment
properties
4,323
2,402
-
-
Net income
(loss)
17,676
(13,716)
(683,213)
43,034
Net income attributable to noncontrolling
interests
-
(8)
(514)
(1,365)
Net income (loss) attributable to Company
shareholders $17,676
$(13,724)
$(683,727)
$41,669
1
Figures reflect properties in our same sore portfolio as of December 31, 2008 and properties
that qualified as discontinued operations through December 31, 2008. Properties that have qualified as discontinued
operations subsequent to December 31, 2008 are reflected in continuing operations
A-2
Reconciliation of NOI to Net Income |
 Three Months
Ended June 30, (in thousands, except per share amounts)
2012
2011
Net income (loss) attributable to Company shareholders
$17,676
$(13,724)
Add:
Depreciation and amortization¹
62,156
64,389
Provision for impairment of investment properties¹
1,498
1,523
Less:
Gain on sales of investment properties¹
(11,170)
(3,104)
Non-controlling
interests’
share of depreciation related to consolidated joint
ventures¹ -
(96)
Funds from operations(FFO)
$70,160
$48,988
FFO per common share outstanding
$0.31
$0.25
Less:
Mortgage premium write-off
(10,295)
-
Recognized gain on marketable securities
(7,265)
(277)
Gain on extinguishment of debt
-
(3,715)
Other
(1,627)
-
Operating FFO
$50,973
$44,996
Operating FFO per common share outstanding
$0.23
$0.23
Weighted average number of common shares outstanding
226,543
192,114
1
Includes amounts from discontinued operations
A-3
Reconciliation of Operating FFO |
 Twelve
Months Ended (in thousands)
June 30, 2012
December 31, 2011
December 31, 2010
December 31, 2009
Net
loss
$(17,457)
$(72,578)
$(94,707)
$(115,409)
Interest
expense
209,985
230,979
255,355
226,392
Interest expense (discontinued
operations)
958
1,911
9,561
18,101
Depreciation and
amortization
233,755
234,406
238,563
241,414
Depreciation and amortization (discontinued
operations) 1,215
3,614
9,525
17,178
Loss on partial sales of investment
properties
-
-
385
-
Gain on sales of investment
properties
(5,846)
(5,906)
-
-
Gain on sales of investment properties, net (discontinued
operations)
(28,110)
(24,509)
(23,806)
(26,383)
Gain on extinguishment of debt,
net
(6,146)
(16,705)
-
-
Loss on lease
terminations
7,621
9,704
15,523
17,550
Loss on lease terminations (discontinued
operations)
-
26
285
54
Provision for impairment of investment
properties
8,973
7,650
11,030
27,600
Provision for impairment of investment properties (discontinued
operations) 1,958
32,331
12,027
37,100
Impairment of notes
receivable
-
-
-
17,322
Recognized gain on marketable securities,
net
(7,265)
(277)
(4,007)
(18,039)
Gain on interest rate
locks
-
-
-
(3,989)
Adjusted
EBITDA
$399,641
$400,646
$429,734
$438,891
Pro rata share of adjustments from investment property unconsolidated joint
ventures:
Interest
expense
$3,863
$3,310
$2,804
$4,294
Depreciation and
amortization
9,607
7,080
3,781
3,372
Loss (gain) on sales of investment
properties
28
28
(432)
675
Loss on lease terminations
561
387
-
-
Provision for impairment of investment
properties
1,292
3,959
-
9,062
Amortization of basis (not pro
rata)
156
204
277
284
Combined Adjusted EBITDA¹
$415,148
$415,614
$436,164
$456,578
1
Combined data and ratios include our pro rata share of unconsolidated joint ventures in
addition to our wholly-owned and consolidated portfolio A-4
Reconciliation of Combined
Adjusted EBITDA |
 Period
Ended (in thousands, except ratios)
June 30, 2012
December 31,
2011
December 31,
2010
December 31,
2009
Total
debt
$3,132,920
$3,481,218
$3,757,237
$4,110,985
Less: cash and cash
equivalents
(102,346)
(136,009)
(130,213)
(125,904)
Net
debt
$3,030,574
$3,345,209
$3,627,024
$3,985,081
Adjusted EBITDA¹
399,641
400,646
429,734
438,891
Net debt to Adjusted
EBITDA
7.6x
8.3x
8.4x
9.1x
Net
debt
$3,030,574
$3,345,209
$3,627,024
$3,985,081
Add: pro rata share of our investment property unconsolidated joint
ventures’
total
debt
112,071
114,382
79,475
62,998
Less: pro rata share of our investment property unconsolidated joint
ventures’
cash and cash
equivalents
(2,157)
(13,238)
(1,527)
(4,116)
Combined net debt²
$3,140,488
$3,446,353
$3,704,972
$4,043,963
Combined Adjusted EBITDA
1,2
415,148
415,614
436,164
456,578
Combined net debt to combined Adjusted EBITDA²
7.6x
8.3x
8.5x
8.9x
1
For purposes of these ratio calculations, twelve months ended figures were used
2
Combined data and ratios include our pro rata share of unconsolidated joint ventures in
addition to our wholly-owned and consolidated portfolio A-5
Reconciliation of Combined Net Debt to
Combined Adjusted EBITDA |
 |