Attached files
| file | filename |
|---|---|
| 8-K - FORM 8-K - BRADY CORP | d407861d8k.htm |
| EX-99.2 - PRESS RELEASE DATED SEPTEMBER 6, 2012 - BRADY CORP | d407861dex992.htm |
| EX-99.1 - PRESS RELEASE DATED SEPTEMBER 7, 2012 - BRADY CORP | d407861dex991.htm |
Exhibit 99.3

| F'12 - Q4 Financial Results September 7, 2012 September 7, 2012 BRADY - FISCAL 2012 Q4 FINANCIAL RESULTS |

| FORWARD-LOOKING STATEMENTS BRADY - FISCAL 2012 Q4 FINANCIAL RESULTS 2 Brady believes that certain statements in this presentation are "forward-looking statements" within the meaning of the Private Securities Litigation Reform Act of 1995. All statements related to future, not past, events included in this presentation, including, without limitation, statements regarding Brady's future financial position, business strategy, targets, projected sales, costs, earnings, capital expenditures, debt levels and cash flows, and plans and objectives of management for future operations are forward-looking statements. When used in this presentation, words such as "may," "will," "expect," "intend," "estimate," "anticipate," "believe," "should," "project" or "plan" or similar terminology are generally intended to identify forward-looking statements. These forward-looking statements by their nature address matters that are, to different degrees, uncertain and are subject to risks, assumptions and other factors, some of which are beyond Brady's control, that could cause actual results to differ materially from those expressed or implied by such forward-looking statements. For Brady, uncertainties arise from the length or severity of the current worldwide economic downturn or timing or strength of a subsequent recovery; future financial performance of major markets Brady serves, which include, without limitation, telecommunications, manufacturing, electrical, construction, laboratory, education, governmental, public utility, computer, transportation; difficulties in making and integrating acquisitions; risks associated with newly acquired businesses; Brady's ability to develop and successfully market new products; changes in the supply of, or price for, parts and components; increased price pressure from suppliers and customers; fluctuations in currency rates versus the US dollar; unforeseen tax consequences; potential write-offs of Brady's substantial intangible assets; Brady's ability to retain significant contracts and customers; risks associated with international operations; Brady's ability to maintain compliance with its debt covenants; technology changes; business interruptions due to implementing business systems; environmental, health and safety compliance costs and liabilities; future competition; interruptions to sources of supply; Brady's ability to realize cost savings from operating initiatives; difficulties associated with exports; risks associated with restructuring plans; risks associated with obtaining governmental approvals and maintaining regulatory compliance; and numerous other matters of national, regional and global scale, including those of a political, economic, business, competitive and regulatory nature contained from time to time in Brady's U.S. Securities and Exchange Commission filings, including, but not limited to, those factors listed in the "Risk Factors" section located in Item 1A of Part I of Brady's Form 10-K for the year ended July 31, 2011. These uncertainties may cause Brady's actual future results to be materially different than those expressed in its forward-looking statements. Brady does not undertake to update its forward-looking statements except as required by law. We refer to certain non-GAAP financial measures in this presentation. Reconciliations of these non-GAAP financial measures to the most directly comparable GAAP financial measures can be found within this presentation. |
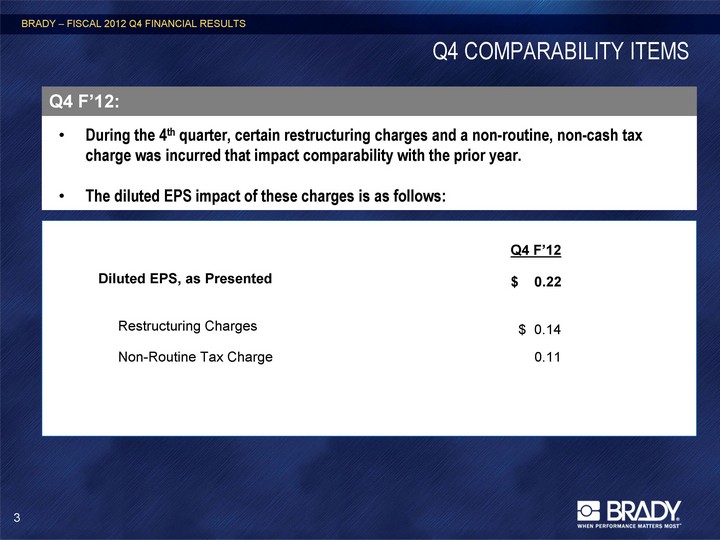
| Q4 COMPARABILITY ITEMS BRADY - FISCAL 2012 Q4 FINANCIAL RESULTS 3 During the 4th quarter, certain restructuring charges and a non-routine, non-cash tax charge was incurred that impact comparability with the prior year. The diluted EPS impact of these charges is as follows: Q4 F'12: Q4 F'12 Diluted EPS, as Presented $ 0.22 Restructuring Charges $ 0.14 Non-Routine Tax Charge 0.11 |

| F'12 RECAP Net loss of $17.9M vs. a $108.7M of net income in F'11. Net Income, excluding impairment, restructuring charges, and non-routine tax charge** of $113.0M vs. $115.2M in F'11. Diluted EPS of $(0.35) in F'12 compared to $2.04 in F'11. Diluted EPS, excluding impairment, restructuring charges, and non-routine tax charge** of $2.14 vs. $2.16 in F'11. Sales down 1.1% to $1.32 billion vs. $1.34 billion in F'11 (Organic sales down 0.4%). Gross Profit Margin of 48.0% in F'12 vs. 49.0% in F'11. SG&A expense down 50 bps to 32.5% of sales vs. 33.0% in F'11. Cash Flow: F'12 free cash flow* of $120.6M. Repurchased 1,869,193 shares for $49.9M and authorized an additional 2 million Class A Common Share buyback program in September 2012. Returned $38.9 million to shareholders in the form of dividends and announced 27th consecutive year of annual dividend increases. BRADY - FISCAL 2012 Q4 FINANCIAL RESULTS 4 * Free Cash Flow = Cash Flow from Operating Activities - Capital Expenditures. ** Net Income, excluding impairment, restructuring charges, and non-routine tax charge and Diluted EPS, excluding impairment, restructuring charges, and non-routine tax charge are non-GAAP measures. See slides #19 and #20. |

| Q4 F'12 - FINANCIAL SUMMARY Net income down 60.6% to $11.7M vs. $29.6M in Q4 of F'11. Net Income, excluding restructuring charges and non-routine tax charge** down 21.7% to $24.4M vs. $31.1M in Q4 of F'11. Diluted EPS down 60.0% to $0.22 in Q4 of F'12 vs. $0.55 in Q4 of F'11. Diluted EPS, excluding restructuring charges and non-routine tax charge** down 19.0% to $0.47 vs. $0.58 in Q4 of F'11. Sales down 6.0% to $322.5M vs. $343.1M in Q4 of F'11. Organic sales down 2.6%, Fx decreased sales by 5.0%, and acquisitions increased sales by 1.6%. Negative organic sales growth caused exclusively by the Asia-Pacific region. Gross Profit Margin of 48.1% is consistent with the gross profit margin in Q4 of F'11. SG&A expense of 34.0% of sales is up 210 bps vs. 31.9% in Q4 of F'11. Q4 F'12 Free Cash Flow* of $34.5 million. July 31, 2012 cash balance of $306M and debt balance of $316M. BRADY - FISCAL 2012 Q4 FINANCIAL RESULTS 5 * Free Cash Flow = Cash Flow from Operating Activities - Capital Expenditures. ** Net Income, excluding impairment, restructuring charges, and non-routine tax charge and Diluted EPS, excluding impairment, restructuring charges, and non-routine tax charge are non-GAAP measures. See slides #19 and #20. |

| F'13 GUIDANCE BRADY - FISCAL 2012 Q4 FINANCIAL RESULTS 6 Diluted EPS $2.20 to $2.40 (Excluding after-tax restructuring charges) Guidance Assumptions: Full-year income tax rate in the mid-to-upper 20% range. Diluted share count consistent with that as of July 31, 2012. Current foreign currency exchange rates. Full-year depreciation and amortization expense of approximately $45 million. Full-year capital expenditures of approximately $35 million. Free cash flow of approximately 100% - 120% of net income. In accordance with our normal practice, our guidance does not assume any acquisitions or dispositions. Brady Corporation's practice is to only change or reconfirm guidance in a public forum. |

| SALES OVERVIEW Organic Sales 2% 10% 1% (0.6%) 3.5% (1.8%) (0.5%) (2.6%) BRADY - FISCAL 2012 Q4 FINANCIAL RESULTS 7 Q4 F'12 Sales Down 6.0%. (2.6%) Organic Sales Decline (Americas and EMEA grew while Asia-Pacific contracted). 1.6% Growth from Acquisitions. (5.0%) Decline due to Currency Translation. Americas - Continued growth in North America while Brazil economy slows. EMEA - Internal initiatives combating weak macro-economy, driving positive organic sales growth. Asia - Die-cut business depressing regional organic sales. Q4 F'12 TOTAL COMPANY SALES: Q4 F'12 SALES COMMENTARY: SALES (Millions of USD) |

| GROSS PROFIT MARGIN AND SG&A BRADY - FISCAL 2012 Q4 FINANCIAL RESULTS 8 GROSS PROFIT & GPM% (Millions of USD) SG&A & SG&A as % of SALES (Millions of USD) GPM of 48.1% is flat with Q4 of F'11. Asia GPM weakness offset by mix, productivity improvements, and strategic sourcing benefits. GROSS PROFIT MARGIN DRIVERS: SG&A expense negatively impacted by acquisitions and internal reorganization related costs and positively impacted by foreign currency translation in Q4 of F'12. Benefits from restructuring actions being reinvested into growth initiatives. SG&A EXPENSE DRIVERS: |

| NET INCOME* AND DILUTED EPS* Q4 F'12 diluted EPS down 60.0% to $0.22. Q4 F'12 diluted EPS, excluding impairment, restructuring charges, and non-routine tax charge down 19.0% to $0.47/share. F'12 - Restructuring and non-routine costs incurred to right size cost structure in light of stagnant macro- economy. F'13 - Benefits from restructuring being redeployed into initiatives to drive future organic growth and profit improvements. BRADY - FISCAL 2012 Q4 FINANCIAL RESULTS 9 NET INCOME* (Millions of USD) DILUTED EPS (Class A Shares)* Q4 F'12 NET INCOME & DILUTED EPS: NET INCOME & DILUTED EPS DRIVERS: * Excludes $115.7M of non-cash impairment charges in Q2 of F'12. |

| CASH GENERATION BRADY - FISCAL 2012 Q4 FINANCIAL RESULTS 10 Cash Flow from Operating Activities in Q4 of F'12 = $44.1M. Returned $9.7M to our shareholders in dividends in Q4 ($38.9M for the year ended July 31, 2012). Acquired 1,411,833 of shares for $37.6M in Q4 of F'12 (1,869,193 shares for the year ended July 31, 2012). CASH BALANCE WALK (Millions of USD) CASH GENERATION - F'12 Q4: |

| DEBT & EBITDA BRADY - FISCAL 2012 Q4 FINANCIAL RESULTS NET DEBT / TTM EBITDA* July 31, 2012 Debt = $316M. July 31, 2012 Cash = $306M. STRONG BALANCE SHEET: 11 DEBT & TTM EBITDA* (Millions of USD) * See slide #18 for the calculation of EBITDA. |

| Q4 F'12 - NEW PRODUCT LAUNCHES Thermal Management Material: TransthermTM TSoft3HP - High performance thermal conductive gap filler, used in electronics to dissipate heat. Applications include Power Modules, CPUs, LED lighting and Telecom. Brady's solution offers high performance thermal conductivity with key improvements to handling properties, making it easier for customers to convert and apply. Software: LabelMarkTM Extensions - A LabelMark "App" for select major ADM customers that reduces time and complexity of their identification process, giving them compelling reasons to use Brady materials, printers and software. LINK360TM Maintenance Center and Lockout Center- BRADY LINK360 is a cloud based software platform for the management of visual information on and around equipment and machines. It helps customers with the management of their lean and regulatory programs. BRADY - FISCAL 2012 Q4 FINANCIAL RESULTS 12 |
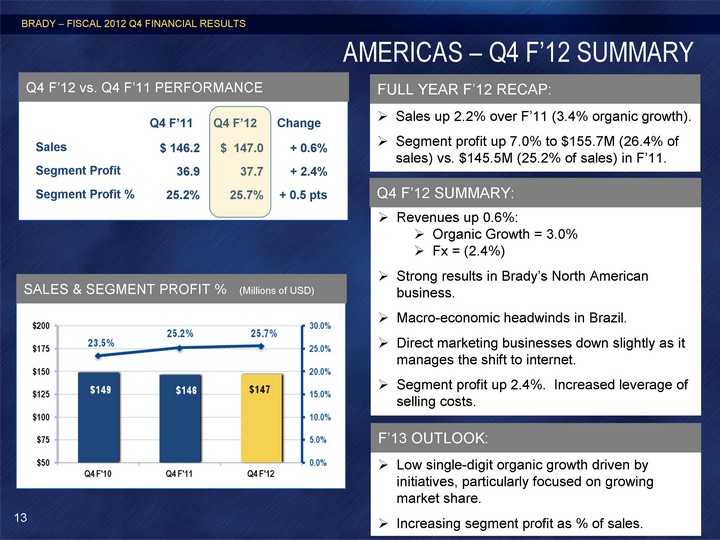
| AMERICAS - Q4 F'12 SUMMARY Q4 F'11 Q4 F'12 Change Sales $ 146.2 $ 147.0 + 0.6% Segment Profit 36.9 37.7 + 2.4% Segment Profit % 25.2% 25.7% + 0.5 pts BRADY - FISCAL 2012 Q4 FINANCIAL RESULTS 13 SALES & SEGMENT PROFIT % (Millions of USD) Q4 F'12 vs. Q4 F'11 PERFORMANCE Revenues up 0.6%: Organic Growth = 3.0% Fx = (2.4%) Strong results in Brady's North American business. Macro-economic headwinds in Brazil. Direct marketing businesses down slightly as it manages the shift to internet. Segment profit up 2.4%. Increased leverage of selling costs. Q4 F'12 SUMMARY: Low single-digit organic growth driven by initiatives, particularly focused on growing market share. Increasing segment profit as % of sales. F'13 OUTLOOK: Sales up 2.2% over F'11 (3.4% organic growth). Segment profit up 7.0% to $155.7M (26.4% of sales) vs. $145.5M (25.2% of sales) in F'11. FULL YEAR F'12 RECAP: |
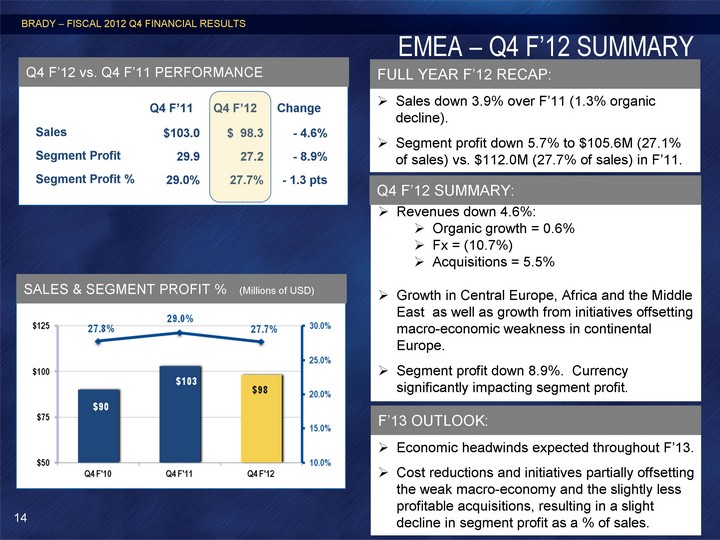
| EMEA - Q4 F'12 SUMMARY Q4 F'11 Q4 F'12 Change Sales $103.0 $ 98.3 - 4.6% Segment Profit 29.9 27.2 - 8.9% Segment Profit % 29.0% 27.7% - 1.3 pts BRADY - FISCAL 2012 Q4 FINANCIAL RESULTS 14 SALES & SEGMENT PROFIT % (Millions of USD) Q4 F'12 vs. Q4 F'11 PERFORMANCE Revenues down 4.6%: Organic growth = 0.6% Fx = (10.7%) Acquisitions = 5.5% Growth in Central Europe, Africa and the Middle East as well as growth from initiatives offsetting macro-economic weakness in continental Europe. Segment profit down 8.9%. Currency significantly impacting segment profit. Q4 F'12 SUMMARY: Economic headwinds expected throughout F'13. Cost reductions and initiatives partially offsetting the weak macro-economy and the slightly less profitable acquisitions, resulting in a slight decline in segment profit as a % of sales. F'13 OUTLOOK: Sales down 3.9% over F'11 (1.3% organic decline). Segment profit down 5.7% to $105.6M (27.1% of sales) vs. $112.0M (27.7% of sales) in F'11. FULL YEAR F'12 RECAP: |

| ASIA-PACIFIC - Q4 F'12 SUMMARY Q4 F'11 Q4 F'12 Change Sales $ 93.9 $ 77.3 - 17.8% Segment Profit 11.8 4.1 - 65.4% Segment Profit % 12.5% 5.3% - 7.2 pts BRADY - FISCAL 2012 Q4 FINANCIAL RESULTS 15 SALES & SEGMENT PROFIT % (Millions of USD) Q4 F'12 vs. Q4 F'11 PERFORMANCE Revenues down 17.8%: Organic = (14.6%) Fx = (3.2%) Investing in Asian identification solutions business for future growth. Die-cut business challenged, but has improved positions with certain key customers. Segment profit down $7.7M, reflecting challenges in the die-cut business. Q4 F'12 SUMMARY: Flat organic sales in first half of F'13, improving in second half of the year. Ongoing efficiency and improvement programs will lift segment profit. F'13 OUTLOOK: Sales down 3.4% over F'11 (5.3% organic decline). Segment profit down 36.7% to $31.7M (9.2% of sales) vs. $50.1M (14.0% of sales) in F'11. FULL YEAR F'12 RECAP: |

| INVESTOR RELATIONS Brady Contact: Aaron Pearce Investor Relations 414-438-6895 Aaron_Pearce@Bradycorp.com See our web site at www.investor.bradycorp.com BRADY - FISCAL 2012 Q4 FINANCIAL RESULTS 16 |

| INCOME STATEMENTS BRADY - FISCAL 2012 Q4 FINANCIAL RESULTS 17 COMPARABLE INCOME STATEMENT (Millions of USD) |

| EBITDA RECONCILIATION BRADY - FISCAL 2012 Q4 FINANCIAL RESULTS 18 EBITDA (Millions of USD) |

| Diluted EPS, excluding impairment, restructuring & non-routine tax charge BRADY - FISCAL 2012 Q4 FINANCIAL RESULTS 19 Reconciliation of Diluted EPS, excluding impairment, restructuring and non-routine tax charge: |

| Net Income, excluding impairment, restructuring & non-routine tax charge BRADY - FISCAL 2012 Q4 FINANCIAL RESULTS 20 Reconciliation of Net income, excluding impairment, restructuring and non-routine tax charge ('000s of USD): |