Attached files
| file | filename |
|---|---|
| 8-K - CUSTOMERS BANCORP FORM 8-K - Customers Bancorp, Inc. | customers8k.htm |

This presentation as well as other written or oral communications made from time to time by us, may contain certain
forward-looking information within the meaning of the Securities Act of 1933, as amended, and the Securities
Exchange Act of 1934, as amended. These statements relate to future events or future predictions, including events
or predictions relating to our future financial performance, and are generally identifiable by the use of forward-looking
terminology such as “believes,” “expects,” “may,” “will,” “should,” “plan,” “intend,” “target,” or “anticipates” or the
negative thereof or comparable terminology, or by discussion of strategy or goals that involve risks and uncertainties.
These forward-looking statements are only predictions and estimates regarding future events and circumstances and
involve known and unknown risks, uncertainties and other factors that may cause our actual results, levels of activity,
performance or achievements to be materially different from any future results, levels of activity, performance or
achievements expressed or implied by such forward-looking statements. This information is based on various
assumptions by us that may not prove to be correct.
Important factors to consider and evaluate in such forward-looking statements include:
· changes in the external competitive market factors that might impact our results of operations;
· changes in laws and regulations, including without limitation changes in capital requirements under the federal
prompt corrective action regulations;
prompt corrective action regulations;
· changes in our business strategy or an inability to execute our strategy due to the occurrence of unanticipated
events;
events;
· our ability to identify potential candidates for, and consummate, acquisition or investment transactions;
· the timing of acquisition or investment transactions;
· constraints on our ability to consummate an attractive acquisition or investment transaction because of
significant competition for these opportunities;
significant competition for these opportunities;
· the failure of the Bank to complete any or all of the transactions described herein on the terms currently
contemplated;
contemplated;
· local, regional and national economic conditions and events and the impact they may have on us and our
customers;
customers;
· ability to attract deposits and other sources of liquidity;
· changes in the financial performance and/or condition of our borrowers;
· changes in the level of non-performing and classified assets and charge-offs;
Forward-Looking Statements

Forward-Looking Statements
· changes in estimates of future loan loss reserve requirements based upon the periodic review thereof under
relevant regulatory and accounting requirements;
relevant regulatory and accounting requirements;
· the integration of the Bank’s recent FDIC-assisted acquisitions may present unforeseen challenges;
· inflation, interest rate, securities market and monetary fluctuations;
· the timely development and acceptance of new banking products and services and perceived overall value of
these products and services by users;
these products and services by users;
· changes in consumer spending, borrowing and saving habits;
· technological changes;
· the ability to increase market share and control expenses;
· continued volatility in the credit and equity markets and its effect on the general economy; and
· the effect of changes in accounting policies and practices, as may be adopted by the regulatory agencies, as
well as the Public Company Accounting Oversight Board, the Financial Accounting Standards Board and other
accounting standard setters;
well as the Public Company Accounting Oversight Board, the Financial Accounting Standards Board and other
accounting standard setters;
· the businesses of the Bank and any acquisition targets or merger partners and subsidiaries not integrating
successfully or such integration being more difficult, time-consuming or costly than expected;
successfully or such integration being more difficult, time-consuming or costly than expected;
· material differences in the actual financial results of merger and acquisition activities compared with
expectations, such as with respect to the full realization of anticipated cost savings and revenue enhancements
within the expected time frame;
expectations, such as with respect to the full realization of anticipated cost savings and revenue enhancements
within the expected time frame;
· revenues following any merger being lower than expected; and
· deposit attrition, operating costs, customer loss and business disruption following the merger, including, without
limitation, difficulties in maintaining relationships with employees being greater than expected.
limitation, difficulties in maintaining relationships with employees being greater than expected.
These forward-looking statements are subject to significant uncertainties and contingencies, many of which are
beyond our control. Although we believe that the expectations reflected in the forward-looking statements are
reasonable, we cannot guarantee future results, levels of activity, performance or achievements. Accordingly, there
can be no assurance that actual results will meet expectations or will not be materially lower than the results
contemplated in this presentation. You are cautioned not to place undue reliance on these forward-looking statements,
which speak only as of the date of this document or, in the case of documents referred to or incorporated by reference,
the dates of those documents. We do not undertake any obligation to release publicly any revisions to these forward-
looking statements to reflect events or circumstances after the date of this document or to reflect the occurrence of
unanticipated events, except as may be required under applicable law.

Pro Forma Capitalization
(1) Book value and tangible book value per share estimates based on 6/30/2012 basic shares outstanding of ~11.3 million, plus ~1.1 million shares issued after 6/30/2012 raising a total of ~$15 million,
plus ~3.4 million shares assumed to be issued in this $50 million private placement at midpoint of offering price range of $14.50 per share. 9/30/2012E capital ratios include 6/30/2012 capital levels, plus
mid point of estimated Q3 2012 earnings per the 8-K filed on 8/24/2012, plus ~$14.9 million in net proceeds raised after 6/30/2012, plus net proceeds of $47.5 million from this $50 million private
placement.
(2) Based on preliminary analysis of transaction, management expects to record a bargain purchase gain of ~$8.0 to ~$10.0 million. Estimated range also based on the assumption that Customers issues
common stock to Acacia shareholders at 1.15x BV in the month end prior to the close, which is expected to be in Q4 2012.
common stock to Acacia shareholders at 1.15x BV in the month end prior to the close, which is expected to be in Q4 2012.
(3) Pro forma book value and tangible book value information presented for informational purposes only. These are current estimates based on management’s preliminary analysis of the Acacia transaction,
which is expected to close in Q4 2012.
which is expected to close in Q4 2012.

§ Best returns for shareholders when cycle is turning
§ Goal is 15%+ average annual returns for shareholders
§ We needed four elements to execute
– A bank charter
– Very experienced and motivated management team
– Unique and clear strategy
– Superior execution
Introduction

Company Overview
Source: SNL Financial and Company data
Note: Deposit data representative of 6/30/2011; includes Acacia Federal Savings Bank and CMS Bank deposits
*Source: SNL Financial as of 6/30/2011. Represents deposits pro forma for the acquisition of Acacia Federal Savings Bank (expected to close in Q4 2012) and CMS Bancorp (expected to close in Q2 2013).
Actual deposits transferred likely to be lower.
Actual deposits transferred likely to be lower.
1.Pro forma assets assumes $2.7 billion of estimated assets for Customers Bancorp as of Q3 2012, plus ~$490 million of assets expected to be acquired through the Acacia Federal Savings acquisition that is
expected to close in Q4 2012, plus ~$247 million of assets from the CMS Bancorp acquisition expected to close in Q2 2013.
expected to close in Q4 2012, plus ~$247 million of assets from the CMS Bancorp acquisition expected to close in Q2 2013.
2.As of June 30, 2012.
3.Acacia Federal Savings Bank acquisition expected to close in Q4 2012 (subject to regulatory approval).
4.CMS Bancorp Inc. acquisition expected to close in Q2 2013 (subject to regulatory approval).
§ Pro forma $3bn institution with 21 sales
offices(1)
offices(1)
§ Average deposits per branch exceeding $125
million (2)
million (2)
§ Operating in key Mid-Atlantic markets
– Southeastern Pennsylvania (Bucks, Berks,
Chester and Delaware counties)
Chester and Delaware counties)
– New York (Westchester county)
– New Jersey (Mercer county)
§ Entering Washington DC market(3)
§ Expanding presence in Westchester county(4)
§ Attractive target market demographics
– 17.6% higher median household income
compared to national average
compared to national average
– 3.2% higher projected growth compared to
national average
national average
CMS
Customers Bancorp
Acacia

Management Track Record
Sovereign Cumulative Shareholder Returns with Jay Sidhu as CEO:
March 1989 - December 2006
Source: SNL Financial.
1,474%
Dec-06
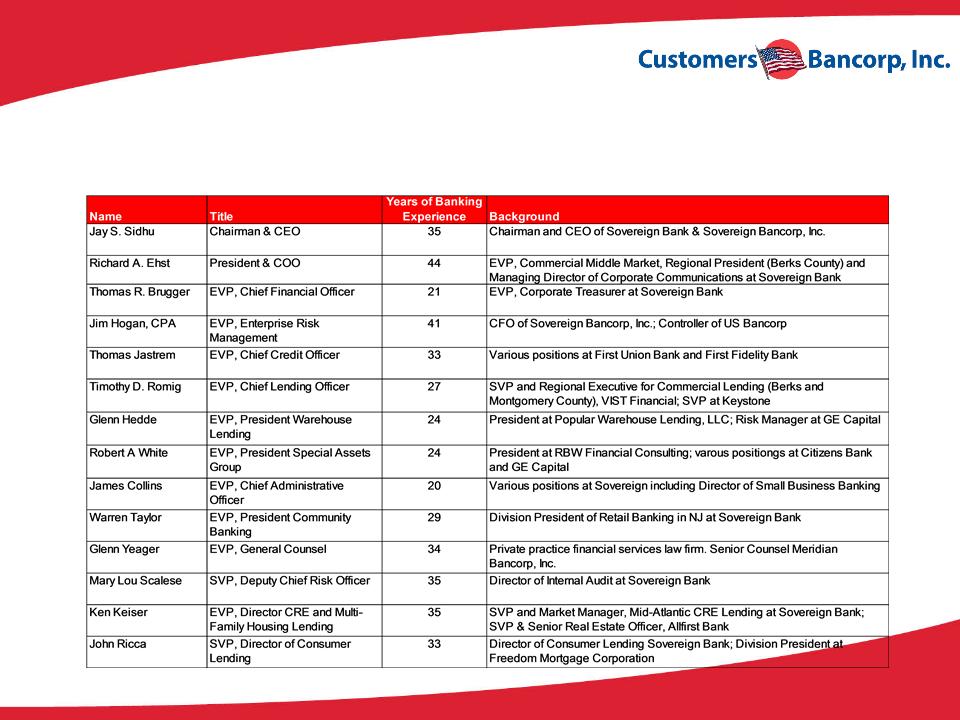
Seasoned Management Team
§ Experienced and cohesive management team with an average tenure of 30 years experience
– 9 out of 14 senior executives previously worked at Sovereign
§ ~20% ownership by management and insiders

High Quality Independent Board of Directors (1)
(1) Bhanu Choudhrie’s appointment to the Board of Directors is pending regulatory approval.

§ Jay Sidhu joins $270 million
asset Customers Bank (FKA
New Century Bank)
asset Customers Bank (FKA
New Century Bank)
§ Identified existing credit
problems, adequately reserved
and recapitalized the bank
problems, adequately reserved
and recapitalized the bank
§ Actively worked out problem
loans
loans
§ Recruited experienced
management team
management team
Execution Timeline
§ Enhanced credit and risk
management
management
§ Developed infrastructure for
organic growth
organic growth
§ Built out warehouse lending
platform and doubled deposit and
loan portfolio
platform and doubled deposit and
loan portfolio
§ Completed acquisitions:
– ISN Bank (FDIC-assisted)
– USA Bank (FDIC-assisted)
– Berkshire Bancorp (Whole
bank)
bank)
§ Recruited proven lending
teams
teams
§ Built out Consumer and Multi-
family lending platforms
family lending platforms
§ De Novo expansion; 4-6 sales
offices per year
offices per year
§ 10%+ ROE; ~1% ROA
§ Announced acquisitions:
– Acacia Federal Savings
– CMS Bancorp
§ Target $5B institution by
2014
2014
2009
Assets: $350M
Equity: $22M
2010
Assets: $1.4B
Equity: $105M
2011
Assets: $2.1B
Equity: $148M
2012(1)
Assets: ~$3.0B
Equity: ~$300M
(1) Pro forma assets assumes $2.7 billion of estimated assets for Customers Bancorp as of Q3 2012, plus ~$490 million of assets expected to be acquired through the Acacia Federal Savings acquisition
that is expected to close in Q4 2012, plus ~$247 million of assets from the CMS Bancorp acquisition expected to close in Q2 2013. Pro forma equity includes Q2 2012 actual equity of $158 million, plus
~$14 million of net proceeds raised after Q2 2012, plus assumed net proceeds of $47.5 million from this private placement, plus shares issued to selling shareholders of Acacia Federal Savings Bank,
expected to close in Q4 2012, plus estimated earnings for the second half of 2012 (Q3 2012 earnings per the Company’s 8-K filed on 8/24/2012).

§ Superior credit quality
§ Revenues = 2x Expenses; resulting in 0.90% to 1.00% ROA and
double digit ROE
double digit ROE
§ Focus on doing a few things very well
§ Strong risk management Culture
– ERM (Enterprise Risk Management) process in place
– Extensive review of all risks at board and management levels
with best practices in corporate governance standards
with best practices in corporate governance standards
§ Solid capital levels to support risk and growth
Critical Success Factors

Concierge Banking
§ Takes banker to the
customer’s home or
office, 12 hours a
day, 7 days a week
customer’s home or
office, 12 hours a
day, 7 days a week
§ Appointment banking
approach
approach
§ Customer access to
private bankers
private bankers
§ “Virtual Branches”
out of sales offices
out of sales offices
Sales Force
§ Experienced
bankers who own
a portfolio of
customers
bankers who own
a portfolio of
customers
§ Customer
acquisition &
retention strongly
incentivized
acquisition &
retention strongly
incentivized
Pricing
§ Low cost banking
model allows for more
pricing flexibility
model allows for more
pricing flexibility
§ Significantly lower
overhead costs vs. a
traditional branch
overhead costs vs. a
traditional branch
§ Pricing/profitability
measured across
relationship
measured across
relationship
Technology
§ Implementation of
technology suite allows
for unique product
offerings:
technology suite allows
for unique product
offerings:
§ Remote account
opening & deposit
capture
opening & deposit
capture
§ Internet/mobile
banking
banking
§ Free ATM
deployment in U.S.
deployment in U.S.
Deposit Strategy - High Touch, High Tech
§ Organic deposit growth of 100% over past 3 years
Cost of Funds
Plus: Branch Operating
Expense
Expense
Less: Fees
= All-in Cost < Competitors
Goal: All-in cost less than wholesale funding cost over the long-term

CAGR: 97%
CAGR: 99%
CAGR: 50%
Delivering Organic Growth - Deposits
Source: Company documents
Deposit Growth
DDA Growth
Deposits per Branch
Cost of Deposits

Lending Strategy - Local Lending Plus Specialty Niche
Commercial Lending
Small Business
§ Target companies with less than
$5.0 million annual revenue
$5.0 million annual revenue
§ Loans (incl. SBA loans)
originated by branch network
and specialist small business
relationship managers
originated by branch network
and specialist small business
relationship managers
§ Warehouse Lending
§ Diversify earning assets and
revenue stream
revenue stream
§ Lower interest rate and credit
risk line of business
risk line of business
Business Banking
§ Target companies with up to
$100 million annual revenues
$100 million annual revenues
§ Very experienced teams
Multifamily & CRE
§ Focus Markets: New York &
Philadelphia MSAs
Philadelphia MSAs
§ Average Loan Size: $7.0 million
Real Estate Secured Lending
§ Select home equity and
residential mortgage
residential mortgage
§ Conservative underwriting
standards (>700 FICO score)
standards (>700 FICO score)
§ No indirect auto, unsecured
loans or credit cards
loans or credit cards
Consumer Lending
Specialty Lending

Summary
Delivering Organic Growth - Loans
($ in millions)
Loans HFI (excludes Warehouse Loans)*
Source: Company documents
*Average Balance
(1) Includes held for sale loans
(2) Represents average quarterly balance
$509
$513
$552
$696
$772
$856
§ Experienced C&I team acquired from
local and regional banks
local and regional banks
§ Centralized credit committee approval
for all loans
for all loans
§ CRE from C&I customers included in
CRE loans
CRE loans
§ Average C&I loan < $1 million
§ Average loans per relationship manager
only $23 million; full capacity in about
$50 million
only $23 million; full capacity in about
$50 million
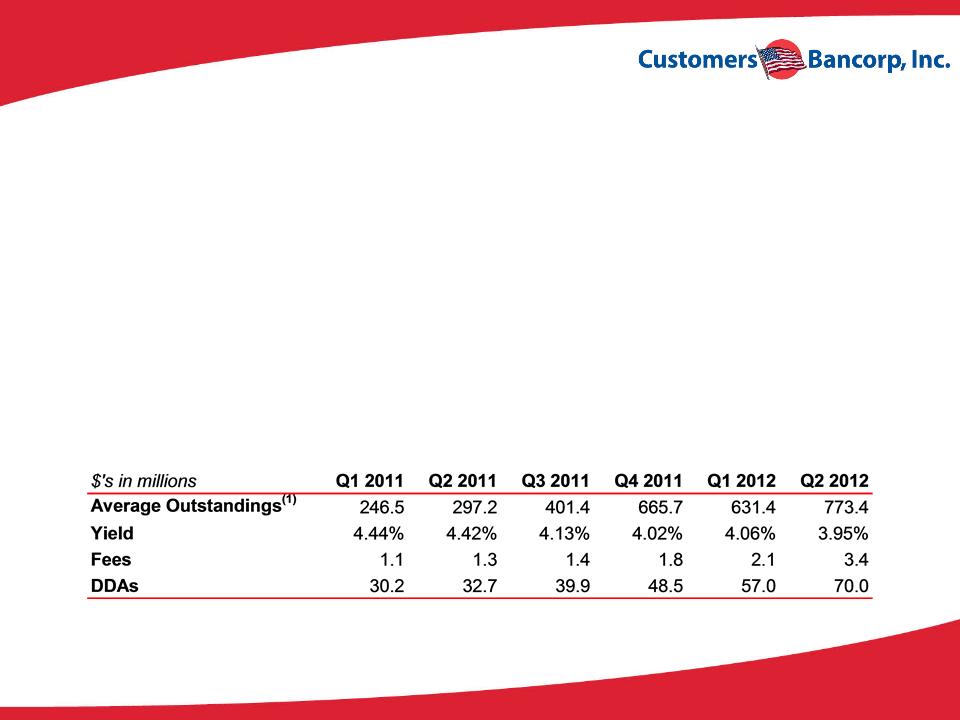
Top 10 Warehouse Lending Platform
§ Exit by larger players has created opportunity to provide liquidity at attractive spreads
§ Warehouse segment led by professionals with over 25+ years experience in the sector
§ Low-risk lending business due to high quality collateral and no put back risk to Customers
– No losses since inception in 2009
§ Steady growth over the past two years; currently have approximately 75 clients
– Deposit relationship and source of fee income
§ Longer term goal (2-3 years) for warehouse lending to comprise up to 25% or less of total assets
§ No negative operating leverage if mortgage market were to weaken
Source: Company documents
(1) Average outstanding for the respective quarter

Strong Asset Quality
($ in millions)
Non-Covered Nonperforming Assets
Source: SNL Financial and Company data
* Reported nonperforming non-covered by FDIC assets (nonaccrual loans and leases, renegotiated loans and leases, and real estate owned) as a percent of assets
§ Clean bank with strong risk management - less than 1% of NPAs from non-FDIC covered and acquired
loans
loans
§ Proactively addressing all credit issues from legacy and acquired portfolios
($ in millions)
Originated Nonperforming Assets
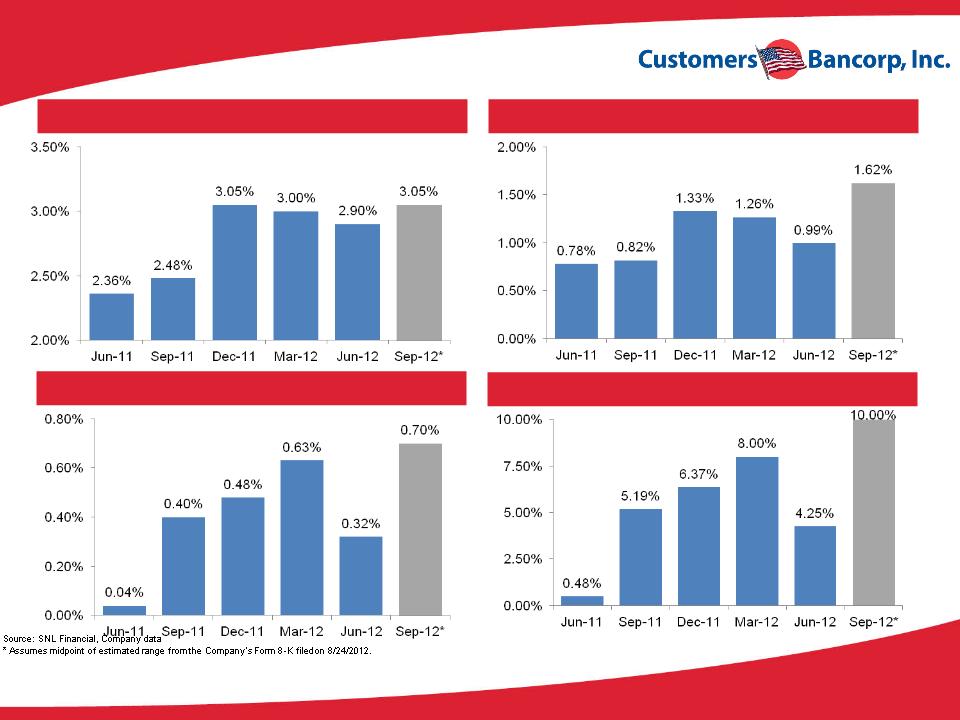
Key Financial Targets
|
Criteria
|
Target
|
Q3 2012 Pre-
Release (1) |
Q4 2012
Target |
|
Return on Equity
|
10% or greater
|
10%
|
10% or greater
|
|
Return on Assets
|
.90% to 1.00%
|
.70%
|
.90% to 1.00%
|
|
Net Interest Margin
|
3.00% to 3.25%
|
3.05%
|
3.00% to 3.25%
|
|
Efficiency Ratio
|
50%
|
60%
|
50%
|
|
Loan-to-Deposit
|
90% to 100%
|
100%
|
90% to 100%
|
Source: Company data
1. Represents mid point of the Company’s guidance per Form 8-K filed on 8/24/2012.

Strong Income Growth
Revenue Growth (2)
(1)Adjusted PTPP earnings is calculated as: Core income + estimated income taxes at 35% + provision expense. PTPP excludes non-recurring income and expense items.
(2)Revenue = Net interest income before provision plus noninterest income.
(3)Represents gross loans held for investment divided by total deposits.
(4)Core income, on a diluted per-share basis. Core income is net income before extraordinary item, less net income attributable to noncontrolling interest, the after-tax portion of income from investment
(non-trading) securities and nonrecurring items. The assumed tax rate is 35%.
(non-trading) securities and nonrecurring items. The assumed tax rate is 35%.
Adjusted PTPP Earnings (1)
Core EPS (4)
Loan-to-Deposit (%) (3)
Increasing Profitability
Net Interest Margin (%)
(1)Adjusted PTPP Earnings is calculated as: Core income + estimated income taxes at 35% + provision expense. PTPP excludes non-recurring income and expense items.
(2)Core income is net income before extraordinary item, less net income attributable to noncontrolling interest, the after-tax portion of income from investment (non-trading) securities and nonrecurring items. The
assumed tax rate is 35%.
assumed tax rate is 35%.
(3)Core income is net income before extraordinary item, less net income attributable to noncontrolling interest, the after-tax portion of income from investment (non-trading) securities and nonrecurring items. The
assumed tax rate is 35%.
assumed tax rate is 35%.
Core ROAA (%) (2)
Core ROAE (%) (3)
Adjusted PTPP/Average Assets (1)

Enhancing Shareholder Value
Source: SNL Financial, Company documents
*Pro-forma $50mm capital raise at $14.50 per share (midpoint of proposed price range). Also, includes ~$15mm additional capital raise at $13.99 per share in Q3 2012 and Q3 2012 net income of $4.35M
(midpoint of management guidance per Form 8-K filing on 8/24/2012).
(midpoint of management guidance per Form 8-K filing on 8/24/2012).
1. Based on preliminary analysis of transaction, management expects to record a bargain purchase gain of ~$8.0 to ~$10.0 million. Estimated range also based on the assumption that Customers issues
common stock to Acacia shareholders at 1.15x BV in the month end prior to the close, which is expected to be in Q4 2012.
common stock to Acacia shareholders at 1.15x BV in the month end prior to the close, which is expected to be in Q4 2012.
§ 43% increase in tangible book value per share in the past 8 quarters
§ Acacia acquisition is expected to grow tangible book value by ~$0.92 per share (1)
43%
BV/Share
$9.66
$12.52
$12.61
$13.02
$13.99
$15.12
$14.98
Estimated Acacia Acquisition Impact

§ Completed two FDIC-assisted acquisitions with total assets of ~$300 million and pre-tax total
bargain purchase gain of ~$40M
bargain purchase gain of ~$40M
§ Completed one $135 million asset whole bank deal accretive to earnings and book value within
three months
three months
§ Announced two other accretive acquisitions:
Experienced Acquirer
|
Target
|
Purchase
Price/ BV |
Valuation
of Customers Shares |
Expected
Bargain Purchase After-Tax Gain |
Notes
|
|
Acacia Federal Savings
Bank § Expected close: Q4 2012
§ ~$490M assets acquired
|
0.56x
|
1.15x BV
|
$8-$10M
|
No nonperformers/high
risk loans acquired No material deal charges
Immediately accretive to
BV, capital and earnings |
|
CMS Bancorp
§ Expected close: Q2 2013
§ ~$247M asset bank
|
0.95x
|
1.25x BV
|
NA
|
Accretive to capital,
earnings, and book value within 6 months |
Acquisition Opportunities
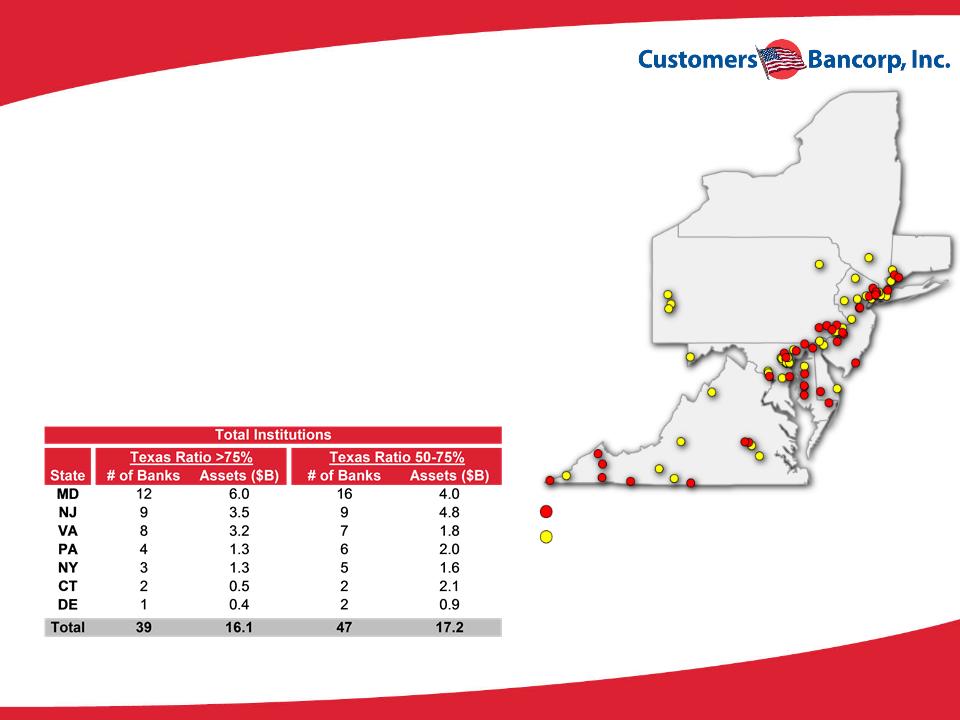
§ 86 stressed banks with ~$33 billion in assets in our target
markets
markets
– Significantly larger pool of smaller healthy banks that
cannot generate double digit ROE
cannot generate double digit ROE
§ Limited competition to acquire these banks
§ Disciplined M&A strategy focused on TBV, earnings, and
capital accretion within 12 months of closing
capital accretion within 12 months of closing
Source: SNL Financial
Note: Data for all institutions headquartered in CT, CE, MD, NJ, NY, PA, and VA with assets less than $2B
Texas Ratio >75%
Texas Ratio 50-75%

Appendix

Asset Quality
Source: Company documents
Note: Held-for-Sale Loan balance is $284 million as of Q2 2012
(1) Includes Consumer, Mortgage and Manufactured loan types
Asset Quality by Loan Type: 6/30/12