Attached files
| file | filename |
|---|---|
| 8-K - FORM 8-K - U.S. SILICA HOLDINGS, INC. | d403965d8k.htm |
 Investor Presentation
August 2012
U.S. Silica
U.S. Silica
Exhibit 99.1 |
 Disclaimers
2
This presentation contains forward-looking statements that reflect, when made,
our current views with respect to current events and financial performance.
Such forward-looking statements are subject to many risks, uncertainties
and factors relating to our operations and business environment, which may
cause our actual results to be materially different from any future results,
express or implied, by such forward-looking statements. All statements that
address future operating, financial or business performance or our strategies or
expectations are forward-looking statements. In some cases, you can
identify these statements by forward- looking words such as
“may,” “might,”
“will,”
“should,”
“expects,”
“plans,”
“anticipates,”
“believes,”
“estimates,”
“predicts,”
“projects,”
“potential,”
“outlook”
or “continue,”
and other
comparable terminology. Factors that could cause actual results to differ
materially from these forward-looking statements include, but are not
limited to, those discussed in our filings with the Securities and Exchange
Commission, including our most recent Annual Report on Form 10-K and our
Quarterly Reports on Form 10-Q. New risks and uncertainties arise from time to
time, and it is impossible for us to predict these events or how
they may affect us. We disclaim
any intention or obligation to update or revise any forward-looking statements,
whether as a result of new information, future events and/or otherwise,
except to the extent required by law. This presentation includes certain
non-GAAP financial measures, including Adjusted EBITDA and Total Segment
Contribution Margin. These measures should be considered supplemental to and
not a substitute for financial information prepared in accordance with GAAP and may
differ from similarly titled measures used by others. For a reconciliation of such
measures to the most directly comparable GAAP term, please see Appendix A
to this presentation. |
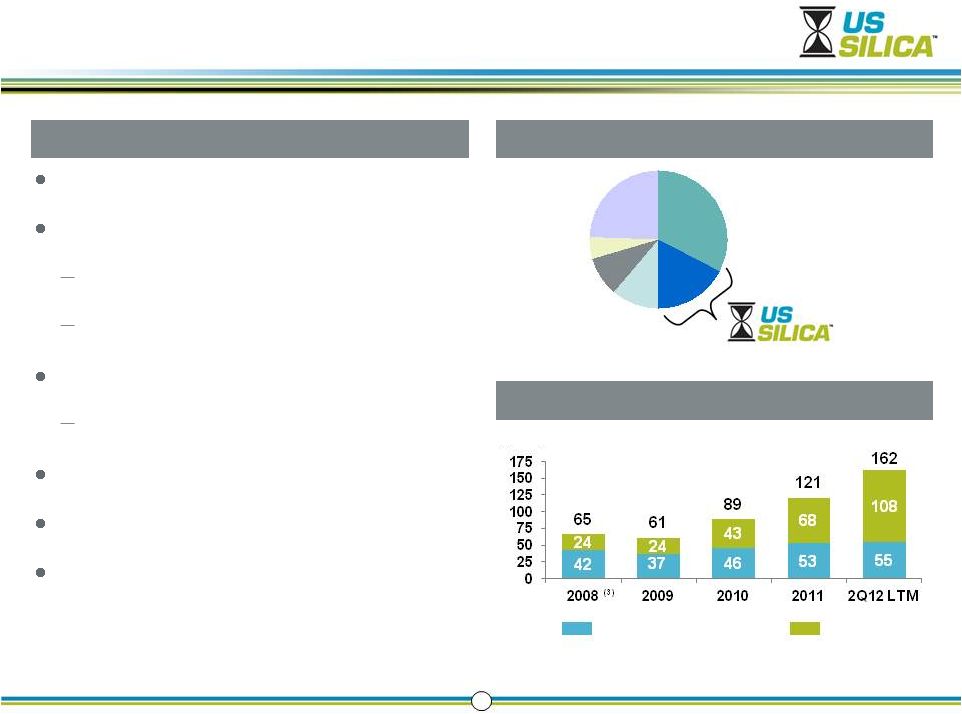 Commercial Silica Market Share
U.S. Silica is Attractively Positioned
Leading industrial minerals supplier
Over 200 products and 1,400 customers
Oil & Gas Proppants: Frac sand
Industrial & Specialty: Glass, coatings, foundry
13 facilities, many over 100 years old
Flagship Ottawa site home of ‘Ottawa White’
313 million tons of high quality reserves
6.7 million tons sold in 2Q12 LTM
2Q12 LTM revenues of $364 million and 2Q12
LTM adjusted EBITDA of $124 million
(1)
3
Company Profile
Segment
Contribution
Margin
(1)
(2)
(1)
See Appendix A for reconciliations to GAAP
(2)
Totals may not equal segments due to rounding
(3)
Includes combined results for our predecessors
Source:
Company Estimates
($MM)
Industrial and Specialty
Oil and Gas
Other |
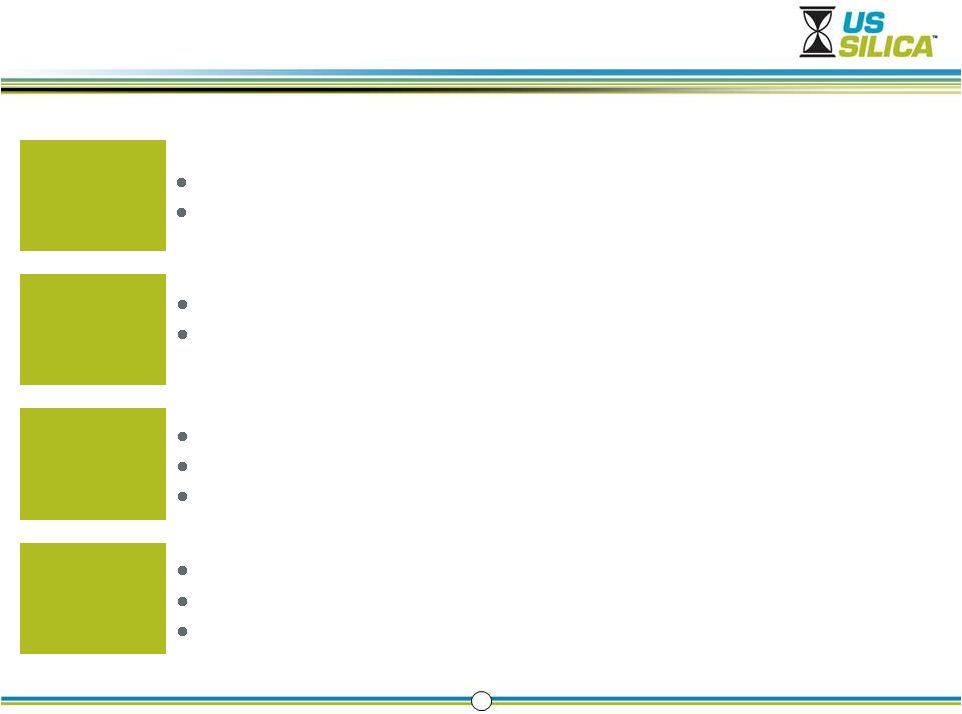 4
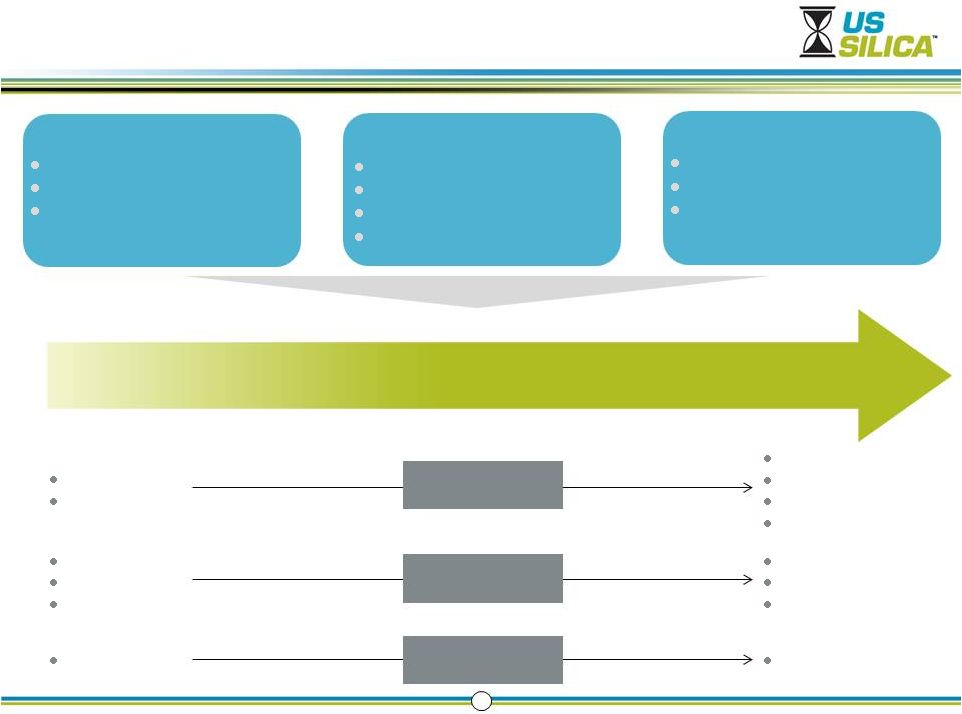
Rapid Demand
Growth
Shale drilling has revolutionized U.S. energy supply
Proppant volume demand growing faster than shale drilling activity
Supply is
Constrained
Large API spec reserves and permission to operate are barriers to
entry Complex logistics and access to industrial end markets are
requirements for a low cost structure and success
Sustainable
Competitive
Advantages
146 million tons of API spec frac sand reserves
Integrated supply chain with access to all major shale basins
Significant cost advantage due to heritage infrastructure
Line of Site
Organic Growth
Transforming the ISP segment by growing our specialty and performance
products New resin coated sand (“RCS”) facility targeted for 1Q
2013 Additional Greenfield raw sand facility targeted for 2Q 2013
Leadership and Growth in a Transformative Market |
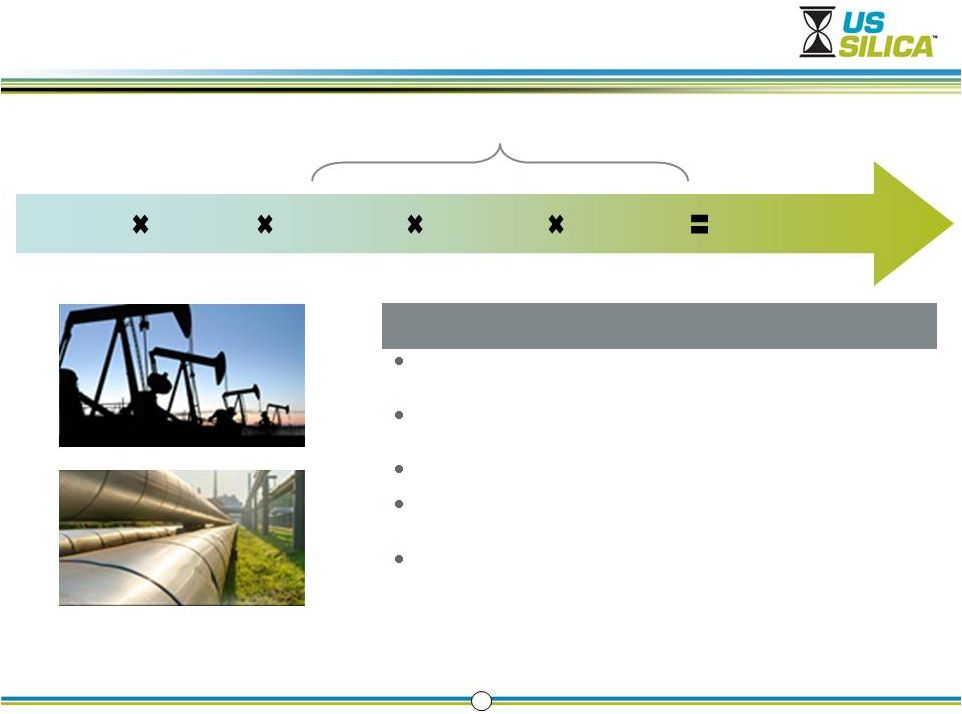 Frac
Sand Demand Outstrips Drilling Activity 5
(1)
The Freedonia Group, Inc. –
Well Stimulation Materials, March 2012 and World Well Stimulation Materials, April
2011 Horizontal
Rig Count
Wells
per Rig
Stages per
Lateral
Proppant Demand
Proppant
per Stage
Technology Enabled
Lateral
Length
Proppant growth has recently outpaced rig count growth due to
technological advances
For
example,
proppant
volumes
grew
31%
in
2011
versus
prior
year
while
horizontal
rig
count
grew
21%
(1)
Wells drilled per rig increased as operators found new efficiencies
Laterals grew longer and stages increased as fracturing technology
advanced
Proppant per stage grew denser as operators experimented with new well
designs
Growth Drivers |
 New
Projects Face High Hurdles 6
Barriers to Entry
Sphericity, solubility,
size, crush strength
(14 API specifications)
Large-Scale High
Quality Reserves
High
Quality,
Cost
Effective
Supply
Rail access to
major basins
Long approval
process (1 –
3 years)
Federal / state / local
mining, air, water,
reclamation permits
Premium on know-
how and expertise
Logistics and
On-Site
Infrastructure
Permission
and
Experience to
Operate
Diversified
Customers
Ability
to “spec-in”
to industrial
customer
production
processes
Barriers to Success |
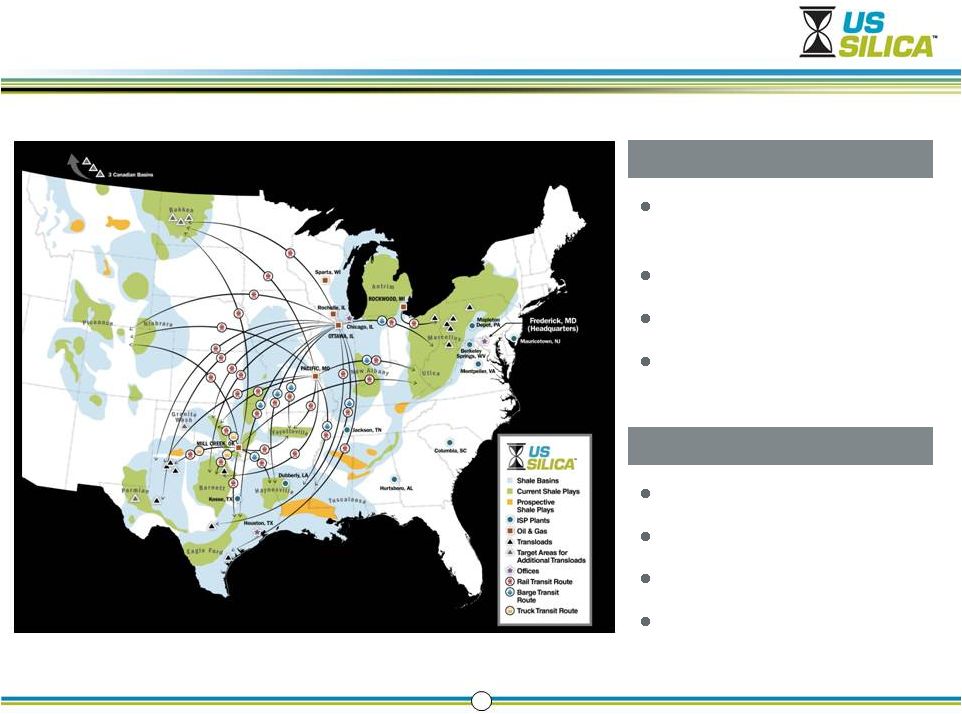 Railroad access on BNSF,
Union Pacific, CN, and CSX
Barge access
13 in-basin transloads
6 to 8 new transloads being
added in key basins
Transportation Assets
Differentiated Footprint and Logistics Capability
7
Scale
Reliability
Flexibility
Cost effectiveness
U.S. Silica Advantages
Right Product, Right Place, Right Time |
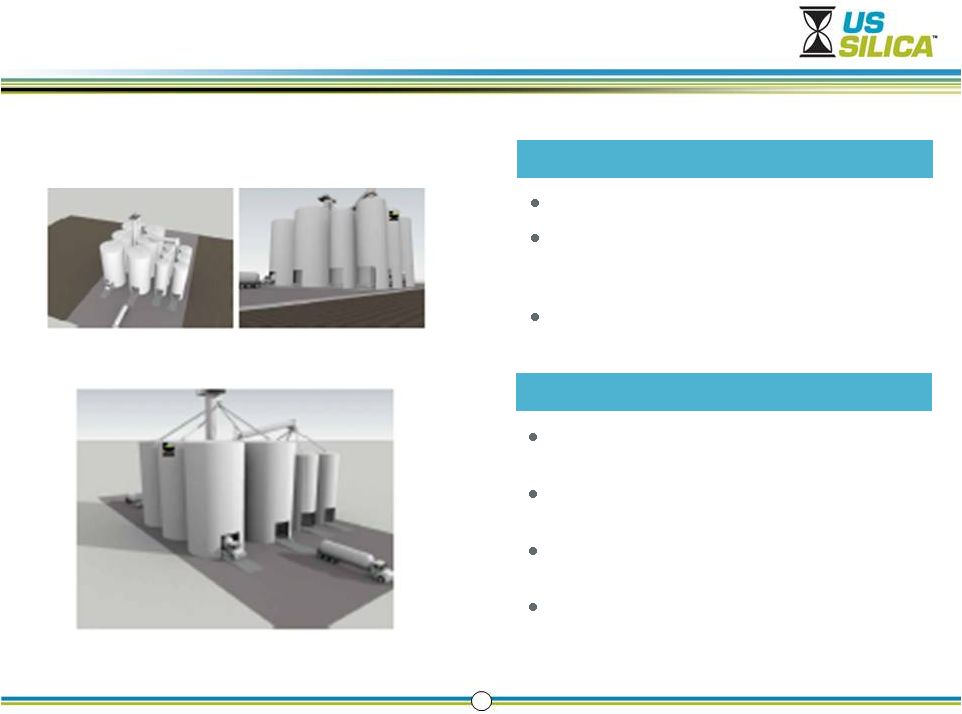 Transloads are a Highly Efficient Logistics Solution
8
Rail terminal located in the basin
Proppant is unloaded from railcars and stored until it
can be transferred to trucks for delivery to the
wellhead
Includes storage silos, equipment for
loading/unloading and local staff
What is a transload?
Dedicated storage allows us to control quality further
into the supply chain
Vertical silos, gravity fed loadout and automated
billing drive a 6-8 minute turnaround time for trucks
Track length allows unit train deliveries which are
both faster and more cost effective
Large storage capacity creates an inventory buffer
between plant and well-head which reduces
disruptions and enables high margin ‘spot sales’
Our design offers key advantages |
 USS (Primary Frac
Sand Plants)
Estimated New Project
9
Plant Production Cost Per Ton
(1)
U.S. Silica Primary Frac Plants vs. New Project
Royalties
Lack of onsite
rail
Yield loss due to
lack of industrial
customers
Scale
(%)
Adjusted EBITDA Margin
(4)
Source:
Company Estimates
(1)
Excludes delivery costs
(2)
Represents the U.S. Silica four principal plants used for frac sand, and excludes
the other facilities, which have higher plant production costs (3)
Assumes new projects are built for frac sand product
(4)
See Appendix A for reconciliation to GAAP
(3)
(2)
Structural Cost Advantage Within Industry
0
10
20
30
40
2008
2009
2010
2011
2Q12
LTM
21.2
26.1
29.5
31.7
34.2 |
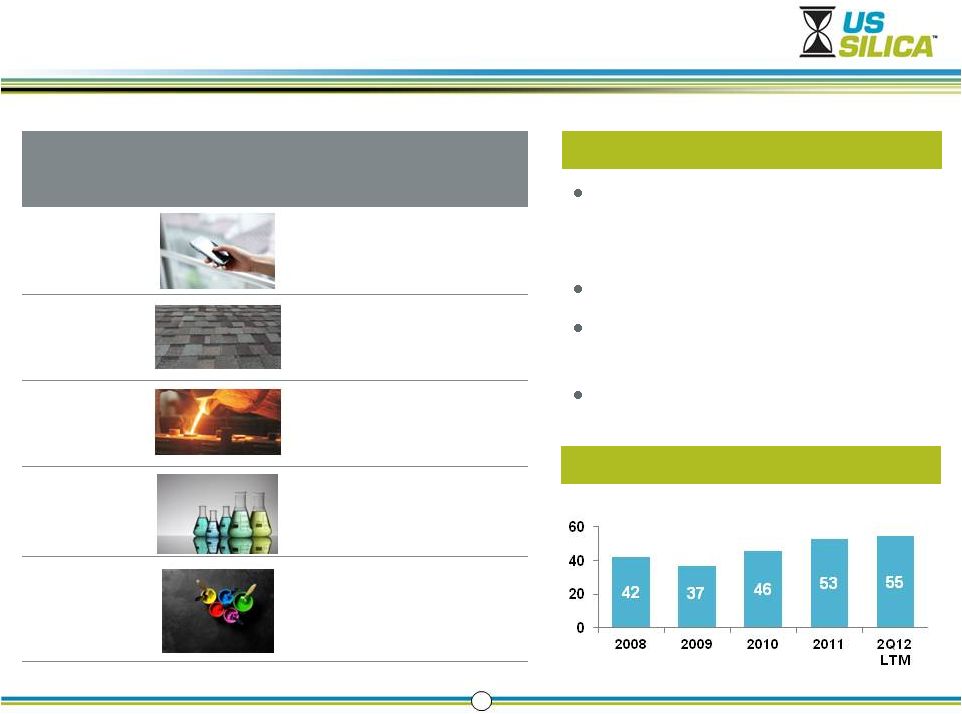 10
End Market
Applications
USS market
position
Glass
Smartphones, tablets,
containers,
automotive glass,
fiberglass
#1 or #2
supplier
Building
Products
Mortars and grouts,
specialty cements,
roofing shingles,
insulation
#1or #2 supplier
Foundry
Molds for high
temperature castings
and metal casting
products
#3 supplier
Chemicals
Silicon-based
chemicals used in
food processing,
detergents and
polymer additives
#1 or #2 supplier
Fillers and
Extenders
Performance
coatings:
architectural,
industrial and traffic
paints, EMC and
silicone rubber
#1 or #2 supplier
in strategic
markets
USS’s multiple plants provide supply
redundancy and low transportation costs for
customers
Often a single source supplier
Spec’d in to customer formulas due to unique
silica characteristics
Low customer turnover
Drivers of Stability
Stable and Growing Profitability
(1)
Includes combined results for our predecessors
(Segment Contribution Margin, in $MM)
(1)
Irreplaceable Industrial & Specialty Market Position
|
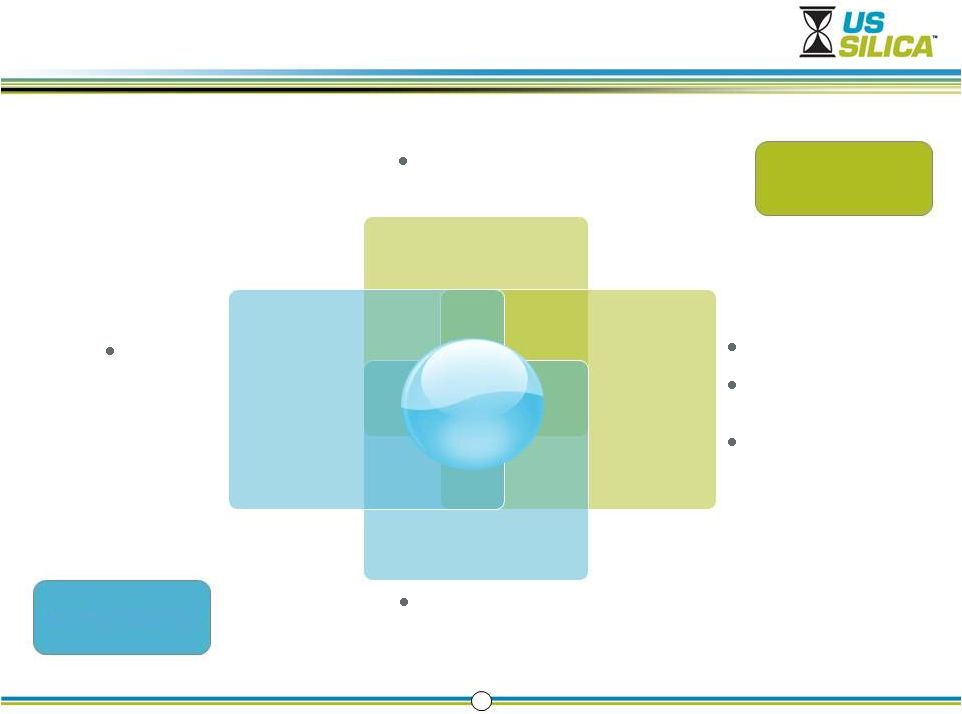
 11
Whole Grain
Bulk
Ground
High Purity
Functional surfaces
Specialty packaging
Automotive Glass
Industrial Paints
Roofing Shingles
High end electronics
Polymers
Specialty coatings
~300 miles
Global
Transforming the ISP Segment
Shipping radius
Uses
Characteristics
$s per ton
$s per pound
Growing our Specialty and Performance Products
Implement New Technology
Specialty deposits
Enhanced processing
Investing in new production
capability for specialized
applications
Enhance R&D
New Technical Director
Product Development capability
State-of-the-art lab
Customer technical support
Invest in Talent
New VP/GM
Market Development team
Technical Sales capability |
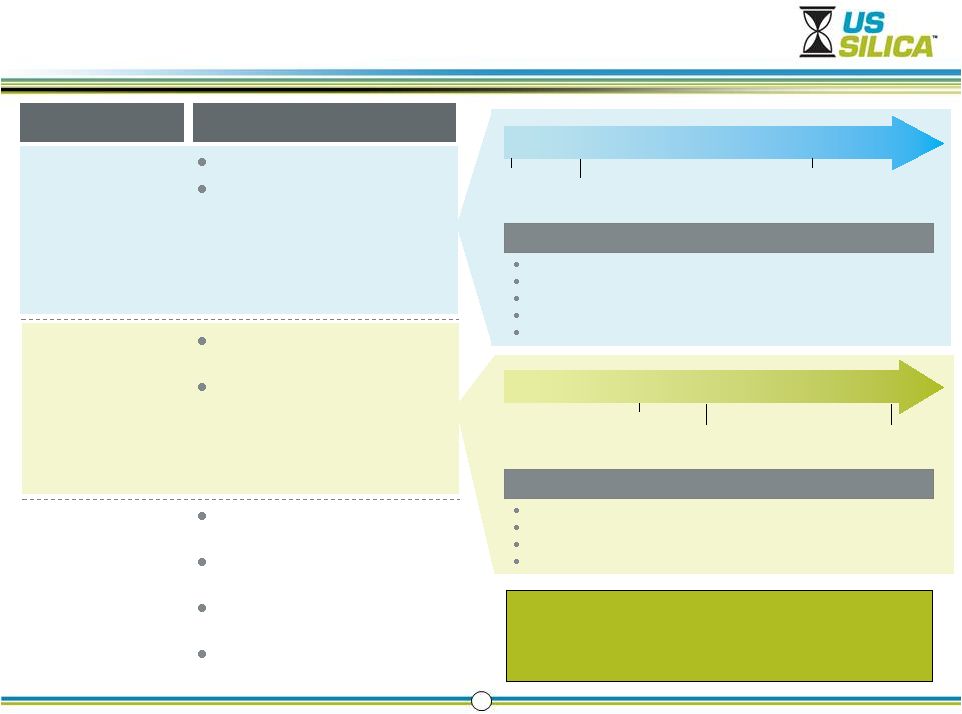 Line-of-Sight Oil & Gas Organic Growth Elements
12
Initiatives
Description
1Q 2013:
Rochelle Resin-
Coated Proppant
(RCS)
Phase I Capacity: 200 k tons
Phase I Capital: $42-$44
million
2Q 2013: Sparta
Greenfield Mine
Phase I Capacity: 750-850 k
tons
Phase I Capital: $50-$60
million
Potential Future
Initiatives
(2013+)
Phase II of resin coating
expansion
Phase II of Sparta Greenfield
project
Additional Wisconsin
Greenfield projects
International growth
All Permits Received
1Q12
Start Up
1Q2013
Break
Ground
4Q11
RCS Timeline
Sparta Timeline
U.S. Silica’s RCS Highlights
Experienced, best-in-class team
Access to high quality coarse substrate required for oil and liquid rich
basins Located near our Ottawa facility to reduce substrate shipping
costs Access to two class one railroads and barging for outbound shipping
Infrastructure allows us to double production capacity of plant (Phase
II) U.S. Silica Sparta Highlights
38M tons of coarse, northern white reserves
Received all necessary permits to begin construction in January 2012
On-site access to class one railroad
Infrastructure allows us to double production capacity of plant (Phase II)
All Permits Received
3Q12
Site Development and
Begin Construction
2Q12
Start Up
2Q13
Combined RCS & Sparta EBITDA: Expect annualized run
rate of $40MM exiting 2013, ramping up to a run rate of
$65MM exiting 2014. Expect combined EBITDA
contribution of $50-60MM in 2014. |
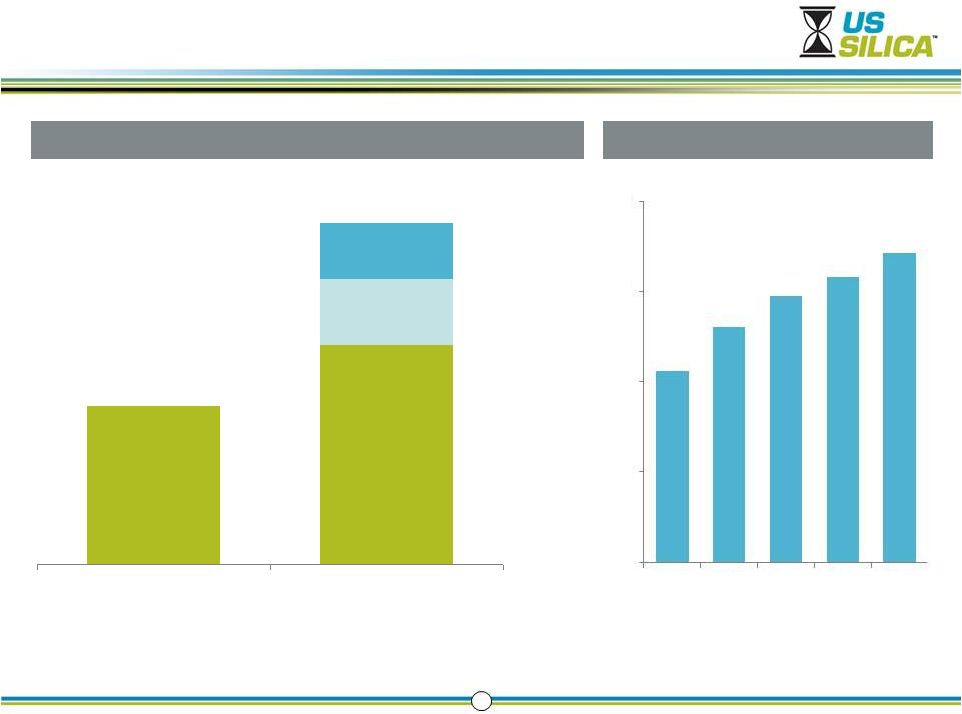
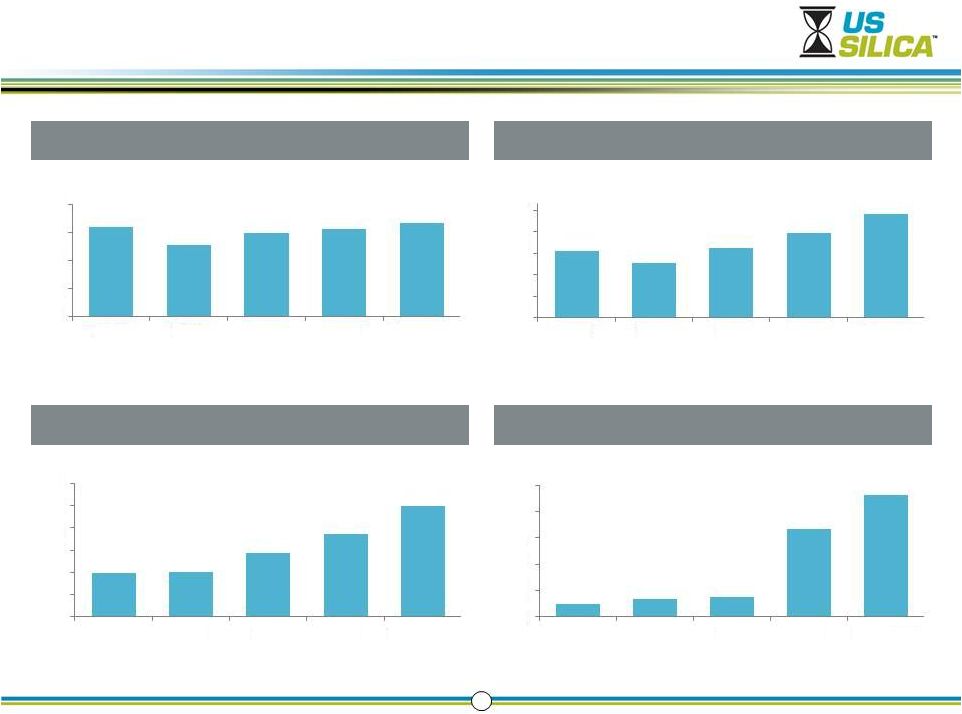 Historical Financial Summary
13
($MM)
Adjusted EBITDA
(1)
($MM)
Volume
Revenue
Capital Expenditures
($MM)
(MM Tons)
(1)
See Appendix A for GAAP reconciliation
6.4
5.1
6.0
6.3
6.7
0.0
2.0
4.0
6.0
8.0
2008
2009
2010
2011
2Q12 LTM
234
192
245
296
364
0
75
150
225
300
375
2008
2009
2010
2011
2Q12 LTM
10
13
15
67
92
0
20
40
60
80
100
2008
2009
2010
2011
2Q12 LTM
50
50
72
94
124
0
25
50
75
100
125
150
2008
2009
2010
2011
2Q12 LTM |
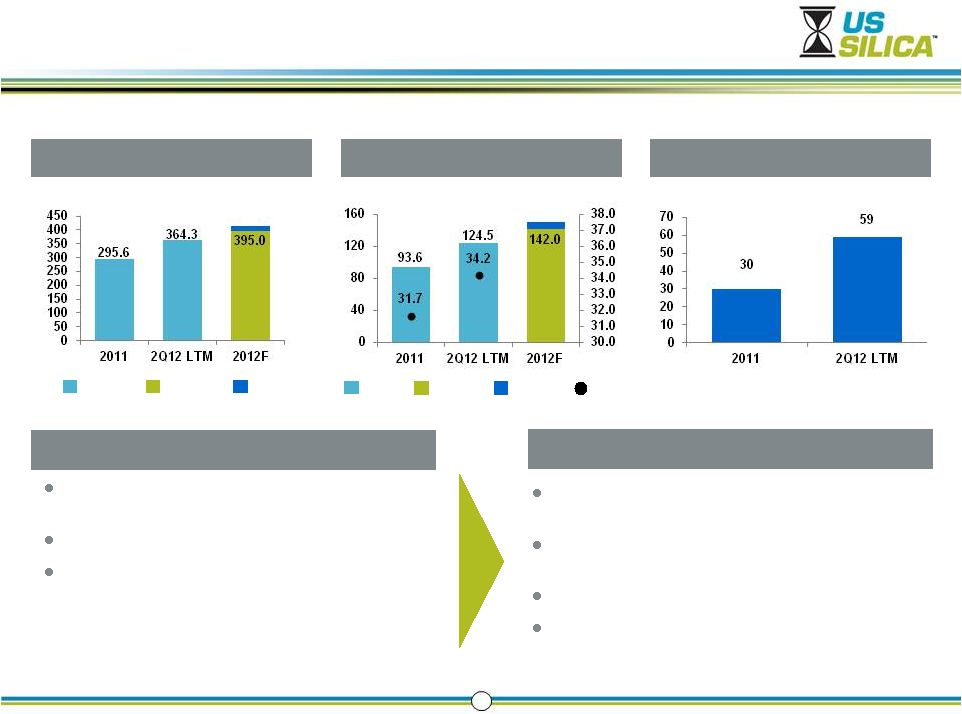 Low
End Guidance
2012 Performance and Momentum
14
Revenue
(1)
($MM)
Adjusted EBITDA and Margin
(1) (2)
($MM)
Net Income
($MM)
Today
Revenue growth with mix shift to higher margin
oil and gas segment
Strong EBITDA growth and expanding margins
Sharply accelerating net income growth
55%+ expansion in oil and gas capacity
(19%+ expansion in total capacity)
Continued mix shift to oil and gas with
contribution margins >60%
RCS start up in 1Q 2013
Sparta start up in 2Q 2013
(1)
No guidance has been provided for 2012 FY Adjusted EBITDA Margin
(2)
See Appendix A for GAAP reconciliation
(%)
Margin
415.0
Revenue
High End
Guidance
150.0
EBITDA
Low End
Guidance
High End
Guidance
Momentum |
 Strong Balance Sheet to Fund Growth Initiatives
15
Summary Capitalization
(US$ in thousands)
6/30/2012
12/31/2011
Cash and Cash Equivalents
$ 102,625
$ 59,199
Asset-Based Revolving
Line-of-Credit
–
–
Term Loan Facility
257,400
257,857
Other Borrowings
3,932
3,932
Total Debt
261,332
261,789
Net Debt
158,707
203,433
Leverage (Debt/Adj EBITDA)
(1)
2.1x
2.8x
Net Leverage (Net Debt/Adj EBITDA)
(1)
1.3x
2.2x
$24.0MM capacity under
asset-based revolving
line-of-credit
Total liquidity of ~$126.6MM
for growth initiatives as of
June 30, 2012
(1)
Leverage and Net Leverage as of June 30, 2012 is calculated using LTM Adj EBITDA as
of the reporting date |
 16
Leadership and Growth in a Transformative Market
Rapid Demand Growth
Proppant demand growth outpacing
unprecedented shale drilling activity
Supply is Constrained
Barriers to entry and success will
continue to limit new capacity
Scale, asset efficiency and logistics
infrastructure create advantaged position
Line of Site Organic Growth
Near-term, high return growth projects
and ISP transformation
Sustainable Competitive Advantages |
 Appendix A
 |
 Reconciliation (Adjusted EBITDA to Net Income)
18
Reconciliation of Adjusted EBITDA
US$ in thousands
Three Months Ended
June 30, 2012
LTM
June 30, 2012
Net Income
19,451
58,951
Total Interest Expense, Net of Interest Income
3,383
14,835
Provisions of Taxes (Benefit)
7,287
17,360
Total Depreciation, Depletion and Amortization Expenses
5,974
22,610
EBITDA
36,095
113,756
Non-Cash Deductions, Losses and Charges
-
(526)
Non-Recurring Expenses (Income)
-
(2,467)
Transaction Expenses
-
156
Permitted Management Fees and Expenses
-
8,937
Non-Cash Incentive Compensation
493
2,234
Post-Employment Expenses (Excluding Service Costs)
404
1,442
Other Adjustments Allowable Under Existing Credit Agreements
120
1,277
Adjusted EBITDA
37,112
124,497
See following page for explanation of adjustments to EBITDA
(1)
(2)
(3)
(4)
(5)
(6)
(7) |
 Reconciliation (Adjusted EBITDA to Net Income)
19
(1) Includes non-cash deductions, losses and charges arising from adjustments
to estimates of a future litigation liability.
(2) Includes the gain on the sale of assets and non-recurring expenses related
to a former insurer’s liquidation.
(3) Includes fees and expenses related to the January 27, 2012 amendment of our
Term Loan Facility and Revolving Line-of-Credit.
(4) Includes fees and expenses paid to Golden Gate Capital for ongoing consulting
and management services
provided
pursuant
to
an
Advisory
Agreement
entered
into
in
connection
with
the
Golden
Gate
Capital
Acquisition;
this
Advisory
Agreement
was
terminated
in
connection
with
our
IPO.
(5) Includes vesting of incentive equity compensation issued to our
employees. (6) Includes net pension costs and net post-retirement costs
relating to pension and other post- retirement
benefit
obligations
during
the
applicable
period,
but
in
each
case
excluding
the
service
costs relating to benefits earned during such period.
(7) Reflects miscellaneous adjustments permitted under our existing credit
agreements, including such items as expenses related to reviewing growth
initiatives and potential acquisitions. |
 Non-GAAP Financial Performance Measures
20
Segment Contribution
Margin
The Company organizes its business into two reportable segments, Oil & Gas Proppants and
Industrial & Specialty Products, based on end markets. The reportable segments are
consistent with how management views the markets served by the Company and the financial
information reviewed by the chief operating decision maker. The Company manages its Oil &
Gas Proppants and Industrial & Specialty Products businesses as components of an enterprise for
which separate information is available and is evaluated regularly by the chief operating decision
maker in deciding how to allocate resources and assess performance. An operating
segment’s performance is primarily evaluated based on segment contribution margin, which excludes certain
corporate costs not associated with the operations of the segment. These corporate costs are
separately stated and include costs that are related to functional areas such as operations
management, corporate purchasing, accounting, treasury, information technology, legal and human
resources. The Company believes that segment contribution margin, as defined above, is an
appropriate measure for evaluating the operating performance of its segments. However, this
measure should be considered in addition to, not a substitute for, or superior to, income from
operations or other measures of financial performance prepared in accordance with generally
accepted accounting principles. For a reconciliation of segment contribution margin to its most
directly comparable GAAP financial measure, see Note T to our financial statements in our
Quarterly Report a Form 10-Q for quarter ended June 30, 2012.
Adjusted EBITDA
Adjusted EBITDA is not a measure of our financial performance or liquidity under GAAP
and should not be considered as an alternative to net income as a measure of operating
performance, cash flows from operating activities as a measure of liquidity or any other
performance measure derived in accordance with GAAP. Additionally, Adjusted EBITDA is not
intended to be a measure of free cash flow for management’s discretionary use, as it does not
consider certain cash requirements such as interest payments, tax payments and debt service
requirements. Adjusted EBITDA contains certain other limitations, including the failure to
reflect our cash expenditures, cash requirements for working capital needs and cash costs to
replace assets being depreciated and amortized, and excludes certain non-recurring charges that may recur
in the future. Management compensates for these limitations by relying primarily on our GAAP results
and by using Adjusted EBITDA only as a supplement. Our measure of Adjusted EBITDA is not
necessarily comparable to other similarly titled captions of other companies due to potential
inconsistencies in the methods of calculation. |