Attached files
| file | filename |
|---|---|
| 8-K - KAMAN CORPORATION FORM 8-K DATED AUGUST 14, 2012 - KAMAN Corp | form8-k.htm |

Kaman Corporation (NYSE: KAMN)
Investor Presentation
August 14, 2012

2
Investment Summary
§ Significant long-term organic growth opportunities in Aerospace
and Industrial Distribution
and Industrial Distribution
§ High margin Aerospace business benefiting from increasing
commercial aircraft build rates
commercial aircraft build rates
§ Select defense platforms ramping up
§ Industrial Distribution business growing organically, gaining scale
via acquisitions, and adding complementary product platforms
via acquisitions, and adding complementary product platforms
§ Investing in new product development and applications,
acquisitions and technology for long-term growth
acquisitions and technology for long-term growth
§ Strong balance sheet to drive growth and strategic initiatives
§ Experienced management team

3
§ Two core businesses
– Aerospace
• Manufacturer and subcontractor in the global commercial and military aerospace
and defense market
and defense market
• Diverse customer base of blue chip customers and government divisions
– Industrial Distribution
• Third largest distributor in the power transmission/motion control/fluid power
market
market
• Offers over four million SKUs to over 50K customers via 235 locations
§ Publicly listed on the NYSE with a market capitalization of $855 million as of
August 6, 2012
August 6, 2012
§ 2011 sales of $1.5 billion; 4,800 Employees
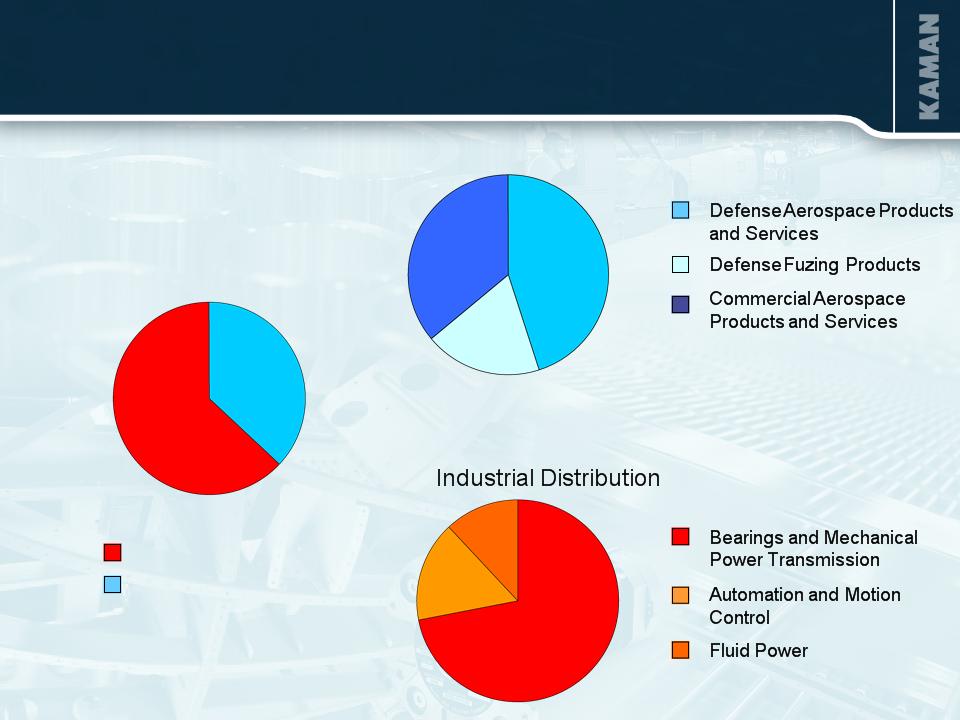
Kaman Corporation - Overview
(1) Adjusted - see non-GAAP reconciliation in Table 1 of this presentation
4
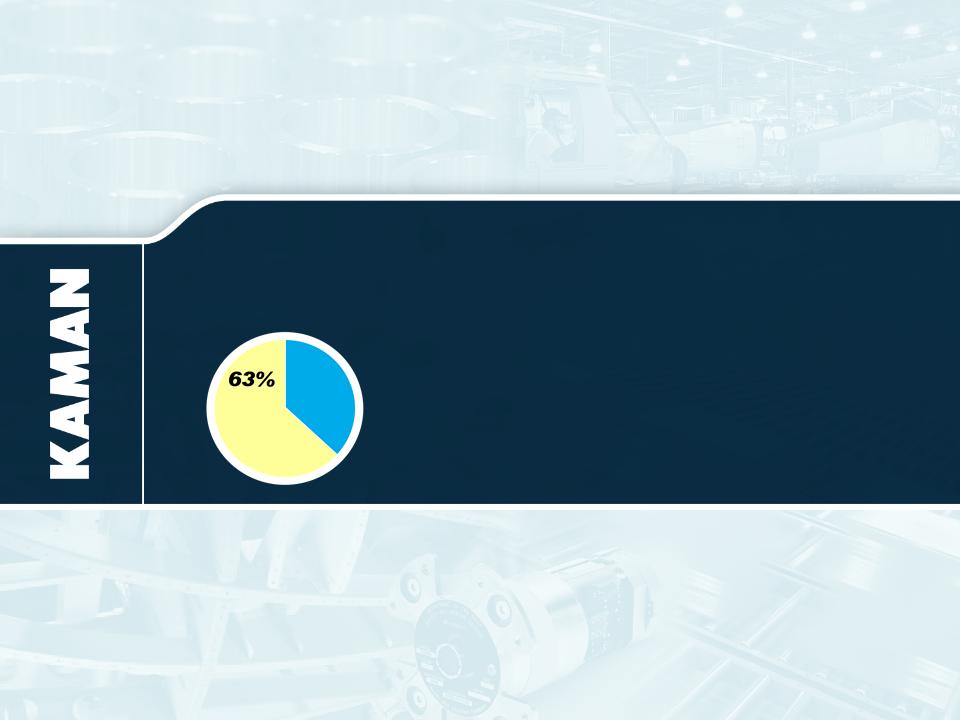
Consolidated
63%
37%
Industrial Distribution
Aerospace
72%
16%
12%
Aerospace
36%
45%
19%
Kaman Corporation - 2011 Sales Overview

5
(1) Adjusted - see non-GAAP reconciliation in Table 1 of this presentation
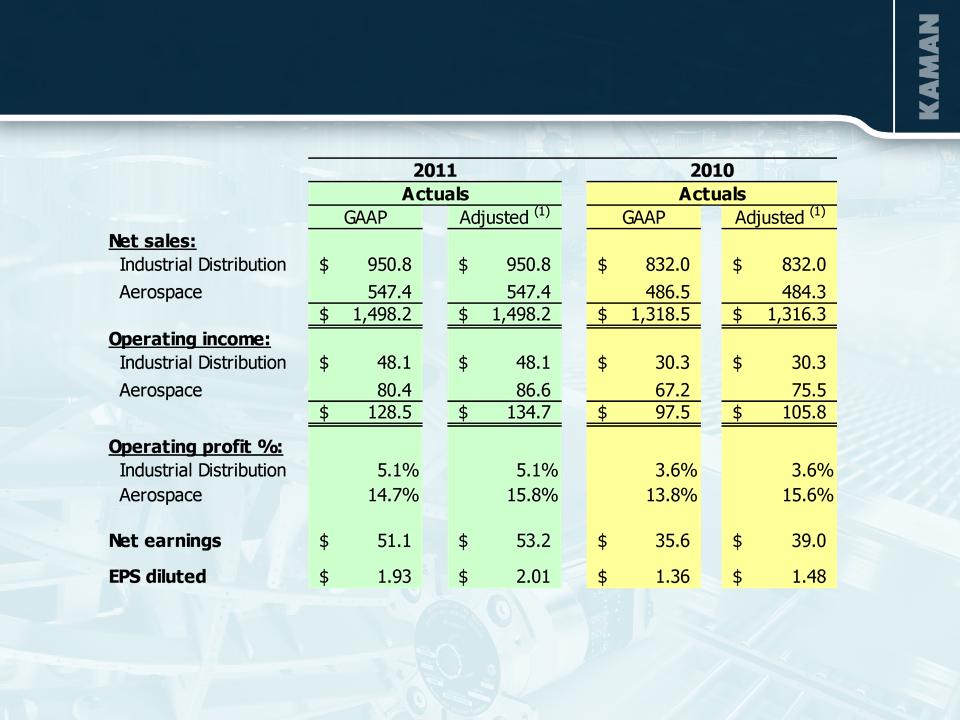
2011 Financial Highlights
§ Record net sales of $1.5 billion
- Industrial Distribution +14.3%
- Aerospace +12.5%
§ Operating profit was up $29 million(1) or 27%
- Industrial Distribution +59.1%
- Aerospace +14.7%(1)
§ Earnings per share +36% to $2.01(1)
- 2010 acquisitions added $0.20 to EPS

6
AEROSPACE
2011 Sales $547 Million
6

7
Aerospace
OBJECTIVE:
§ $1 billion in sales by 2014 / margins in the “high teens”
STRATEGY:
§ DEPTH - Size/financial strength to address larger, integrated work
packages from primes/OEMs and Tier 1s
packages from primes/OEMs and Tier 1s
§ DIVERSITY - Balance portfolio thru increased commercial content
§ DIFFERENTIATION - Continue to move from build-to-print to design-
and-build for higher margins and more defensible positions
and-build for higher margins and more defensible positions
§ DEVELOPMENT - Increased, focused investments in our people and
infrastructure to increase capabilities and drive improved performance
infrastructure to increase capabilities and drive improved performance

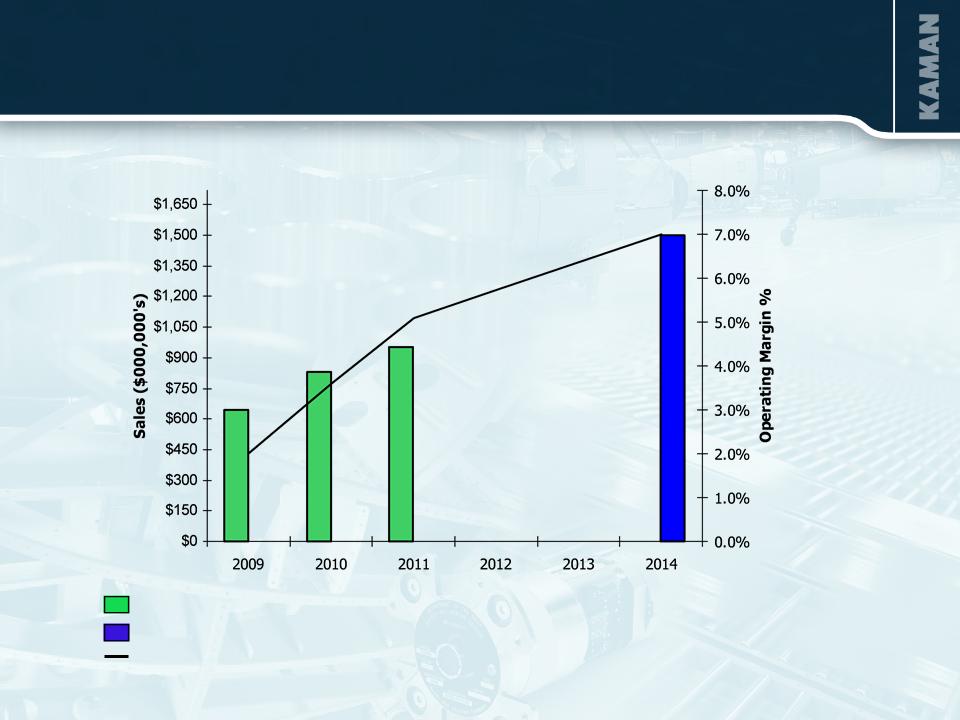
Aerospace - Progress Toward Objective
(1) Adjusted - see non-GAAP reconciliation in Table 1 of this presentation
Actual Sales
2014 Sales Objective
Operating margin,(1) (2009-2011 actuals ; 2012-2014 illustrate linear path to 2014 range,
actual results may vary)

9
Aerospace Acquisition Program 2008 - 2011
§ Three acquisitions:
- Brookhouse (U.K.)
- Global Aerosystems
- Vermont Composites
§ Annual sales acquired, $115 million
§ Average size, in sales, of $39 million
§ Average purchase price of $47 million, for a total of $140 million

10
Aerospace Business Drivers
§ Continued outsourcing trend by OEMs and Super Tier 1s to increase
flexibility and lower costs
flexibility and lower costs
§ High margin specialty bearing and aerostructure businesses
positioned to benefit from increased production rates at Boeing and
Airbus
positioned to benefit from increased production rates at Boeing and
Airbus
§ Defense platforms provide exposure to key vertical lift and reset
programs
programs
§ Legacy prime contractor capabilities provide attractive outsourcing
alternatives to today’s helicopter and fixed wing aircraft OEMs
alternatives to today’s helicopter and fixed wing aircraft OEMs

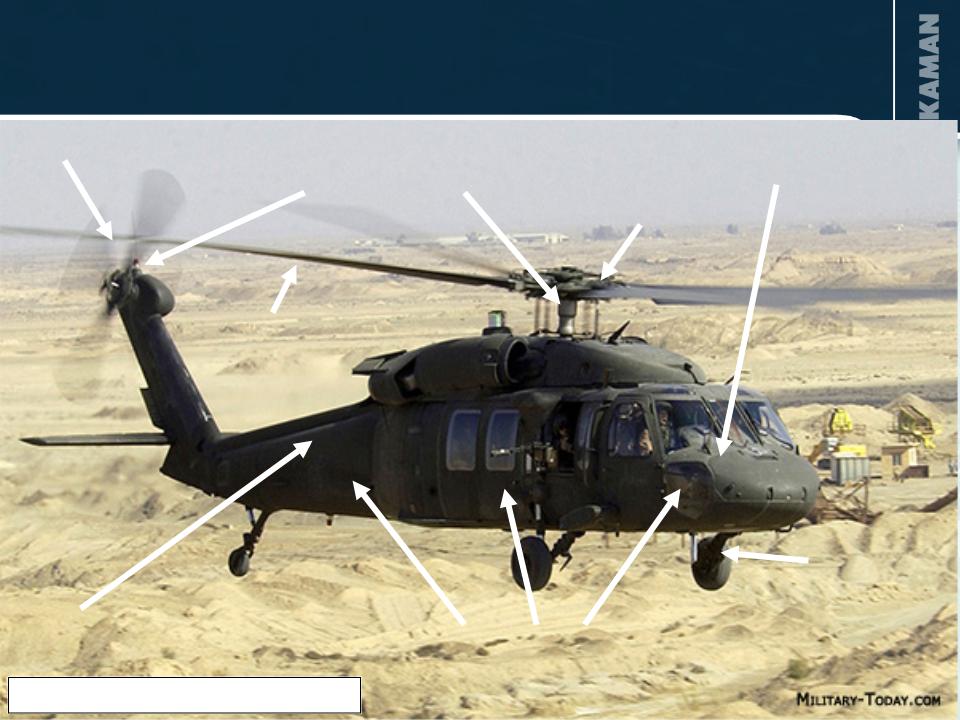
Fixed trailing edge
Fuel tank access doors
Top covers
Red denotes bearing products
Nose landing gear
Rudder
Main landing gear
Flaps
Horizontal stabilizer
Door assemblies
Engine/thrust reverser
Aircraft Programs/Capabilities
Flight controls
Doors
11
Manufacture of cockpit
Blade erosion coating
Manufacture and assembly
of tail rotor pylon
of tail rotor pylon
Manufacture, sub assembly
and joining of fuselage
and joining of fuselage
Blade manufacture,
repair and overhaul
repair and overhaul
Driveline couplings
Bushings
Flight control bearings
Aircraft Programs/Capabilities
Red denotes bearing products
12

§ Kaman/Lockheed have developed an unmanned
military version of the K-MAX helicopter
military version of the K-MAX helicopter
§ Two K-MAXs have been performing unmanned
cargo resupply missions in Afghanistan since
December 2011
cargo resupply missions in Afghanistan since
December 2011
- The aircraft have successfully delivered more than
1.6 million pounds of cargo in over 520 missions
1.6 million pounds of cargo in over 520 missions
- Demonstration deployment extended through
March 2013
§ Lockheed Martin awarded unmanned K-MAX
development contracts
development contracts
- $47 million Army contract to develop autonomous
technologies
technologies
- Office of Naval Research down select to integrate,
test and demonstrate autonomous system
technology
test and demonstrate autonomous system
technology
13
Unmanned K-MAX®

14
JPF Program
§ 23 Foreign Customers
§ Backlog through 2013
§ Kaman is sole source, negotiating four year follow-on contact

15
Aerospace - Budget Impact on Defense Programs
§ Defense programs less impacted by proposed budget cuts
– UH-60 BLACK HAWK - continued demand
– Joint Programmable Fuze - backlog into 2013, foreign demand, continued
sole source
sole source
– F-35 (Joint Strike Fighter) - incremental business at any production level
– A-10 - reset, new business
– AH-1Z - new business
– C-17 - firm backlog into 2013, potential for additional foreign orders,
revenue <$10 million per year
revenue <$10 million per year

16
|
|
Projected Deliveries
|
||||
|
|
2011
|
|
2015
|
|
% Increase
|
|
Boeing 777
|
73
|
|
100
|
|
+ 37%
|
|
Boeing 747
|
9
|
|
18
|
|
+ 100%
|
|
Boeing 737
|
372
|
|
504
|
|
+ 35%
|
|
Boeing 787
|
3
|
|
120
|
|
+ + +
|
|
Airbus A320
|
425
|
|
483
|
|
+ 14%
|
|
Airbus A330/340
|
90
|
|
90
|
|
-
|
|
Airbus A380
|
23
|
|
35
|
|
+ 52%
|
|
Airbus A350
|
0
|
|
20
|
|
+ + +
|
Source: J.P. Morgan (Joseph Nadol)
Positioned to Benefit from Ramp in Commercial
Production
Production

17

18
Aerospace Awards
§ UTC Supplier Gold: Kamatics
§ Sikorsky Top 100 Supplier: Kamatics and Aerostructures - Jacksonville
§ Boeing Performance Excellence Award - Silver Level: Kaman Global
Aerosystems
Aerosystems
§ Raytheon Missile Systems Four Star Supplier Award presented to
Kaman Precision Products
Kaman Precision Products
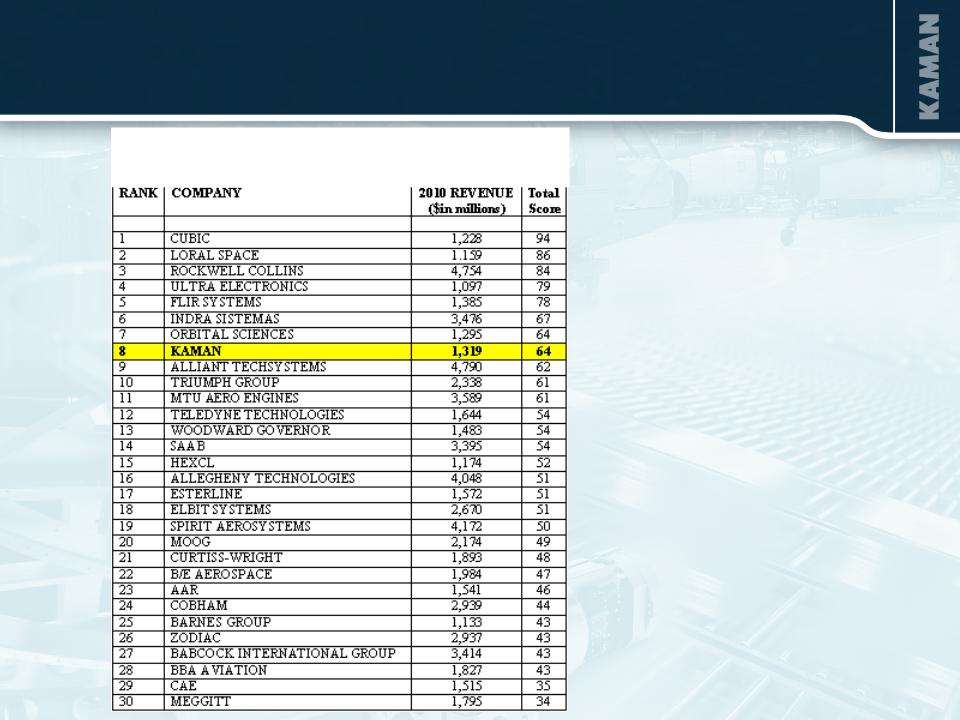
§ Aviation Week - Top Performing Companies
– 2011 #8 (companies with revenue between $1-5 billion)
– 2010 Five-Year Most Improved (companies with revenue between $1-5
billion)
billion)
19
NOW
FUTURE/VISION
Aerospace Strategic Transition
$547 Million sales $1 Billion sales
15.8% Operating margin “High Teens” operating margin
60% Build-to-print 70% Design-and-build
65% Defense 50% Defense/50% Commercial
Tier II/III Supplier Super Tier II
Small, independent businesses Integrated, coordinated,
synergistic business
synergistic business
Primarily domestic Multi-national
Competing on cost and manufacturing Competing on design-and-build
capability
manufacturing capability, and
Intellectual Property
manufacturing capability, and
Intellectual Property

INDUSTRIAL DISTRIBUTION
2011 Sales $951 Million
20

21
§ Third largest industrial distribution firm serving the $23 billion power
transmission / motion control market.
transmission / motion control market.
§ 235 locations and 5 distribution centers
§ Major product categories:
– Bearings
– Mechanical and electrical power transmission
– Fluid Power
– Motion control
– Automation
– Material handling
§ Metrics:
– $470,000 sales per employee (2011)
– 2,100 employees (approximately one third outside sales)
– 4.0 million SKUs offered
– 50,000+ customers
Industrial Distribution Overview

22
Industrial Distribution
OBJECTIVE:
§ $1.5 billion in sales - 7% operating profit margin by 2014
STRATEGY:
§ SCALE/GROWTH - Broaden product offering organically and through
acquisitions. Expand geographic footprint to enhance position in the
national accounts market
acquisitions. Expand geographic footprint to enhance position in the
national accounts market
§ PRODUCTIVITY - Recognize benefits from organizational realignment
and implement multi-faceted technology investments
and implement multi-faceted technology investments
§ PROFITABILITY - Recognize sales and cost synergies from the eight
acquisitions completed in 2010, 2011 and 2012. Enhance margins
through new higher margin product lines, a focus on pricing management
and leverage increased purchasing scale
acquisitions completed in 2010, 2011 and 2012. Enhance margins
through new higher margin product lines, a focus on pricing management
and leverage increased purchasing scale
Industrial Distribution - Progress Toward Objective
(1) Adjusted - see non-GAAP reconciliation in Table 1 of this presentation
Actual Sales
2014 Sales Objective
Operating margin,(1) (2009-2011 actuals ; 2012-2014 illustrate linear path to 2014,
actual results may vary)
24
Industrial Distribution - Acquisition of Zeller
Corporation
Corporation
§ Have entered into an asset purchase agreement to acquire Zeller Corporation
§ Zeller is a value added distributor of electrical and automation
components and engineered systems provider, encompassing the
following technologies:
components and engineered systems provider, encompassing the
following technologies:
– Motion control
– PLC based automation
– Machine vision
– Electrical controls
– Power distribution products
§ Zeller also represents other quality manufacturers including:
– Kollmorgen
– Phoenix Contact
– Rittal
– Sick
§ Zeller’s full year sales for 2012 are expected to be approximately $80
million with an operating profit margin higher than that of Kaman’s
Industrial Distribution segment
million with an operating profit margin higher than that of Kaman’s
Industrial Distribution segment
§ The transaction is expected to close in Q3 2012

25
|
Product
Platform |
Bearings & Mechanical Power
Transmission (BPT)
|
Fluid Power
|
Automation & Motion
Control |
|
% of 2011 Sales
(approximate)
|
72%
|
12%
|
16%
|
|
Market Size
|
$12.5 Billion
|
$7.2 Billion
|
$15.0 Billion
|
|
Acquisitions
since 2008 |
•Industrial Supply Corp.
•Allied Bearings Supply
•Plains Bearing
•Fawick de Mexico
•Florida Bearings
|
•Catching Fluidpower
•INRUMEC
|
•Minarik
•Automation Technology
•Target Electronic Supply
|
|
Major Suppliers
|
|
Major Product Platforms

26
Executing Strategy and Building Network

27
§ Q2 2012 sales grew 7.9% on a sales per sales day basis
§ 2011 sales were up 14.3% over the prior year to a record $951 million
§ Organic growth in 2011 was broad based
– 10 of top 10 product categories were up year-over-year
– 9 of top 10 end markets were up year-over-year
– 9 of top 10 states were up year-over-year (1 was down 1%)
§ Eight acquisitions completed in 2010, 2011 and 2012, accelerating the
top line and building scale (added ≈ $250 million in sales [annualized])
top line and building scale (added ≈ $250 million in sales [annualized])
Distribution Growth Continues
2011 Operating profit margin was 5.1%, up 150 bps over 2010;
Operating profit dollars were up 59%

28
NOW
FUTURE/VISION
Industrial Distribution Strategic Transition
$951 Million sales $1.5 Billion sales
5.1% operating margin 7.0% operating margin
Presence in 72 of the top 100 Presence in ≈ 90 of the top 100
U.S. industrial markets U.S. industrial markets
Three product platforms Three major product platforms
with increased market share in
motion/automation and fluid
power
with increased market share in
motion/automation and fluid
power
Narrow fluid power offering from Broad fluid power offering from
numerous single-technology multi-technology supplier
Suppliers
Seven ERP systems State of the art enterprise wide
business system
business system

29
Industrial Distribution Opportunities
§ Broaden product offering organically and through acquisition to win
additional business from existing customers and gain market share
additional business from existing customers and gain market share
§ Enhance margins through new higher margin product lines, a focus
on pricing management and leverage from higher sales
on pricing management and leverage from higher sales
§ Expand higher margin fluid power business via Parker national
reseller agreement
reseller agreement
§ Recognize sales and cost synergies from the eight acquisitions
completed in 2010, 2011 and 2012
completed in 2010, 2011 and 2012
§ Expand geographic footprint through additional acquisitions to
enhance Kaman’s position in the competition for national accounts
enhance Kaman’s position in the competition for national accounts
§ Improve productivity through technology investments to enhance
return on sales
return on sales

30
Outlook
The Company's expectations for 2012 are as follows:
§ Aerospace segment sales of $605 million to $625 million
§ Aerospace segment operating margins of 15.7% to 16.0%
§ Industrial Distribution segment sales of $1,035 million to $1,055 million
§ Industrial Distribution segment operating margins of 5.4% to 5.6%
§ Interest expense of approximately $11.5 million
§ Corporate expenses of approximately $44 million to $46 million
§ Tax rate of approximately 35%
§ Free cash flow of $30 million to $35 million
§ “We expect a much stronger fourth quarter than third with a variation in
net earnings of as much as 20%.”
net earnings of as much as 20%.”

31
Kaman Investment Merits
§ A Leading Market Position in Both Business Segments
§ Continued Focus on Profit Optimization, Increasing Cash
Flows and Strengthening Competitive Position
Flows and Strengthening Competitive Position
§ Strong Liquidity and Conservative Financial Profile
- Investment Grade Rating (BBB-/Stable)
§ Disciplined and Focused Acquisition Strategy
§ Experienced Management Team
32
FINANCIAL SUMMARY
37%
2011 Sales $1.50 Billion
33
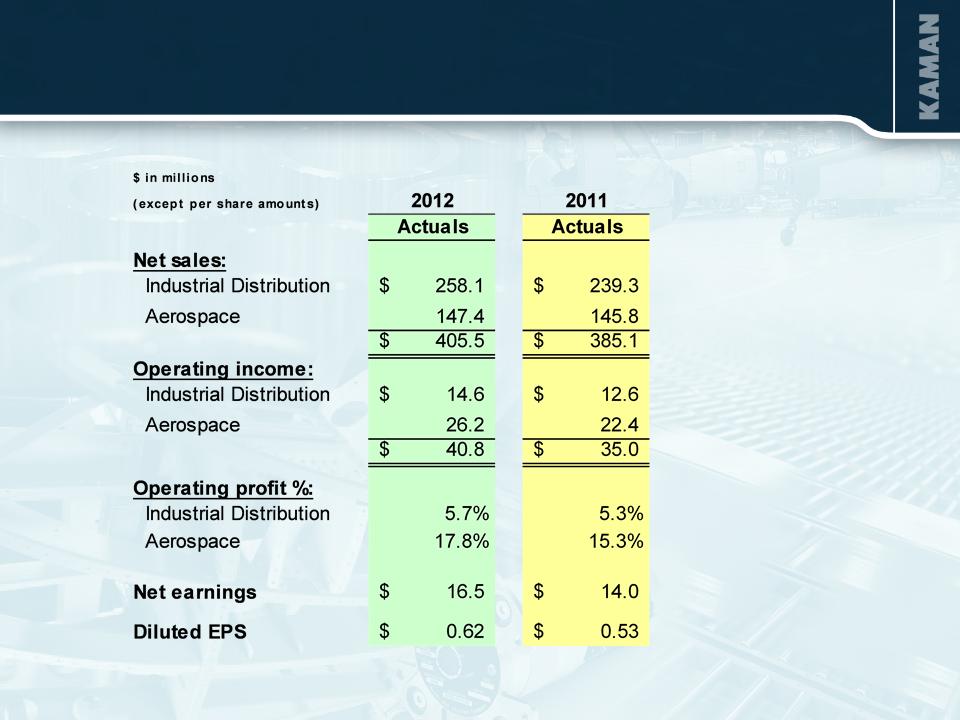
Financial Highlights - Q2
34
(1) Adjusted - see non-GAAP reconciliation in Table 1 of this presentation
Financial Highlights - Full Year 2011

35
|
(In Millions)
|
As of 6/29/2012
|
As of 12/31/11
|
As of 12/31/10
|
|
Cash and Cash Equivalents
|
$ 15.1
|
$ 15.0
|
$ 32.2
|
|
Notes Payable and Long-term Debt
|
$ 230.3
|
$ 205.2
|
$ 148.4
|
|
Shareholders’ Equity
|
$ 399.3
|
$ 373.1
|
$ 362.7
|
|
Debt as % of Total Capitalization
|
36.6%
|
35.5%
|
29.0%
|
|
Capital Expenditures
|
$ 11.0
|
$ 28.8
|
$ 21.5
|
|
Depreciation & Amortization
|
$ 13.3
|
$ 23.2
|
$ 20.5
|
(1) Six months year to date
(1)
(1)
Balance Sheet and Capital Factors

36
26,104
26,500
Diluted weighted average shares outstanding
$ 1.48
$ 2.01
Non-GAAP adjusted net earnings per common share diluted
0.05
-
Aerospace contract pricing settlement
(0.17)
-
Look-back interest benefit
0.24
-
Goodwill impairment charge
-
0.15
FMU-143 litigation settlement
-
(0.07)
Non-recurring benefit associated with the death of a former executive
$ 1.36
$ 1.93
GAAP earnings per common share - diluted
$ 38,982
$ 53,213
Non-GAAP adjusted net earnings
1,300
-
Aerospace contract pricing settlement
(4,300)
-
Look-back interest benefit
6,371
-
Goodwill impairment charge
3,971
FMU-143 litigation settlement
-
(1,900)
Non-recurring benefit associated with the death of a former executive
$ 35,611
$ 51,142
GAAP net earnings as reported
December 31,
2010
December 31,
2011
For the twelve months ended
NET EARNINGS:
Table 1. Reconciliation of Non-GAAP Financial Information
(In thousands except per share amounts)
(In thousands except per share amounts)

37
|
AEROSPACE SEGMENT OPERATING INCOME:
|
|
|
|
|
|
For the twelve months ended
|
||
|
|
December 31,
2011
|
|
December 31,
2010
|
|
GAAP net sales - Aerospace segment
|
$ 547,403
|
|
$ 486,516
|
|
Sales adjustment due to contract pricing settlement
|
-
|
|
(2,259)
|
|
Adjusted net sales - Aerospace segment
|
$ 547,403
|
|
$ 484,257
|
|
GAAP operating income - Aerospace segment
|
$ 80,424
|
|
$ 67,151
|
|
% of GAAP net sales
|
14.7%
|
|
13.8%
|
|
|
|
|
|
|
FMU-143 litigation settlement
|
$ 6,204
|
|
$ -
|
|
Goodwill impairment charge
|
-
|
|
6,371
|
|
Aerospace contract pricing settlement
|
-
|
|
1,969
|
|
Non-GAAP adjusted operating income - Aerospace segment
|
$ 86,628
|
|
$ 75,491
|
|
% of adjusted net sales
|
15.8%
|
|
15.6%
|
Table 1. (Continued) Reconciliation of Non-GAAP
Financial Information (In thousands except per share
amounts)
Financial Information (In thousands except per share
amounts)

38
APPENDIX
39
Scoring Categories:
§ Return on invested capital
§ Earnings momentum
§ Asset management
§ Financial health
2011 AEROSPACE & DEFENSE RANKINGS FOR
COMPANIES WITH REVENUES BETWEEN $1-5 BILLION
Aviation Week Top Performing Companies

40
APPENDIX II
Executive Compensation &
Corporate Governance
Corporate Governance

41
Executive Compensation Aligned with
Shareholder Interests
Shareholder Interests
§ Alignment with the market allows Company to attract and retain
key talent
key talent
§ Company and individual performance drive base salary, annual
cash incentives and long-term incentives
cash incentives and long-term incentives
§ Total compensation only reaches the median of market when
Company financial performance also is at the median of similar
sized industrial companies
Company financial performance also is at the median of similar
sized industrial companies
§ The direct linkage to company financial performance serves
shareholder interests
shareholder interests
§ SERP and Pensions benefit accruals ended in 2010
§ Perquisites have essentially been eliminated for executive officers
(MERP, financial counseling, tax planning)
(MERP, financial counseling, tax planning)
42
§ Base Salary
§ Long-Term Incentive
§ Benefit Plans - Same plans as all other employees
§ Car Allowance - Limited to executive officers and business unit heads
§ Perquisites - Other executive perquisites eliminated
§ Management Agreements - Limited to six key executives
All compensation components compared to industrial surveys of similar
sized companies every 2-3 years
sized companies every 2-3 years
Total compensation is driven by company and individual performance
75% of CEO’s compensation in 2011 was performance related
Targeted at the median of
industrial companies of similar size
Compensation Components

43
Performance-Driven Annual Cash Incentive
§ Annual cash incentive driven by financial performance
– Corporate - compared against the 5-year average of Russell 2000:
• Return on Investment
• EPS growth
• EPS performance against plan
• Individual Performance
§ Business Units - compared against the 3-year moving average of past
performance
performance
• Return on Investment
• Growth in operating income
• Additional annual objectives determined by business priorities
Reviewed and approved by the Personnel and Compensation
Committee of the Board of Directors
Committee of the Board of Directors

44
Corporate Governance
§ Strong and Independent Board of Directors
§ Nine members; eight are independent with no relationship to the
Company other than Board service.
Company other than Board service.
§ Independent Lead Director in place since 2002
§ Board has majority voting policy for director elections
§ Directors have broad senior leadership qualifications:
– Chief executive or chief financial officer roles
– Industry experience includes aerospace, defense, engineering,
distribution and financial services, both domestic and international
distribution and financial services, both domestic and international
§ Virtually all directors serve on the board of other public companies
(generally not more than three)
(generally not more than three)

45
Forward Looking Statement
This presentation contains forward-looking information relating to the Company's business and prospects, including the Aerospace and Industrial
Distribution businesses, operating cash flow, and other matters that involve a number of uncertainties that may cause actual results to differ materially from
expectations. Those uncertainties include, but are not limited to: 1) the successful conclusion of competitions for government programs and thereafter
contract negotiations with government authorities, both foreign and domestic; 2) political conditions in countries where the Company does or intends to do
business; 3) standard government contract provisions permitting renegotiation of terms and termination for the convenience of the government; 4) changes
in government and customer priorities and requirements (including cost-cutting initiatives, the potential deferral of awards, terminations or reductions of
expenditures to respond to the priorities of Congress and the Administration, or budgetary cuts resulting from Congressional actions or automatic
sequestration under the Budget Control Act of 2011); 5) satisfactory conclusion to government inquiries or investigations regarding government programs,
including satisfactory resolution of the Wichita subpoena matter; 6) domestic and foreign economic and competitive conditions in markets served by the
Company, particularly the defense, commercial aviation and industrial production markets; 7) risks associated with successful implementation and ramp up
of significant new programs; 8) potential difficulties associated with variable acceptance test results, given sensitive production materials and extreme test
parameters; 9) successful resale of the SH-2G(I) aircraft, equipment and spare parts; 10) receipt and successful execution of production orders for the JPF
U.S. government contract, including the exercise of all contract options and receipt of orders from allied militaries, as all have been assumed in connection
with goodwill impairment evaluations; 11) continued support of the existing K-MAX® helicopter fleet, including sale of existing K-MAX® spare parts
inventory; 12) cost estimates associated with environmental remediation activities at the Bloomfield, Moosup and New Hartford, CT facilities and our U.K.
facilities; 13) profitable integration of acquired businesses into the Company's operations; 14) changes in supplier sales or vendor incentive policies; 15)
the effects of price increases or decreases; 16) the effects of pension regulations, pension plan assumptions, pension plan asset performance and future
contributions; 17) future levels of indebtedness and capital expenditures; 18) future availability of credit; 19) continued availability of raw materials and
other commodities in adequate supplies and the effect of increased costs for such items; 20 )the effects of currency exchange rates and foreign competition
on future operations; 21) changes in laws and regulations, taxes, interest rates, inflation rates and general business conditions; 22) future repurchases
and/or issuances of common stock; and 23) other risks and uncertainties set forth in the Company's annual, quarterly and current reports, proxy statements
and other filings with the SEC. Any forward-looking information provided in this presentation should be considered with these factors in mind. The
Company assumes no obligation to update any forward-looking statements contained in this presentation.
Contact: Eric Remington
V.P., Investor Relations
(860) 243-6334
Eric.Remington@kaman.com