Attached files
| file | filename |
|---|---|
| 8-K - 8-K - APARTMENT INVESTMENT & MANAGEMENT CO | d397601d8k.htm |
Exhibit 99.1

| Zelman & Associates Non-Deal Roadshow August 14 - 15, 2012 |

| Strategic Areas of Focus |
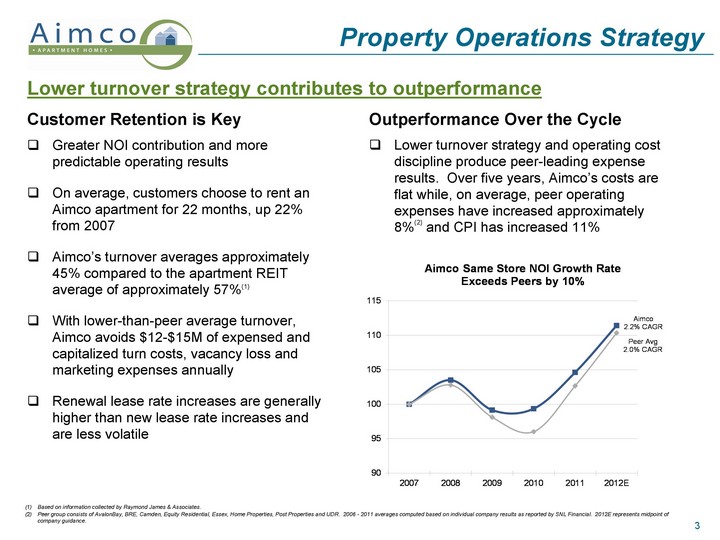
| Lower turnover strategy and operating cost discipline produce peer-leading expense results. Over five years, Aimco's costs are flat while, on average, peer operating expenses have increased approximately 8%(2) and CPI has increased 11% Lower turnover strategy contributes to outperformance Greater NOI contribution and more predictable operating results On average, customers choose to rent an Aimco apartment for 22 months, up 22% from 2007 Aimco's turnover averages approximately 45% compared to the apartment REIT average of approximately 57%(1) With lower-than-peer average turnover, Aimco avoids $12-$15M of expensed and capitalized turn costs, vacancy loss and marketing expenses annually Renewal lease rate increases are generally higher than new lease rate increases and are less volatile Property Operations Strategy Customer Retention is Key Outperformance Over the Cycle Based on information collected by Raymond James & Associates. Peer group consists of AvalonBay, BRE, Camden, Equity Residential, Essex, Home Properties, Post Properties and UDR. 2006 - 2011 averages computed based on individual company results as reported by SNL Financial. 2012E represents midpoint of company guidance. |

| 2012 Guidance * Leverage metrics based on annualized projected 4Q 2012 EBITDA. |
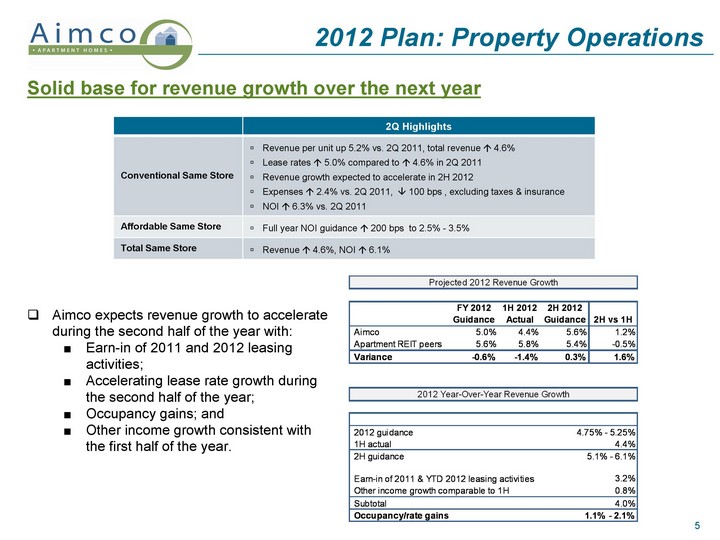
| 2012 Plan: Property Operations 2Q Highlights Conventional Same Store Revenue per unit up 5.2% vs. 2Q 2011, total revenue ? 4.6% Lease rates ? 5.0% compared to ? 4.6% in 2Q 2011 Revenue growth expected to accelerate in 2H 2012 Expenses ? 2.4% vs. 2Q 2011, ? 100 bps , excluding taxes & insurance NOI ? 6.3% vs. 2Q 2011 Affordable Same Store Full year NOI guidance ? 200 bps to 2.5% - 3.5% Total Same Store Revenue ? 4.6%, NOI ? 6.1% Solid base for revenue growth over the next year Aimco expects revenue growth to accelerate during the second half of the year with: Earn-in of 2011 and 2012 leasing activities; Accelerating lease rate growth during the second half of the year; Occupancy gains; and Other income growth consistent with the first half of the year. |

| Designing portfolio around our target customers Portfolio Strategy Target demographic: Age 25-40 High propensity to rent, predictably increasing number of people College educated Stronger job and earnings growth; lower unemployment Single Lower rate of homeownership; not yet motivated by marriage, children Portfolio increasingly concentrated in areas where target customers want to live - coastal and job growth markets Manhattan Boston Philadelphia Suburban NY / NJ Washington Greater Los Angeles Denver Phoenix Chicago Houston South Florida Atlanta Seattle San Diego Jacksonville Orlando Tampa Dallas / Ft Worth Bay Area NOI Concentration* Coastal (58%) Job growth markets (33%) Other (9%) Over time, Aimco intends to exit Texas and Non-Target Florida markets, primarily due to limited constraints on supply growth * Percentage contribution to 2Q 2012 Target Market NOI |
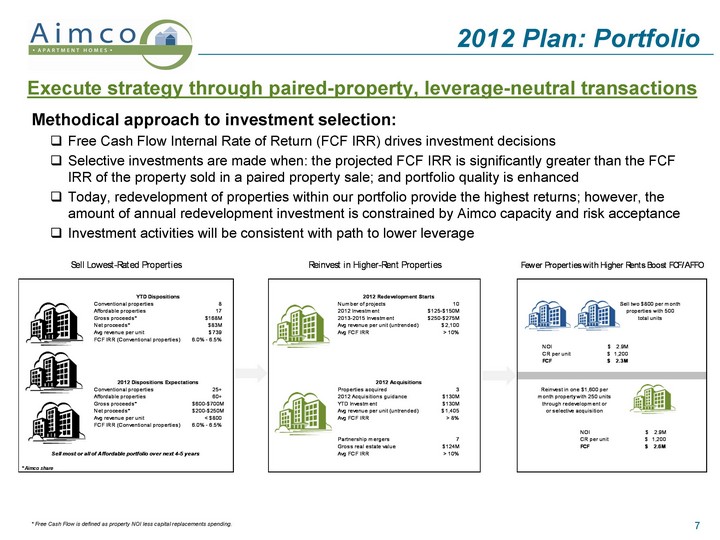
| 2012 Plan: Portfolio Execute strategy through paired-property, leverage-neutral transactions * Free Cash Flow is defined as property NOI less capital replacements spending. Methodical approach to investment selection: Free Cash Flow Internal Rate of Return (FCF IRR) drives investment decisions Selective investments are made when: the projected FCF IRR is significantly greater than the FCF IRR of the property sold in a paired property sale; and portfolio quality is enhanced Today, redevelopment of properties within our portfolio provide the highest returns; however, the amount of annual redevelopment investment is constrained by Aimco capacity and risk acceptance Investment activities will be consistent with path to lower leverage |

| Redevelopment Strategy Pipeline of opportunities to generate higher risk-adjusted returns Redevelopment philosophy: Land in quality locations appreciates over time Older assets in quality locations provide opportunity for redevelopment Redevelopment is a short-cycle business making it lower-risk than ground-up development Currently, redevelopment provides risk-adjusted returns greater than acquisitions, with 2012 projects generating current returns > 7% with un-trended rents in markets where cap rates average ~4.5% for 55% value-creation or approximately $2 per share of NAV Aimco's portfolio composition and expertise in redevelopment provide a pipeline of opportunities Pacific Bay Vistas, San Bruno CA The Preserve at Marin, Corte Madera CA Lincoln Place Apartments, Venice CA San Francisco Tiburon Corte Madera San Francisco Santa Monica Marina Del Rey New Campus (2014) New Metro Stop (2015) |
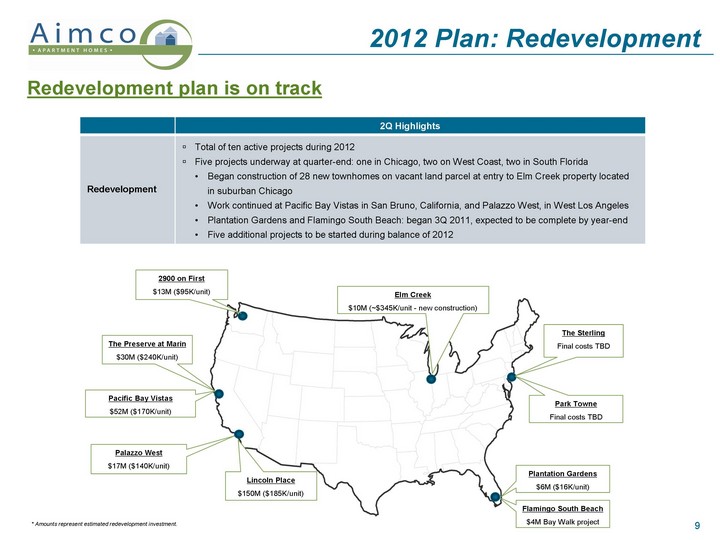
| 2012 Plan: Redevelopment Redevelopment plan is on track Flamingo South Beach $4M Bay Walk project Plantation Gardens $6M ($16K/unit) 2Q Highlights Redevelopment Total of ten active projects during 2012 Five projects underway at quarter-end: one in Chicago, two on West Coast, two in South Florida Began construction of 28 new townhomes on vacant land parcel at entry to Elm Creek property located in suburban Chicago Work continued at Pacific Bay Vistas in San Bruno, California, and Palazzo West, in West Los Angeles Plantation Gardens and Flamingo South Beach: began 3Q 2011, expected to be complete by year-end Five additional projects to be started during balance of 2012 * Amounts represent estimated redevelopment investment. |

| Balance sheet designed for safety Limit entity risk by avoiding recourse debt, of which Aimco has very little Reduce re-pricing risk by using fixed-rate loans and refinancing nearer-term maturities to lock-in current low rates Reduce refunding risk by laddering maturities of long-term, non-recourse, amortizing property loans with little or no near-term maturities and using perpetual preferred stock Weighted average term to maturity, including preferred stock, of 8.6 years is 35% longer than the apartment REIT average (1) Hedge against inflation and cap rate expansion by using long-dated, fixed-rate leverage Take advantage of lower property debt balances and build a pool of unencumbered properties to increase flexibility in times of stress in credit markets Manage exposure to GSEs by use of insurance company, savings bank, and other lenders Balance Sheet Strategy Leverage strategy: Aimco weighted average maturity of 8.6 years assumes Aimco's perpetual preferred stock matures in 40 years, which is equal to the company's longest-dated property debt maturity, and excludes preferred stock called for redemption. Peer average represents the average of AvalonBay, BRE, Camden Properties, Colonial Properties, Equity Residential, Essex, Home Properties, MAA, Post Properties and UDR and also assumes a 40-year maturity for preferred stock. Data as of 6/30/2012. Based on 6/30/2012 balances, taking into account: 7/26/2012 preferred stock redemption. Components of Aimco Leverage Pro Forma 6/30/2012(2) Non-Recourse Property Debt Maturities Weighted Average Term to Maturity: 7.6 Years |

| 2012 Plan: Balance Sheet Balance sheet targets within reach; interest expense declining $0.06 per share annually Leverage metrics based on projected annualized 4Q 2012 EBITDA. Based on consensus EBITDA growth estimates published by FactSet and consistent with company projections. EBITDA growth takes into account projected asset sales and, as such, repayment of debt associated with such sales is also reflected in this computation. Highlights Equity Offerings/ Preferred Stock Redemptions Raised $642M in May and June equity offerings, proceeds used to redeem preferred stock YTD Through July, leverage ? $542M through: preferred stock redemptions, property debt amortization, and property sales, net of debt increased by refinancing and property acquisitions ? 4Q 2012 Debt & Preferred Stock:EBITDA by 1.0x, from 8.7x to 7.7x(1) ? 4Q 2012 EBITDA:Interest & Preferred Dividends by 0.35x, from 2.0x to 2.35x(1) On an annualized basis, ? FFO by $0.04 per share, ? AFFO by $0.12 per share Expect during 2012 to reduce debt and preferred stock balances by $0.9B Declining Property Debt Interest Expense Interest savings from property debt amortization and refunding maturing property debt at current low interest rates adds ~$0.06 per share to FFO and AFFO in each of the next several years |

| Earnings & Dividend Increasing retained earnings, higher dividends * The Aimco Board increased in July the company's quarterly dividend 11%, from $0.18 to $0.20 per share,. On an annualized basis, this is a 67% increase compared to 2011. Aimco's equity valuation does not reflect progress and trajectory FFO $1.78 - $1.86 AFFO $1.30 - $1.38 Dividend* $0.20 per quarter |
| This presentation contains forward-looking statements within the meaning of the federal securities laws, including, without limitation, statements regarding projected results and specifically: forecasts of 2012 financial and operating results, asset sales and redevelopment investment; projected returns on 2012 redevelopment projects; the impact of dispositions on portfolio metrics; and projected 2012 and 2013 leverage ratios. These forward-looking statements reflect management's judgment as of this date, and Aimco assumes no obligation to revise or update them to reflect future events or circumstances. These forward-looking statements include certain risks and uncertainties. Readers should carefully review Aimco's financial statements and notes thereto, as well as the risk factors described in Aimco's Annual Report on Form 10-K for the year ended December 31, 2011, and the other documents Aimco files from time to time with the Securities and Exchange Commission. This presentation does not constitute an offer of securities for sale. Future quarterly dividend payments are subject to determinations by Aimco's board of directors based on the circumstances at the time of authorization, and the actual dividends paid may vary from the currently expected amounts. Forward-Looking Statements and Other Information |