Attached files
| file | filename |
|---|---|
| EX-99.3 - EX-99.3 - DORAL FINANCIAL CORP | d393425dex993.htm |
| EX-99.1 - EX-99.1 - DORAL FINANCIAL CORP | d393425dex991.htm |
| 8-K - 8-K - DORAL FINANCIAL CORP | d393425d8k.htm |
 Doral Financial Corporation
Q2 2012 Investor Presentation
August 9, 2012
Exhibit 99.2 |
 Disclaimer
2
This presentation may include forward-looking statements as defined in the
Private Securities Litigation Reform Act of 1995 (the
“PSLRA”). These include comments with respect to our objectives and
strategies, and the results of our operations and our business.
Forward-looking statements can be identified by the fact that they do not relate strictly to historical or current facts.
They
often
include
words
such
as
“expects,”
“anticipates,”
“intends,”
“plans,”
“believes,”
“seeks,”
“estimates,”
or
words
of
similar
meaning,
or
future
or
conditional
verbs
such
as
“will,”
“would,”
“should,”
“could”
or
“may.”
We
intend
these
forward-looking
statements to be covered by the safe harbor provisions of the PSLRA.
Forward-looking statements provide our expectations or predictions of future
conditions, events or results. They are, by their nature, subject to risks
and uncertainties. They are not guarantees of future performance, and actual results may differ materially.
By their nature, these forward-looking statements involve numerous assumptions
and uncertainties, both general and specific, including those discussed in
Doral Financial Corporation’s 2011 Annual Report on Form 10-K and other filings we make with the
Securities and Exchange Commission. Risk factors and uncertainties that could cause
the Company's actual results to differ materially from those described in
forward-looking statements can be found in the Company's 2011 Annual Report on Form 10-K,
which
is
available
in
the
Company's
website
at
www.doralfinancial.com,
as
they
may
be
updated
from
time
to
time
in
the
Company’s periodic and other reports filed with the Securities and Exchange
Commission. The statements in this presentation speak only as of the date
they are made. We do not undertake to update forward-looking
statements
to
reflect
the
impact
of
circumstances
or
events
that
arise
after
the
date
the
forward-looking
statements
were
made. |
 Q2
Overview 3
Maintained strong regulatory capital levels and book value per common share
o
Book Value remained steady at $3.82 / common share
Continued revenue growth with Net Interest Income increasing by $2MM to $54MM
o
Asset Substitution and lower deposit costs increased NIM to 291bps (6 bps
increase) Asset quality continued to stabilize with NPLs decreasing by
$8MM o
Coverage ratios remain strong at 2.5% of Loans; NPL Coverage Ratio 41.4%
Elevated expenses required to meet higher credit and compliance standards
o
$8MM higher expenses during Q2; $3.5MM unlikely to recur
US earnings absorb increased credit and compliance costs.
|
 4
FDIC Consent Order
4
Certain Consent Order Requirements
Doral’s Actions
Meet minimum capital requirements at
Doral Bank (8% Leverage Ratio, 10%
Tier-1 Risk Based, 12% Total Risk
Based)
•
Increased Doral Financial Corporation Regulatory Capital by
$223MM in 1Q ’12
•
As a result, Doral Bank currently exceeds the Consent Order
capital requirements and Doral Financial Corporation remains a
source of capital strength for the bank.
Eliminate or charge off all assets
classified as “Loss”
by FDIC
•
Charged off $113MM over the last 12-months
•
Added $175MM of provisions over the last 12 months
Improvements to credit and risk
administration function.
Added 151 credit, risk and regulatory staff over the last 12-
months.
Invested $5MM during 2012 in third-party subject matter experts
to validate and accelerate process and procedure improvements.
Consent Order requires shift from portfolio level to loan level credit
administration |
 Profitability
Pro
forma
Income
($MM)
2Q ‘12
Net Interest Income
$54.1
Non Interest Income
21.3
Non Interest Expense
67.5
Provision
$5.2
Tax Expense (Benefit)
(1.1)
Income (Ex-Special Items)
$3.8
Less: Special Items
Credit & Administrative Expenses
$3.5
Reserve for US Tax Position
1.9
Reported Net Income
$(1.6)
$1.6MM Net Loss impacted by increased expenses and two
special items.
o
Year to Date Net Income is $1MM
Net Revenue grew by $2MM over Q1 driven by increased yield
from asset substitution and lower deposit costs.
o
Net Interest Margin improved to 291 bps
o
Deposit prices fell below 1% during the quarter
Operating Expenses increased by $8MM to $71MM impacted
by both temporary and longer-lasting increases in credit and
administration related costs.
o
$3.5MM of temporary credit and administration expenses.
o
Invested ~$4MM in additional staff and credit costs associated
with higher credit and compliance standards.
Tax Expense negatively impacted by recognition of $1.9MM of
expense associated with a 2008 US tax return item.
o
Potential to recover this expense in future periods
Excluding the noted Special Items, Doral generated $3.8MM of Income.
5
1
Non-GAAP presentation of financial results
1 |
 Doral
Financial Corporation Profile 6
Company Overview
Capital Ratios continue to exceed required levels:
o
Tier-1 Leverage Ratio: 9.9%
o
Total Risk-Based Capital Ratio: 14.2%
Book Value of $3.82 per common share
o
As a result of an election to remain subject to the 1994 tax
code, the valuation allowance against Doral’s remaining
deferred tax asset increased $69MM to $321MM
representing $2.50 per share.
Doral Operates Three Business Segments:
1.
PR Residential:
Mortgage and retail banking generates
significant non-interest income from origination and
servicing activities
o
Residential mortgage loans are fixed rate, with an average
balance under $120K.
2.
PR Commercial:
Shrinking portfolio with significant asset
coverage
o
36% of loans are NPL; NPL Coverage Ratio is 38%
3.
US:
Growing business with superior returns:
o
US loans have grown to $2B (30% of total loans) with a
2.5% ROAA and NIM of 425bps
o
NPAs currently at 26 bps
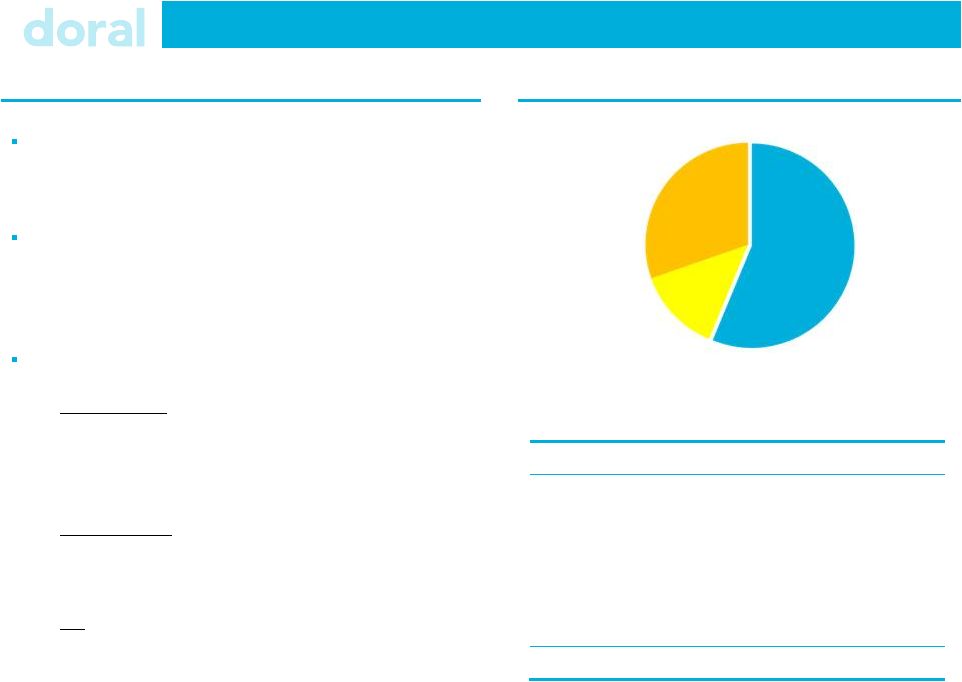
Loan Portfolio Composition ($6.5B)
$ mm
Loan Category
PR
USA
Total
Residential
$3,631
$13
$3,644
CRE
557
447
1,004
C&I
36
1,407
1,443
Construction &
Development
274
92
366
Consumer / Other
30
-
30
Total
$4,528
$1,959
$6,487
PR Residential
(57%)
US
(30%)
PR Commercial
(13%) |
 Puerto Rico Operating Segments
Desirable Mortgage & Retail Banking Franchise
Contributes $39.7MM (80%) of Doral’s Puerto Rico
Net Revenue
o
51% of revenue is generated from non-interest income
Affordable residential mortgage loan portfolio of
$3.6B
o
2.7%
coverage
ratio
/
loans;
NPL
Coverage
Ratio
1
is
36%
o
6.0% average yield on performing loans
o
Monthly mortgage originations of $70+MM
o
Additional serviced portfolio of $7.7B
Retail Banking deposit balance of $1.6B
o
260k+ retail bank customers
o
26 Branches with average balance of $63MM per branch
Doral maintains a $321MM valuation allowance
against its Puerto Rico deferred tax asset.
o
Allowance equals $2.50 per share of additional book value
Discontinued CRE, C&I, Construction & Land Portfolio
Doral does not originate new commercial, construction or
land loans in Puerto Rico
o
$105MM (11% ) reduction from 2Q ’11
Increasing demand for new affordable housing units
o
72 construction units sold year to date ($15MM)
o
Sales represent 45% of available units in the period
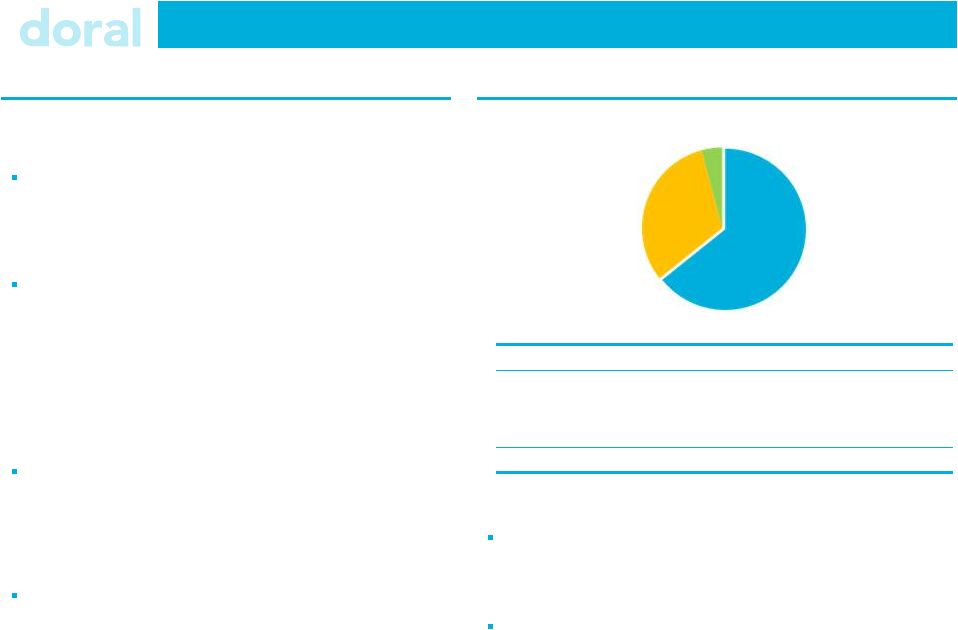
($MM)
$
NPL $
NPL %
Coverage
1
CRE
$557
$192
34%
29%
C&I
$36
$3
8%
333%
Construction & Land
$274
114
42%
55%
Total Loans
$867
$309
36%
38%
1
NPL Coverage Ratio = (reserve + partial charge-off) / (NPA+ partial
charge-off) CRE (64%)
Construction &
Land (32%)
C&I (4%)
7 |
 8
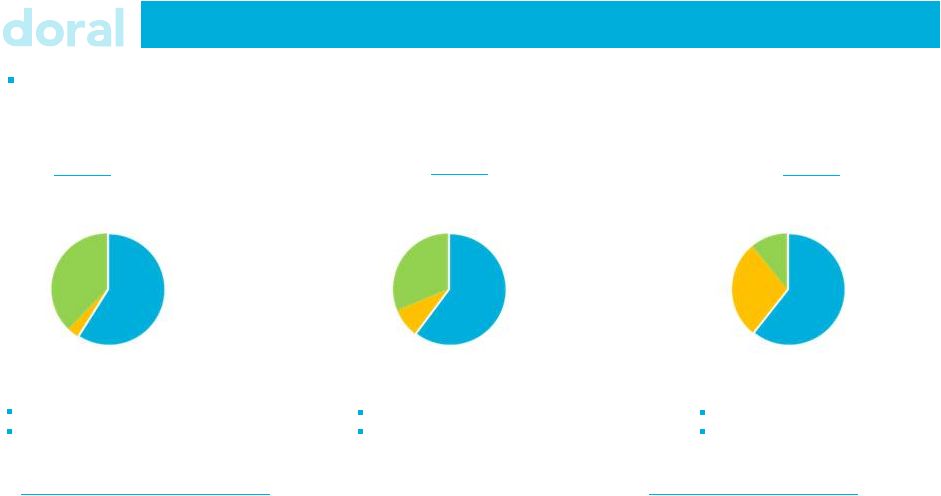
Asset Substitution Strategy
Doral has successfully transformed towards higher-yield, lower-risk
loans. US growth platforms now represent 27% of loans and investment
securities. •
1999: Established US Platform in New York
•
2007: Sold Doral Bank US Loans, Branches & Deposits
•
2008: Re-launched Doral Bank in the US
•
2008: Launched doralbankdirect.com produce line
•
2009: Established Doral Leveraged Asset Management
•
2010: Opened retail branches in New York and
Florida
•
2011: Launched Doral Property Finance division
•
2011: Merged Doral Bank FSB (thrift) with Doral Bank
•
2011: Reached $1.6B MM in Assets; $27 MM in Profit
•
2012: 7 Branches with $585MM in Deposits
•
2012: Achieved $23MM YTD Pre-Tax Income
PR
$5.4B (61%)
US
$0.5B (5%)
Securities
$2.9B (34%)
4Q ‘09
PR
$4.5B (63%)
US
$2.0B (27%)
Securities
$0.7B (10%)
2Q ‘12
PR
$5.0B (67%)
US
$0.9B (12%)
Securities
$1.5B (21%)
1Q ‘11
Key Events in US Platform Development
Total: $8.8B
NIM $45.9MM (187bps)
Total: $7.4B
NIM $43.2MM (223bps)
Total: $7.2B
NIM $54.1MM (291bps) |
 9
US Growth Platforms
Income ($MM)
2Q ’12
Net Interest Income
$19.5
Non Interest Income
1.0
Non Interest Expense
8.0
Provision
1.0
Pre-Tax Income
$11.5
ROAA
2.50%
Net Interest Margin (bps)
425
NPA %
0.3%
Efficiency Ratio
39.0%
Doral Bank (USA)
Est. 1999
Doral Leveraged
Asset Management
Est. 2009
Doral Property
Finance
Est. 2011
Loans: $0.7B
Deposits: $0.6 B
Loans: $1.1B
Loans: $0.2B
•
New York and Florida based traditional commercial
lending and retail banking
•
CRE, Taxi Medallion, Construction & Healthcare
Receivables lending
•
5.2% average yield
•
Average deposits per retail branch of $67MM
•
Participations in broadly syndicated Shared
National Credit C&I Loans
•
Average Exposure $7MM, Average Yield 5.2%
•
2 successful CLO completed in Q2 ($416MM)
•
$1.3B in Assets Under Management
•
Platform providing leverage for transitional real
estate assets
•
Average loan facility $25MM; Average Yield 6.0%
•
Contributed 20% of US loan production in Q2
Doral operates three profitable growth platforms in the US.
nd |
 10
Executive Summary
Maintaining leading affordable mortgage platform on the island.
o
Over $70MM per month of new affordable residential mortgage volume
o
40% of revenue from non-interest dependent income
o
$1.6B in retail deposits ($60MM / branch)
Discontinuing Puerto Rico CRE, Construction and Land portfolios.
o
$0.9 B of assets earning less than 5% yield.
o
36% NPL with 38% modified coverage ratio / NPLs
Expanding higher-margin, lower risk US-based growth platforms
o
$11.5MM Pre-Tax income in Q2
o
2.5% ROAA with a 425bps Net Interest Margin
o
Less than 30 bps of Non-Performing assets.
Asset substitution continues to deliver significant benefits
o
Strong Sales in Affordable Construction -- 72 units sold YTD with an additional 53 signed
options
|
 Investor Relations Contact and Conference Replay Details
11
Investor Relations:
Christopher Poulton
212 / 329-3794
christopher.poulton@doralfinancial.com
Conference Call:
10.00 AM EDT August 9, 2012
(800)-288-8960 or (612) 332-0107 for Intl
Conference Call Replay:
August 9, 2012 –
September 9, 2012
(800) 475-6701 or (320) 365-3844 for Intl
Replay Code: 255987 |
 Exhibit A
Summary Financials |
 Summary Financials
13
($ mm)
30-Jun-12
31-Mar-12
31-
Dec –
11
30-Sep-11
30-Jun-11
Income Statement
Net Interest Income
54.1
52.1
49.4
$48.2
$45.5
Provision for Credit Losses
5.2
115.2
9.9
41.7
13.3
NII After Provisions
48.9
(63.1)
39.4
6.5
32.2
Non-Interest Income
21.3
16.6
25.3
29.6
38.8
Non-Interest Expense
71.0
63.5
61.7
64.0
63.6
Pre-Tax Income
(0.8)
(110.0)
3.1
(27.8)
7.4
Taxes
0.8
(112.6)
(8.6)
2.3
2.9
Net Income
(1.6)
2.6
11.7
(30.2)
4.5
Pre-Tax Pre-Provision Income
4.4
5.2
13.0
13.9
20.6
Balance Sheet
Total Gross Loans (incl. HFS)
$6,487
$6,355
$6,241
$6,111
$5,991
Loan Loss Reserves
153
167
103
118
93
Total Deposits
4,538
4,560
4,395
4,349
4.321
Total Assets
8,345
8,093
7,975
8,014
8,016
Profitability Metrics
Net Interest Margin
2.91%
2.85%
2.67%
2.60%
2.36%
Capital & Credit Ratios
NPL / Loans¹
11.4%
12.1%
9.8%
9.8%
10.1%
Leverage Ratio
9.92%
10.19%
9.13%
8.98%
9.07%
1 Excludes Residential loans guaranteed by FHA / VA; NPL definition adjusted in Q1
2012 |