Attached files
| file | filename |
|---|---|
| 8-K - FORM 8-K DATED AUGUST 7, 2012 - PACIFIC GAS & ELECTRIC Co | form8k080712.htm |
| EX-99.1 - PACIFIC GAS & ELECTRIC Co | ex9901.htm |
* PG&E Corporation This presentation is not complete without the accompanying statements made by management during the webcast conference call held on August 7, 2012. This presentation, including Exhibits, and the accompanying press release, were attached to PG&E Corporation’s Current Report on Form 8-K that was furnished to the Securities and Exchange Commission on August 7, 2012, and along with the replay of the conference call are also available on PG&E Corporation’s website at www.pge-corp.com Second Quarter Earnings Call August 7, 2012 Exhibit 99.2

* Key Focus Areas Position company for success Resolve gas issues Rebuild relationships with key stakeholders Move forward with gas work planned in 2012 Work to resolve regulatory and legal proceedings Conduct rigorous benchmarking Build culture of continuous improvement Provide excellent service Meet commitments to customers and regulators
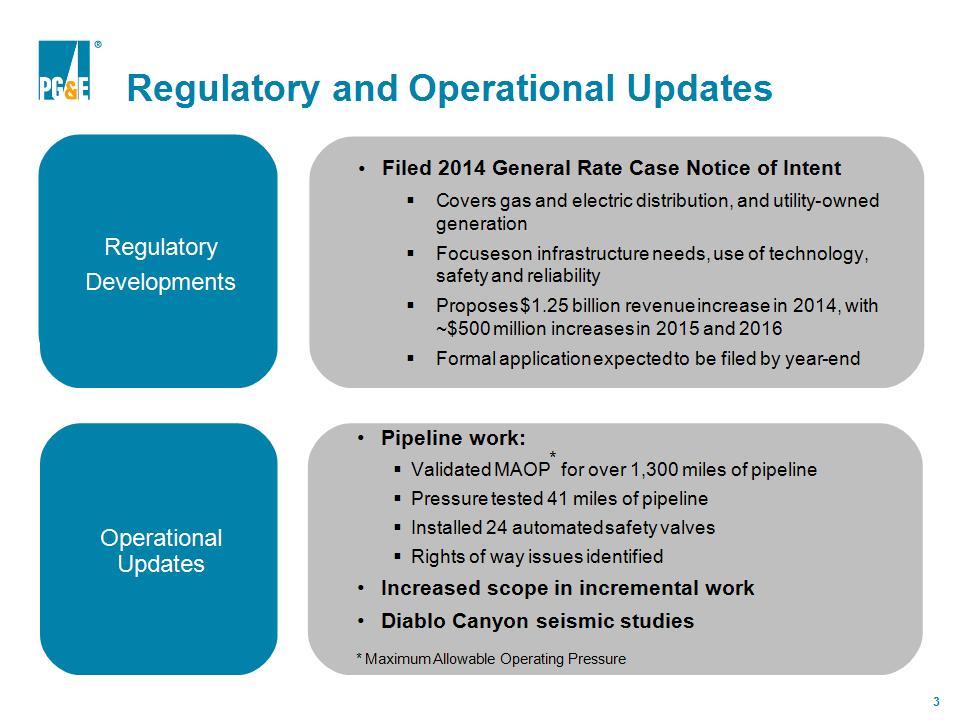
* Regulatory and Operational Updates Operational Updates Pipeline work: Validated MAOP* for over 1,300 miles of pipeline Pressure tested 41 miles of pipeline Installed 24 automated safety valves Rights of way issues identified Increased scope in incremental work Diablo Canyon seismic studies * Maximum Allowable Operating Pressure Regulatory Developments Regulatory Developments Filed 2014 General Rate Case Notice of Intent Covers gas and electric distribution, and utility-owned generation Focuses on infrastructure needs, use of technology, safety and reliability Proposes $1.25 billion revenue increase in 2014, with ~$500 million increases in 2015 and 2016 Formal application expected to be filed by year-end

* 2Q 2012: Earnings Results

* 2Q 2012: Q over Q Comparison EPS from Operations (1) (1) EPS from Operations is not calculated in accordance with GAAP and excludes items impacting comparability. See Exhibit 4 of the Appendix for a reconciliation of EPS from Operations to EPS on a GAAP basis for each quarter. (2) Other items reflect storm and outage expenses and gas transmission revenues. See Exhibit 6 of the appendix for the full walk. (2)

* (1) Includes estimated 2012 cost of Pipeline Safety Enhancement Plan (PSEP) pending regulatory decision. The guidance range for 2012 does not include future insurance recoveries or potential penalties (other than those already accrued) or any potential punitive damages. See Exhibit 1 of the Appendix for factors that could cause actual results to differ materially from the guidance presented and underlying assumptions. 2012 EPS Guidance

* Factors Affecting EPS from Operations* (1) Reflects full Pipeline Safety Enhancement Plan (PSEP) and 2014 General Rate Case (GRC) requests, as well as amounts for electric transmission, gas transmission and other capital investments. PSEP requested rate base for 2012-2014 is ~$140M, ~$480M and ~$985M, respectively. GRC-related rate base authorized/requested for 2012-2014 is ~$18.5B, ~$19.4B, and ~$21.6B, respectively (2) Cost of Capital (CoC) filing requests 11% ROE and 52% equity (3) Earnings on construction work in progress (CWIP) offset by “below-the-line” costs which are expected to increase post-2012 (4) Amounts driven by capital expenditures, timing of cash flows, the potential expiration of bonus depreciation, unrecovered gas pipeline costs, planned incremental work across the Utility, and other factors * “Earnings from operations” is not calculated in accordance with GAAP and excludes items impacting comparability (such as natural gas matters)

* Factors Affecting Natural Gas Matters (1) While guidance assumes no recovery in 2012, recovery has been requested for qualifying portions of 2012 PSEP spending.

* Appendix

* Exhibit 1: Safe Harbor Statement Page 11 Exhibit 2: Regulatory Calendar Page 12 Exhibit 3: Assumptions for 2012 Guidance Page 13 Exhibit 4: Reconciliation of PG&E Corporation Earnings from Operations Page 14 to Consolidated Income Available for Common Shareholders in Accordance with GAAP Exhibit 5: Reconciliation of Pacific Gas and Electric Company Earnings Page 15 from Operations to Consolidated Income Available for Common Stock in Accordance with GAAP Exhibit 6: Key Drivers of PG&E Corporation Earnings per Common Share Page 16 from Operations Exhibit 7: Operational Performance Metrics Page 17-18 Exhibit 8: Sales and Sources Summary Page 19 Exhibit 9: EPS Guidance Page 20 Exhibit 10: General Earnings Sensitivities Page 21 Exhibit 11: Summary of Selected Regulatory Cases Page 22-23 Table of Contents

* Management's statements regarding guidance for PG&E Corporation’s future financial results and earnings from operations per common share, the assumptions underlying management’s guidance, and general earnings sensitivities, constitute forward-looking statements that are necessarily subject to various risks and uncertainties. These statements reflect management’s judgment and opinions which are based on current expectations and various assumptions, estimates, and projections, the realization or resolution of which may be outside of management’s control. PG&E Corporation and the Utility are not able to predict all the factors that may affect future results. Some of the factors that could cause actual results to differ materially include: • the ultimate amount of civil or criminal penalties the Utility may pay in connection with the pending investigations and enforcement matters related to the San Bruno accident and the Utility’s natural gas operations; the ultimate amount of third-party claims associated with the San Bruno accident and the timing and amount of related insurance recoveries; and the amount of any punitive damages, if any, the Utility may incur related to these third-party claims; • the outcome of regulatory proceedings and the extent to which the Utility is authorized to recover costs incurred to improve the safety and reliability of its natural gas operations; • the ultimate amount of additional costs the Utility incurs in 2012 and 2013, for incremental work to improve the safety and reliability of its electric and gas operations, that are not recovered through rates; • whether PG&E Corporation and the Utility are able to repair the reputational harm that they have suffered, and may suffer in the future, due to the San Bruno accident and the related civil litigation, the occurrence of adverse developments in the CPUC investigations or the criminal investigation, including any finding of criminal liability; • the level of equity contributions that PG&E Corporation must make to the Utility to enable the Utility to maintain its authorized capital structure as the Utility incurs charges and costs, including costs associated with natural gas matters and penalties imposed in connection with the pending investigations, that are not recoverable through rates or insurance; • the impact of environmental remediation laws, regulations, and orders; the ultimate amount of costs incurred to discharge the Utility’s known and unknown remediation obligations; the extent to which the Utility is able to recover compliance and remediation costs from third parties or through rates or insurance; and the ultimate amount of costs the Utility incurs in connection with environmental remediation liabilities that are not recoverable through rates or insurance, such as the remediation costs associated with the Utility’s natural gas compressor station site located near Hinkley, California; • the impact of events that cause unplanned outages, reduce generating output, disrupt the Utility’s service to customers, or damage or disrupt the facilities, operations, or information technology and systems owned by the Utility, its customers, or third parties on which the Utility relies; and subject the Utility to third-party liability for property damage or personal injury, or result in the imposition of civil, criminal, or regulatory penalties on the Utility; • whether the Utility’s information technology, operating systems and networks, continue to function accurately; whether the Utility is able to protect its operating systems and networks from damage, disruption, or failure caused by cyber-attacks, computer viruses, or other hazards; whether the Utility’s security measures are sufficient to protect confidential customer, vendor, and financial data contained in such systems and networks from unauthorized access and disclosure; and whether the Utility can continue to rely on third-party vendors and contractors that maintain and support some of the Utility’s operating systems; • the ability of PG&E Corporation and the Utility to access capital markets and other sources of debt and equity financing in a timely manner on acceptable terms; and • the other factors and risks discussed in PG&E Corporation and the Utility’s 2011 Annual Report on Form 10-K and other reports filed with the Securities and Exchange Commission. Exhibit 1: Safe Harbor Statement
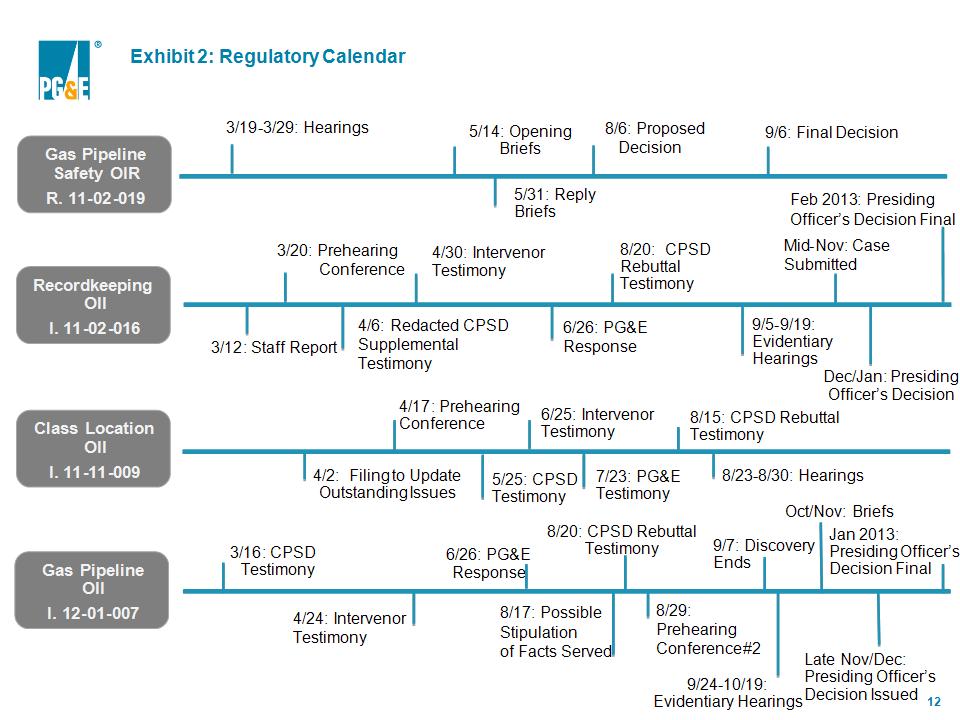
* Exhibit 2: Regulatory Calendar 8/29: Prehearing Conference #2 4/2: Filing to Update Outstanding Issues 5/25: CPSD Testimony 8/20: CPSD Rebuttal Testimony 9/6: Final Decision Mid-Nov: Case Submitted 4/6: Redacted CPSD Supplemental Testimony 6/26: PG&E Response 3/20: Prehearing Conference 3/12: Staff Report Recordkeeping OII I. 11-02-016 Gas Pipeline Safety OIR R. 11-02-019 3/19-3/29: Hearings 5/14: Opening Briefs 5/31: Reply Briefs 8/6: Proposed Decision 4/17: Prehearing Conference 8/15: CPSD Rebuttal Testimony 7/23: PG&E Testimony Class Location OII I. 11-11-009 6/25: Intervenor Testimony 8/23-8/30: Hearings 9/24-10/19: Evidentiary Hearings Oct/Nov: Briefs Jan 2013: Presiding Officer’s Decision Final 3/16: CPSD Testimony 8/17: Possible Stipulation of Facts Served 9/7: Discovery Ends 6/26: PG&E Response Late Nov/Dec: Presiding Officer’s Decision Issued 4/24: Intervenor Testimony Gas Pipeline OII I. 12-01-007 8/20: CPSD Rebuttal Testimony 4/30: Intervenor Testimony 9/5-9/19: Evidentiary Hearings Dec/Jan: Presiding Officer’s Decision Feb 2013: Presiding Officer’s Decision Final

* ~$4,600 - $4,800 Capital Expenditures Forecast ($ millions) Authorized ROE: 11.35% Equity Ratio: 52% Cost of Capital Additional Expenses ($ millions) ~$250 planned incremental spend* Authorized Rate Base (weighted average) Exhibit 3: Assumptions for 2012 Guidance *Figure estimated for 2012. Expected to continue in 2013.

* (4) During the six months ended June 30, 2012, the Utility recorded a charge of $42 million, after-tax, for environmental remediation costs associated with the Utility's natural gas compressor site located near Hinkley, California (“Hinkley natural gas compressor site”). “Earnings from operations” is not calculated in accordance with GAAP and excludes items impacting comparability as described in Note (2) below. Items impacting comparability reconcile earnings from operations with Consolidated Income Available for Common Shareholders as reported in accordance with GAAP. PG&E Corporation’s subsidiary, Pacific Gas and Electric Company (“Utility”) incurred net costs of $183 million and $346 million, pre-tax, during the three and six months ended June 30, 2012, respectively, in connection with natural gas matters. For the three and six months ended June 30, 2012, these amounts included pipeline-related costs to validate safe operating pressures, conduct strength testing, and perform other activities associated with safety improvements to the Utility’s natural gas pipeline system, as well as legal and regulatory costs. These costs also included an increase in the accrual for third-party claims related to the San Bruno accident and were partially offset by insurance recoveries. Costs incurred for the six months ended June 30, 2012 also included a contribution to the City of San Bruno. There were no additional charges incurred during these periods related to penalties. Second Quarter, 2012 vs. 2011 (in millions, except per share amounts) Exhibit 4: Reconciliation of PG&E Corporation Earnings from Operations to Consolidated Income Available for Common Shareholders in Accordance with Generally Accepted Account Principles (“GAAP”)
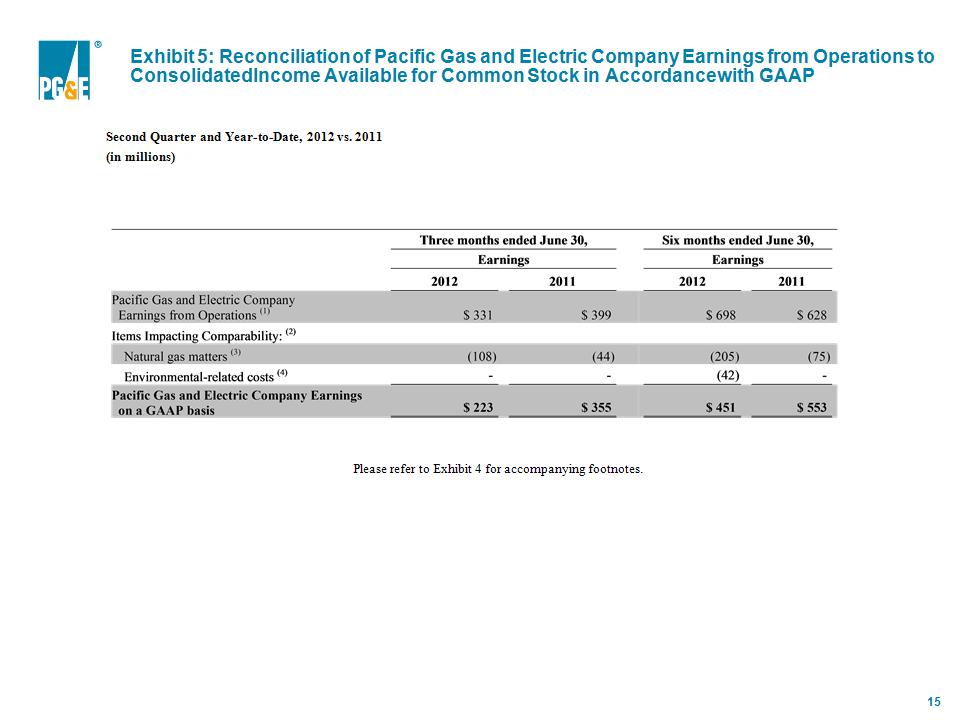
* Please refer to Exhibit 4 for accompanying footnotes. Second Quarter and Year-to-Date, 2012 vs. 2011 (in millions) Exhibit 5: Reconciliation of Pacific Gas and Electric Company Earnings from Operations to Consolidated Income Available for Common Stock in Accordance with GAAP
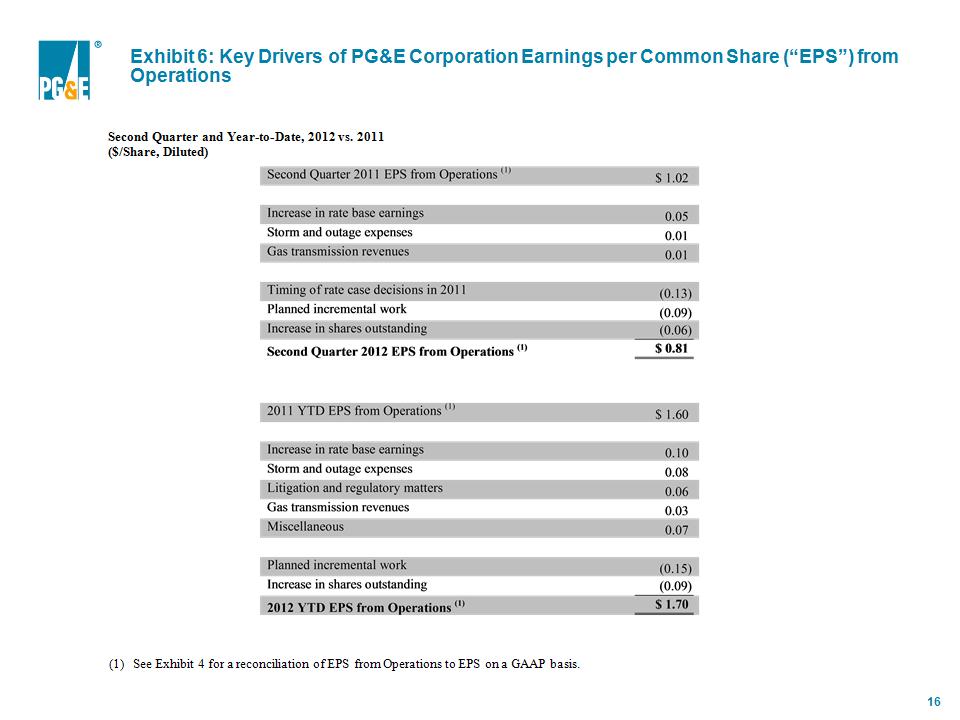
* See Exhibit 4 for a reconciliation of EPS from Operations to EPS on a GAAP basis. Second Quarter and Year-to-Date, 2012 vs. 2011 ($/Share, Diluted) Exhibit 6: Key Drivers of PG&E Corporation Earnings per Common Share (“EPS”) from Operations

* The 2012 target for earnings from operations is not publicly reported but is consistent with the guidance range provided for 2012 EPS from operations of $3.10 to $3.30. Second Quarter 2012 Performance See following slide for definitions of the operational performance metrics Exhibit 7: Operational Performance Metrics

* The Operational Performance Metrics focus on three areas: safety (public and employee), customer service, and financial performance. The EOY goals for each metric except for nuclear performance are stated relative to percentage improvement in prior year performance. The YTD Actual column provides actual percentage improvement (or decline) through the current quarter. The column titled “Meets YTD Target” shows illustratively whether or not the metric has met the YTD Target, which may be different from the EOY Target. Safety Public safety metrics focus on Utility operations in three areas: The safety of the Utility’s nuclear power operations is represented by 12 performance indicators for nuclear power generation reported to the Institute of Nuclear Power Operations (“INPO”) and compared to industry benchmarks. The safety of the Utility’s natural gas operations is represented by (a) the percentage improvement in number of completed grade 2 leak repairs, and (b) the percentage improvement in the emergency response times of utility gas personnel who are on-site within one hour, and within 30 minutes of receiving an immediate response gas emergency order. The safety of the Utility’s electric operations is represented by (a) the percentage improvement in the number of wire down events with resulting sustained unplanned outages, and (b) the percentage improvement in the emergency response times of utility electric personnel who relieve 911 personnel at the site of a potential PG&E electric hazard within 60 minutes. Employee safety metrics focus on two areas: The percentage improvement in the number of Lost Workday Cases incurred per 200,000 hours worked. A lost workday case is a current year OSHA recordable incident that has resulted in at least one lost workday. The percentage improvement in the Preventable MVI Rate, which measures the number of chargeable motor vehicle incidents per one million miles driven. A chargeable incident is one in which the employee-driver could have prevented an incident, but failed to take reasonable steps to do so. Customer Customer satisfaction and service reliability are measured in three areas. The percentage improvement in the Customer Satisfaction Score, which measures overall satisfaction with the Utility’s performance in delivering reliable service, pricing of services, and customer service experience. The score is weighted 60 percent for residential customers and 40 percent for small and medium business customers, based on a quarterly survey performed by an independent third-party research firm. Gas Operations Reliability is measured by the percentage improvement in the timeliness of jobs entered into the gas mapping system. Electric Operations Reliability is measured by the percentage improvement in the System Average Interruption Duration Index (“SAIDI”), which reflects the total time the average customer is without electric power, measured in minutes. Financial Earnings from operations measures PG&E Corporation’s earnings power from ongoing core operations. It allows investors to compare the underlying financial performance of the business from one period to another, exclusive of items that management believes do not reflect the normal course of operations (items impacting comparability). The measurement is not in accordance with GAAP. For a reconciliation of earnings from operations to earnings in accordance with GAAP, see Exhibit 4 - PG&E Corporation Earnings from Operations and GAAP Income. Definitions of 2012 Operational Performance Metrics from Exhibit 7

* See the discussions under Electricity Distribution Operating Statistics and Natural Gas Statistics in the 2011 Annual Report on Form 10-K for additional information. Second Quarter, 2012 vs. 2011 Exhibit 8: Pacific Gas and Electric Company Sales and Sources Summary
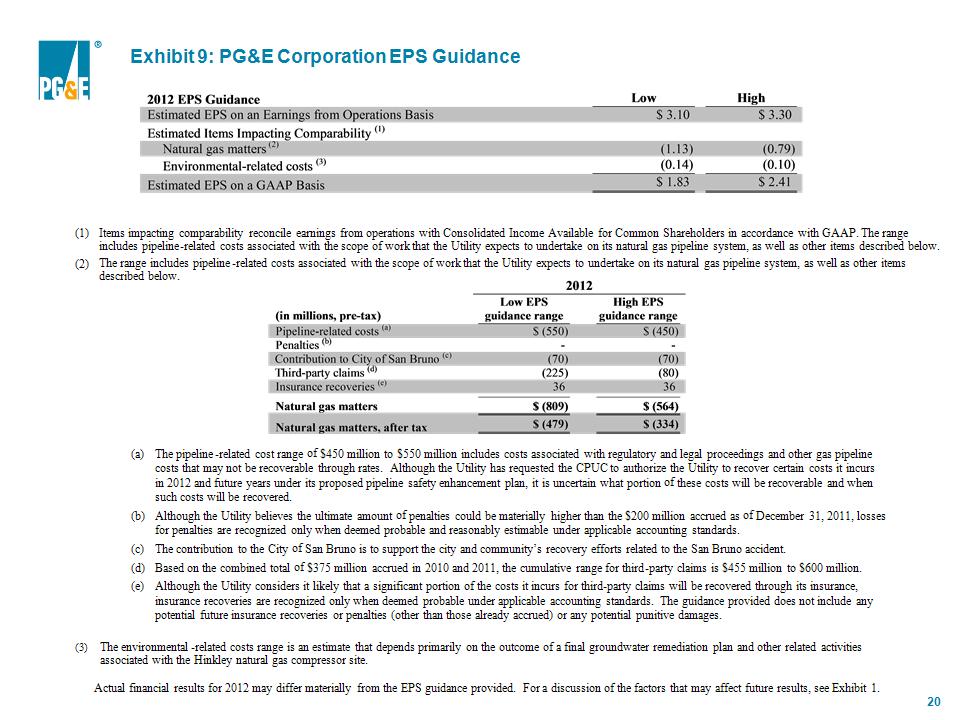
* Items impacting comparability reconcile earnings from operations with Consolidated Income Available for Common Shareholders in accordance with GAAP. The range includes pipeline-related costs associated with the scope of work that the Utility expects to undertake on its natural gas pipeline system, as well as other items described below. The range includes pipeline-related costs associated with the scope of work that the Utility expects to undertake on its natural gas pipeline system, as well as other items described below. The pipeline-related cost range of $450 million to $550 million includes costs associated with regulatory and legal proceedings and other gas pipeline costs that may not be recoverable through rates. Although the Utility has requested the CPUC to authorize the Utility to recover certain costs it incurs in 2012 and future years under its proposed pipeline safety enhancement plan, it is uncertain what portion of these costs will be recoverable and when such costs will be recovered. Although the Utility believes the ultimate amount of penalties could be materially higher than the $200 million accrued as of December 31, 2011, losses for penalties are recognized only when deemed probable and reasonably estimable under applicable accounting standards. The contribution to the City of San Bruno is to support the city and community’s recovery efforts related to the San Bruno accident. Based on the combined total of $375 million accrued in 2010 and 2011, the cumulative range for third-party claims is $455 million to $600 million. Although the Utility considers it likely that a significant portion of the costs it incurs for third-party claims will be recovered through its insurance, insurance recoveries are recognized only when deemed probable under applicable accounting standards. The guidance provided does not include any potential future insurance recoveries or penalties (other than those already accrued) or any potential punitive damages. (3) The environmental-related costs range is an estimate that depends primarily on the outcome of a final groundwater remediation plan and other related activities associated with the Hinkley natural gas compressor site. Actual financial results for 2012 may differ materially from the EPS guidance provided. For a discussion of the factors that may affect future results, see Exhibit 1. Exhibit 9: PG&E Corporation EPS Guidance

* Actual financial results for 2012 may differ materially from the guidance provided. For a discussion of the factors that may affect future results, see Exhibit 1. Exhibit 10: General Earnings Sensitivities PG&E Corporation and Pacific Gas and Electric Company

* Exhibit 11: Pacific Gas and Electric Company Summary of Selected Regulatory Cases

* Exhibit 11: Pacific Gas and Electric Company Summary of Selected Regulatory Cases (continued)