Attached files
| file | filename |
|---|---|
| 8-K - FORM 8-K - XERIUM TECHNOLOGIES INC | d392183d8k.htm |
| EX-99.1 - PRESS RELEASE OF XERIUM TECHNOLOGIES, INC. - XERIUM TECHNOLOGIES INC | d392183dex991.htm |
| EX-99.3 - SUPPLEMENTAL RECONCILIATIONS OF NON-GAAP INFORMATION - XERIUM TECHNOLOGIES INC | d392183dex993.htm |
EXHIBIT 99.2
Xerium Technologies, Inc. Second Quarter 2012 Selected Data – Earnings Call
| 1 |
|
August 7, 2012
Forward Looking Statements
This presentation and the remarks we may make today about Xerium’s future expectations, plans and prospects are forward-looking statements which reflect our current views with respect to future events and financial performance. Any forward-looking statements which we make in this presentation or in our remarks today, represent our views only as of today. We disclaim any duty to update any of these forward-looking statements.
Forward-looking statements involve risks and uncertainties, both known and unknown. Our actual results may differ materially from these forward-looking statements due to a number of factors, including those factors discussed in our earnings press release dated August 6, 2012, and other factors discussed in our filings with the SEC, including our Form 10-K for the year ended December 31, 2011, and our Form 10-Q for the quarter ended March 31, 2012. Copies of these filings are available from the SEC and in the investor relations section of our website at www.xerium.com.
These slides, the associated remarks and comments made during our second quarter 2012 financial results conference call, our earnings release dated August 6, 2012 and the reconciliation of certain non-GAAP financial information posted in the investor relations section of our website are integrally related and are intended to be presented and understood together.
| 2 |
|
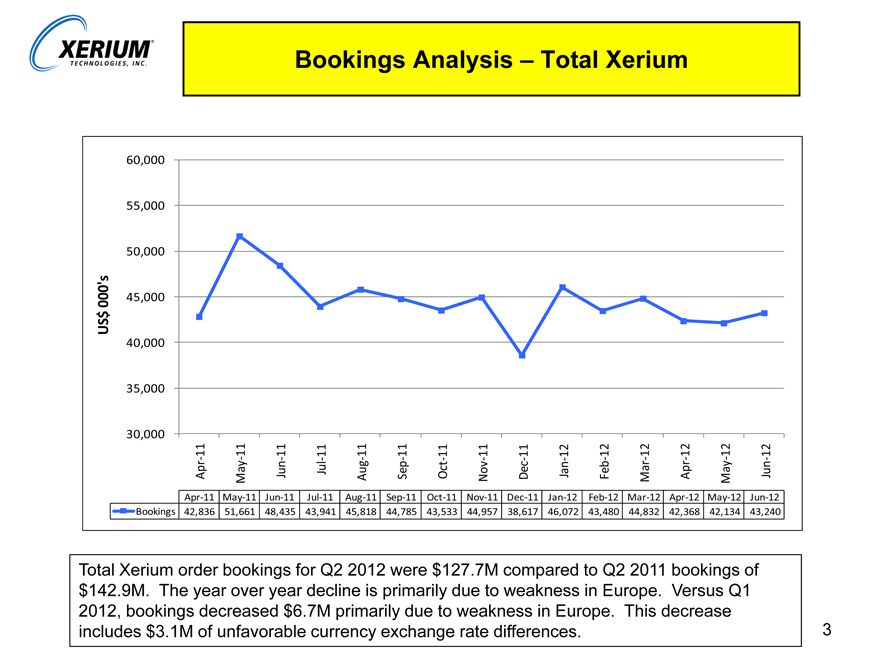
Bookings Analysis – Total Xerium
60,000
55,000
50,000
000’s 45,000
$
US
40,000
35,000
30,000
11 11 11 11 11 11 11 11 11 12 12 12 12 12 12
Aug
Apr May Jun Jul Sep Oct Nov Dec Jan Feb Mar Apr May Jun
Apr 11 May 11 Jun 11 Jul 11 Aug 11 Sep 11 Oct 11 Nov 11 Dec 11 Jan 12 Feb 12 Mar 12 Apr 12 May 12 Jun 12
Bookings 42,836 51,661 48,435 43,941 45,818 44,785 43,533 44,957 38,617 46,072 43,480 44,832 42,368 42,134 43,240
Total Xerium order bookings for Q2 2012 were $127.7M compared to Q2 2011 bookings of $142.9M. The year over year decline is primarily due to weakness in Europe. Versus Q1 2012, bookings decreased $6.7M primarily due to weakness in Europe. This decrease includes $3.1M of unfavorable currency exchange rate differences.
| 3 |
|
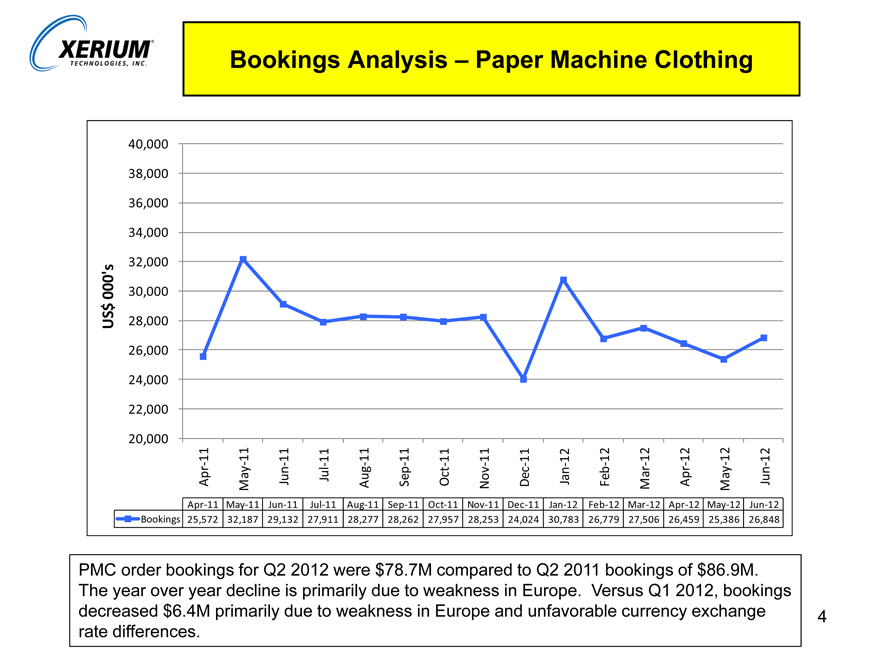
Bookings Analysis – Paper Machine Clothing
40,000
38,000
36,000
34,000
32,000
000’s 30,000
$
US 28,000
26,000
24,000
22,000
20,000
11 11 11 11 11 11 11 11 11 12 12 12 12 12 12
Aug
Apr May Jun Jul Sep Oct Nov Dec Jan Feb Mar Apr May Jun
Apr 11 May 11 Jun 11 Jul 11 Aug 11 Sep 11 Oct 11 Nov 11 Dec 11 Jan 12 Feb 12 Mar 12 Apr 12 May 12 Jun 12
Bookings 25,572 32,187 29,132 27,911 28,277 28,262 27,957 28,253 24,024 30,783 26,779 27,506 26,459 25,386 26,848
PMC order bookings for Q2 2012 were $78.7M compared to Q2 2011 bookings of $86.9M. The year over year decline is primarily due to weakness in Europe. Versus Q1 2012, bookings decreased $6.4M primarily due to weakness in Europe and unfavorable currency exchange rate differences.
| 4 |
|
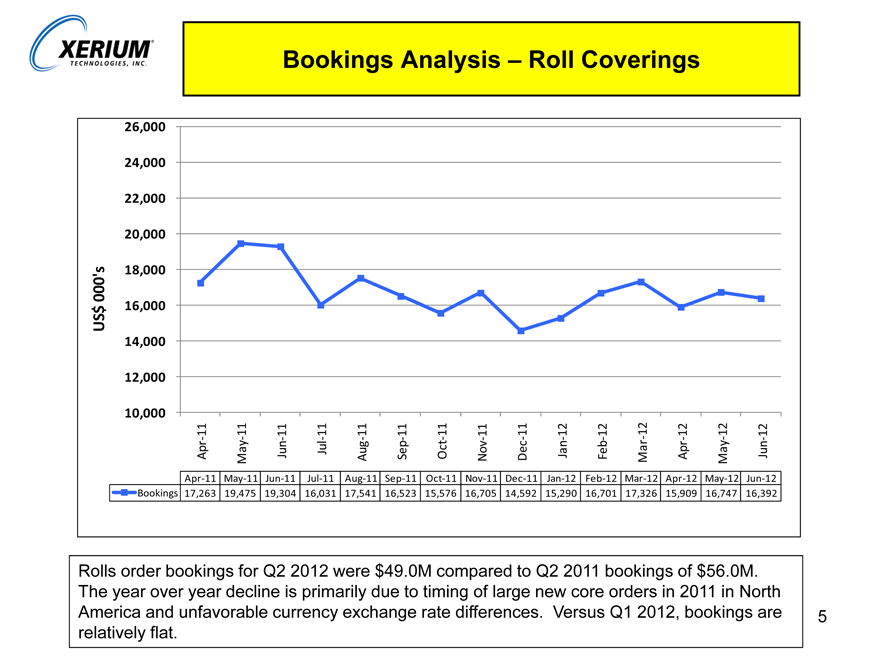
Bookings Analysis – Roll Coverings
26,000
24,000
22,000
20,000
000’s 18,000
$ 16,000
US
14,000
12,000
10,000
11 11 11 11 11 11 11 11 11 12 12 12 12 12 12
May Oct May
Apr Jun Jul Aug Sep Nov Dec Jan Feb Mar Apr Jun
Apr 11 May 11 Jun 11 Jul 11 Aug 11 Sep 11 Oct 11 Nov 11 Dec 11 Jan 12 Feb 12 Mar 12 Apr 12 May 12 Jun 12
Bookings 17,263 19,475 19,304 16,031 17,541 16,523 15,576 16,705 14,592 15,290 16,701 17,326 15,909 16,747 16,392
Rolls order bookings for Q2 2012 were $49.0M compared to Q2 2011 bookings of $56.0M. The year over year decline is primarily due to timing of large new core orders in 2011 in North America and unfavorable currency exchange rate differences. Versus Q1 2012, bookings are relatively flat.
| 5 |
|
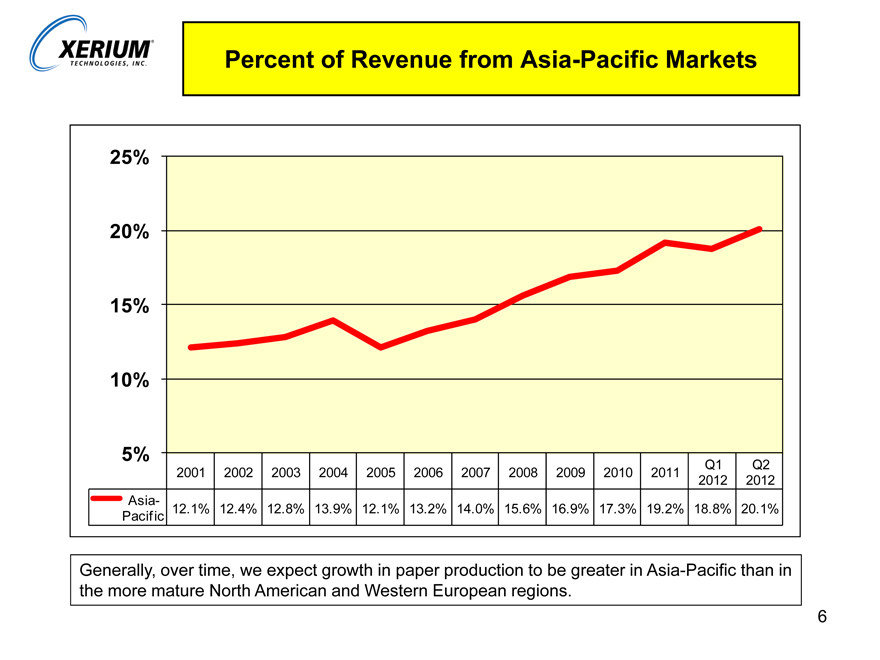
Percent of Revenue from Asia-Pacific Markets
25%
20%
15%
10%
5%
2001 2002 2003 2004 2005 2006 2007 2008 2009 2010 2011 Q1 Q2
2012 2012
PacificAsia- 12.1% 12.4% 12.8% 13.9% 12.1% 13.2% 14.0% 15.6% 16.9% 17.3% 19.2% 18.8% 20.1%
Generally, over time, we expect growth in paper production to be greater in Asia-Pacific than in the more mature North American and Western European regions.
| 6 |
|
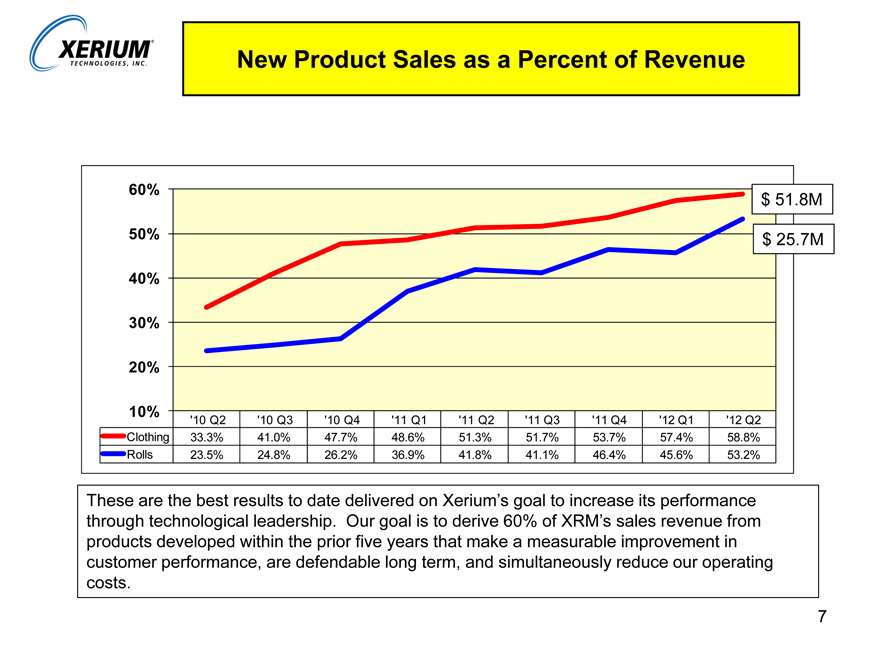
New Product Sales as a Percent of Revenue
60% $ 51.8M
50% $ 25.7M
40%
30%
20%
10% ‘10 Q2 ‘10 Q3 ‘10 Q4 ‘11 Q1 ‘11 Q2 ‘11 Q3 ‘11 Q4 ‘12 Q1 ‘12 Q2
Clothing 33.3% 41.0% 47.7% 48.6% 51.3% 51.7% 53.7% 57.4% 58.8%
Rolls 23.5% 24.8% 26.2% 36.9% 41.8% 41.1% 46.4% 45.6% 53.2%
These are the best results to date delivered on Xerium’s goal to increase its performance through technological leadership. Our goal is to derive 60% of XRM’s sales revenue from products developed within the prior five years that make a measurable improvement in customer performance, are defendable long term, and simultaneously reduce our operating costs.
| 7 |
|
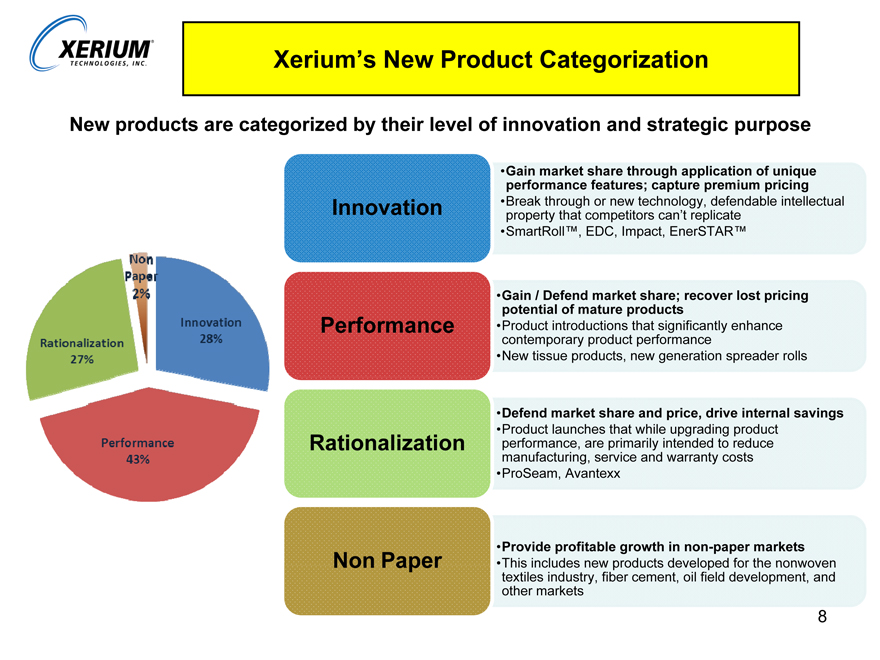
Xerium’s New Product Categorization
New products are categorized by their level of innovation and strategic purpose
Gain market share through application of unique performance features; capture premium pricing
Break through or new technology, defendable intellectual property that competitors can’t replicate
SmartRollTM, EDC, Impact, EnterSTARTM
Gain / Defend market share; recover lost pricing potential of mature products
Product introductions that significantly enhance contemporary product performance
New tissue products, new generation spreader rolls
Defend market share and price, drive internal savings
Product launches that while upgrading product performance, are primarily intended to reduce manufacturing, service and warranty costs
ProSeam, Avantexx
Provide profitable growth in non-paper markets
This includes new products developed for the nonwoven textiles industry, fiber cement, oil field development, and other markets
Innovation 28%
Performance 43%
Rationalization 27%
Non Paper 2%
Innovation
Performance
Rationalization
Non Paper
| 8 |
|
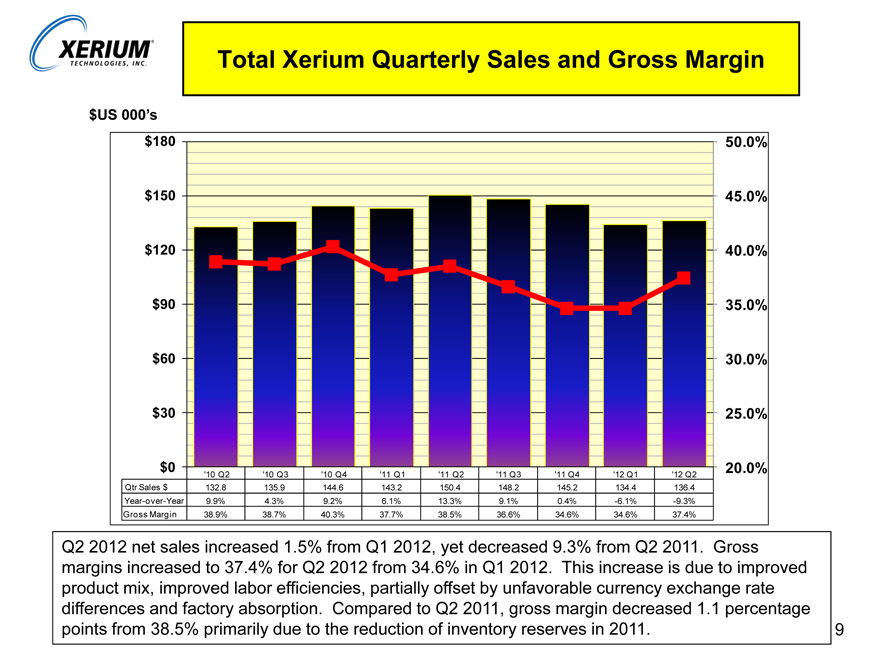
Total Xerium Quarterly Sales and Gross Margin
$US 000’s
$180 50.0%
$150 45.0%
$120 40.0%
$90 35.0%
$60 30.0%
$30 25.0%
$0 20.0%
‘10 Q2 ‘10 Q3 ‘10 Q4 ‘11 Q1 ‘11 Q2 ‘11 Q3 ‘11 Q4 ‘12 Q1 ‘12 Q2
Qtr Sales $ 132.8 135.9 144.6 143.2 150.4 148.2 145.2 134.4 136.4
Year-over-Year 9.9% 4.3% 9.2% 6.1% 13.3% 9.1% 0.4% -6.1% -9.3%
Gross Margin 38.9% 38.7% 40.3% 37.7% 38.5% 36.6% 34.6% 34.6% 37.4%
Q2 2012 net sales increased 1.5% from Q1 2012, yet decreased 9.3% from Q2 2011. Gross margins increased to 37.4% for Q2 2012 from 34.6% in Q1 2012. This increase is due to improved product mix, improved labor efficiencies, partially offset by unfavorable currency exchange rate differences and factory absorption. Compared to Q2 2011, gross margin decreased 1.1 percentage points from 38.5% primarily due to the reduction of inventory reserves in 2011.
9
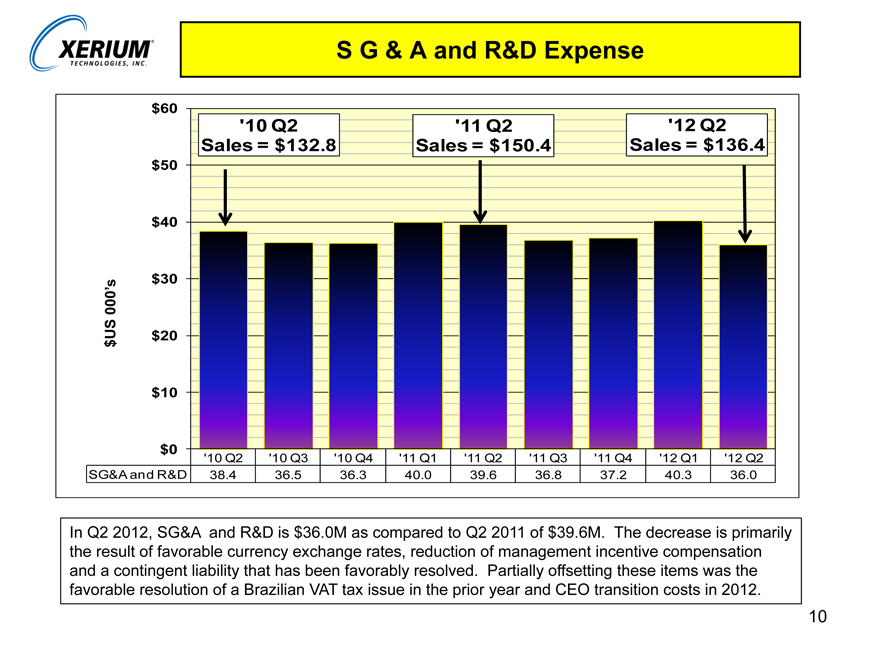
S G & A and R&D Expense
$60
‘10 Q2 ‘11 Q2 ‘12 Q2
Sales = $132.8 Sales = $150.4 Sales = $136.4
$50
$40
$30
000’s
US $20
$
$10
$0 ‘10 Q2 ‘10 Q3 ‘10 Q4 ‘11 Q1 ‘11 Q2 ‘11 Q3 ‘11 Q4 ‘12 Q1 ‘12 Q2
SG&A and R&D 38.4 36.5 36.3 40.0 39.6 36.8 37.2 40.3 36.0
In Q2 2012, SG&A and R&D is $36.0M as compared to Q2 2011 of $39.6M. The decrease is primarily the result of favorable currency exchange rates, reduction of management incentive compensation and a contingent liability that has been favorably resolved. Partially offsetting these items was the favorable resolution of a Brazilian VAT tax issue in the prior year and CEO transition costs in 2012.
10
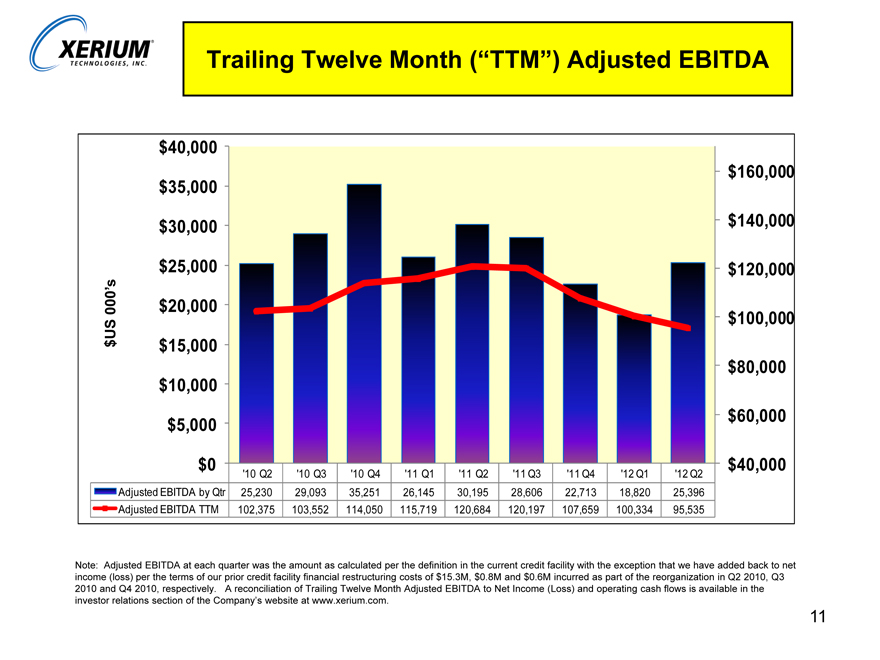
Trailing Twelve Month (“TTM”) Adjusted EBITDA
$40,000
$160,000
$35,000
$30,000 $140,000
$25,000 $120,000
000’s $20,000
US $100,000
$ $15,000
$80,000
$10,000
$5,000 $60,000
$0 $40,000
‘10 Q2 ‘10 Q3 ‘10 Q4 ‘11 Q1 ‘11 Q2 ‘11 Q3 ‘11 Q4 ‘12 Q1 ‘12 Q2
Adjusted EBITDA by Qtr 25,230 29,093 35,251 26,145 30,195 28,606 22,713 18,820 25,396
Adjusted EBITDA TTM 102,375 103,552 114,050 115,719 120,684 120,197 107,659 100,334 95,535
Note: Adjusted EBITDA at each quarter was the amount as calculated per the definition in the current credit facility with the exception that we have added back to net income (loss) per the terms of our prior credit facility financial restructuring costs of $15.3M, $0.8M and $0.6M incurred as part of the reorganization in Q2 2010, Q3 2010 and Q4 2010, respectively. A reconciliation of Trailing Twelve Month Adjusted EBITDA to Net Income (Loss) and operating cash flows is available in the investor relations section of the Company’s website at www.xerium.com.
11
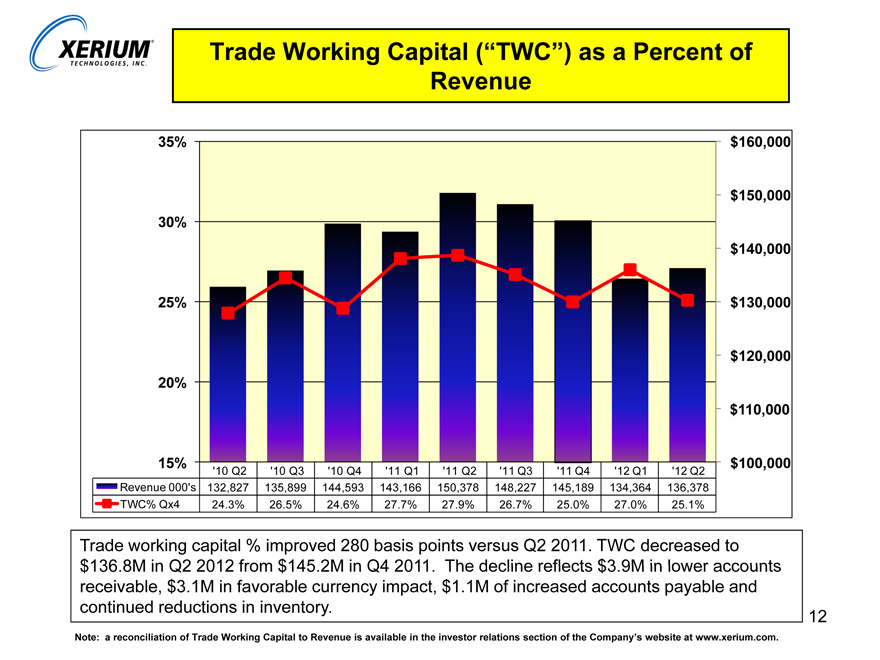
Trade Working Capital (“TWC”) as a Percent of Revenue
35% $160,000
$150,000
30%
$140,000
25% $130,000
$120,000
20%
$110,000
15% $100,000
‘10 Q2 ‘10 Q3 ‘10 Q4 ‘11 Q1 ‘11 Q2 ‘11 Q3 ‘11 Q4 ‘12 Q1 ‘12 Q2
Revenue 000’s 132,827 135,899 144,593 143,166 150,378 148,227 145,189 134,364 136,378
TWC% Qx4 24.3% 26.5% 24.6% 27.7% 27.9% 26.7% 25.0% 27.0% 25.1%
Trade working capital % improved 280 basis points versus Q2 2011. TWC decreased to $136.8M in Q2 2012 from $145.2M in Q4 2011. The decline reflects $3.9M in lower accounts receivable, $3.1M in favorable currency impact, $1.1M of increased accounts payable and continued reductions in inventory.
Note: a reconciliation of Trade Working Capital to Revenue is available in the investor relations section of the Company’s website at www.xerium.com.
12
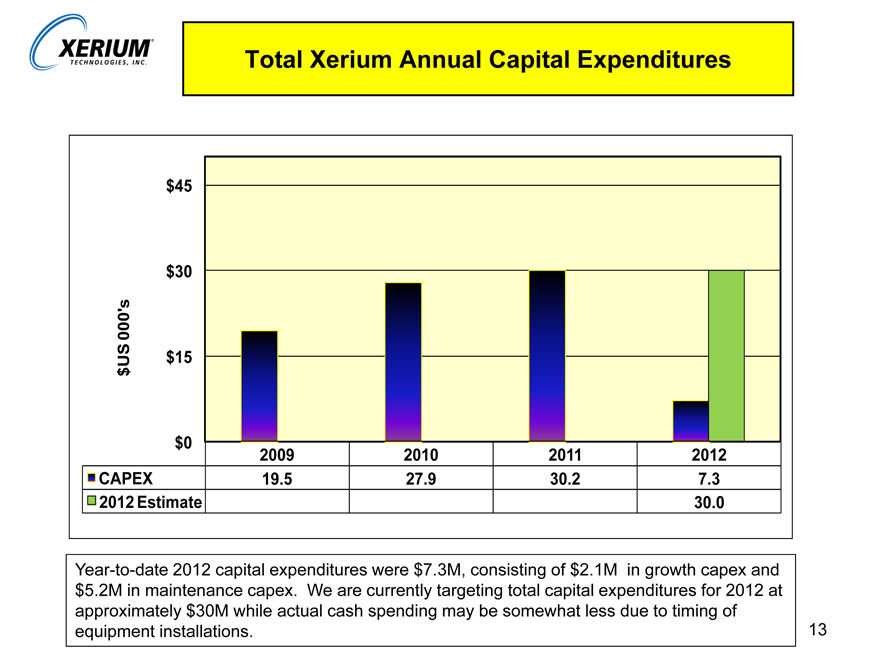
Total Xerium Annual Capital Expenditures
$45
$30
000’s
US $15
$
$0
2009 2010 2011 2012
CAPEX 19.5 27.9 30.2 7.3
2012 Estimate 30.0
Year-to-date 2012 capital expenditures were $7.3M, consisting of $2.1M in growth capex and $5.2M in maintenance capex. We are currently targeting total capital expenditures for 2012 at approximately $30M while actual cash spending may be somewhat less due to timing of equipment installations.
13