Attached files
| file | filename |
|---|---|
| 8-K - SHENANDOAH TELECOMMUNICATIONS COMPNAY 8-K 8-3-2012 - SHENANDOAH TELECOMMUNICATIONS CO/VA/ | form8k.htm |
Exhibit 99.1

2Q 2012 Earnings Conference Call August 3, 2012 Exhibit 99.1
* Safe Harbor Statement This presentation includes “forward-looking statements” within the meaning of Section 27A of the Securities Act and Section 21E of the Securities Exchange Act of 1934, as amended, regarding, among other things, our business strategy, our prospects and our financial position. These statements can be identified by the use of forward-looking terminology such as “believes,” “estimates,” “expects,” “intends,” “may,” “will,” “should,” “could,” or “anticipates” or the negative or other variation of these similar words, or by discussions of strategy or risks and uncertainties. These statements are based on current expectations of future events. If underlying assumptions prove inaccurate or unknown risks or uncertainties materialize, actual results could vary materially from the Company’s expectations and projections. Important factors that could cause actual results to differ materially from such forward-looking statements include, without limitation, risks related to the following: Increasing competition in the communications industry; and A complex and uncertain regulatory environment. A further list and description of these risks, uncertainties and other factors can be found in the Company’s SEC filings which are available online at www.sec.gov, www.shentel.com or on request from the Company. The Company does not undertake to update any forward-looking statements as a result of new information or future events or developments.

* Use of Non-GAAP Financial Measures Included in this presentation are certain non-GAAP financial measures that are not determined in accordance with US generally accepted accounting principles. These financial performance measures are not indicative of cash provided or used by operating activities and exclude the effects of certain operating, capital and financing costs and may differ from comparable information provided by other companies, and they should not be considered in isolation, as an alternative to, or more meaningful than measures of financial performance determined in accordance with US generally accepted accounting principles. These financial performance measures are commonly used in the industry and are presented because Shentel believes they provide relevant and useful information to investors. Shentel utilizes these financial performance measures to assess its ability to meet future capital expenditure and working capital requirements, to incur indebtedness if necessary, return investment to shareholders and to fund continued growth. Shentel also uses these financial performance measures to evaluate the performance of its businesses and for budget planning purposes.

* Chris French CEO and President
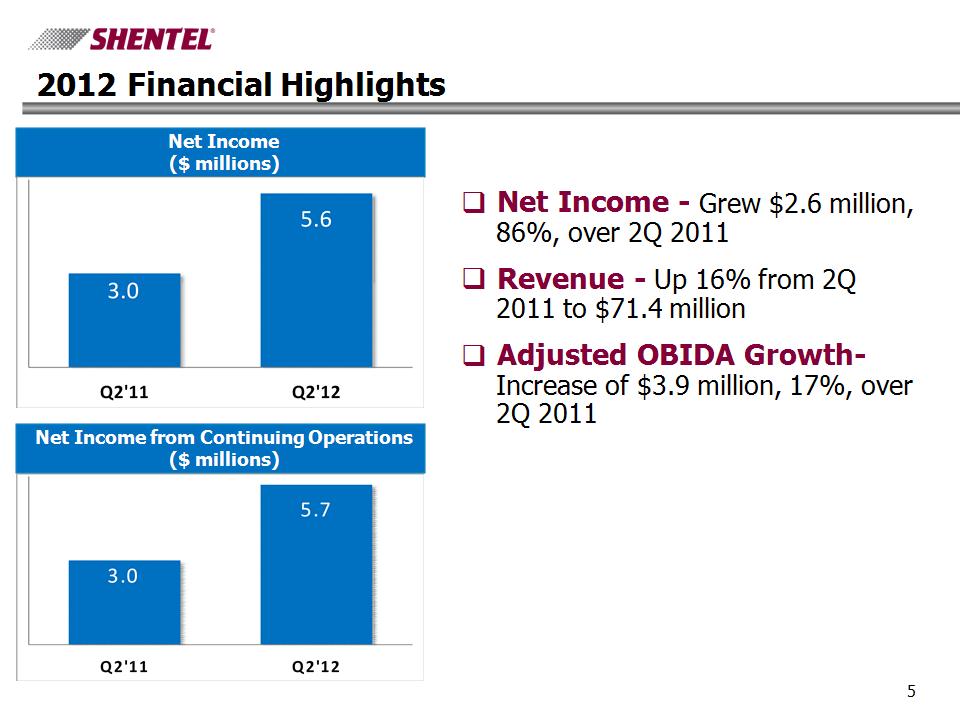
* 2012 Financial Highlights Net Income ($ millions) Net Income from Continuing Operations ($ millions) Net Income – Grew $2.6 million, 86%, over 2Q 2011 Revenue – Up 16% from 2Q 2011 to $71.4 million Adjusted OBIDA Growth- Increase of $3.9 million, 17%, over 2Q 2011
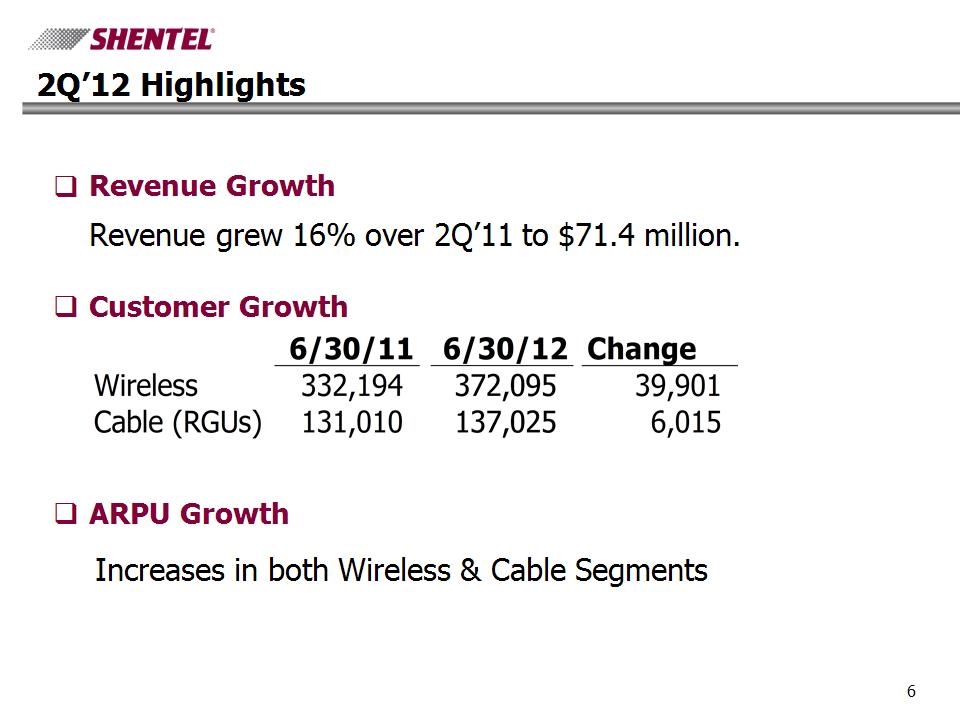
* 2Q’12 Highlights Revenue Growth Revenue grew 16% over 2Q’11 to $71.4 million. Customer Growth ARPU Growth Increases in both Wireless & Cable Segments
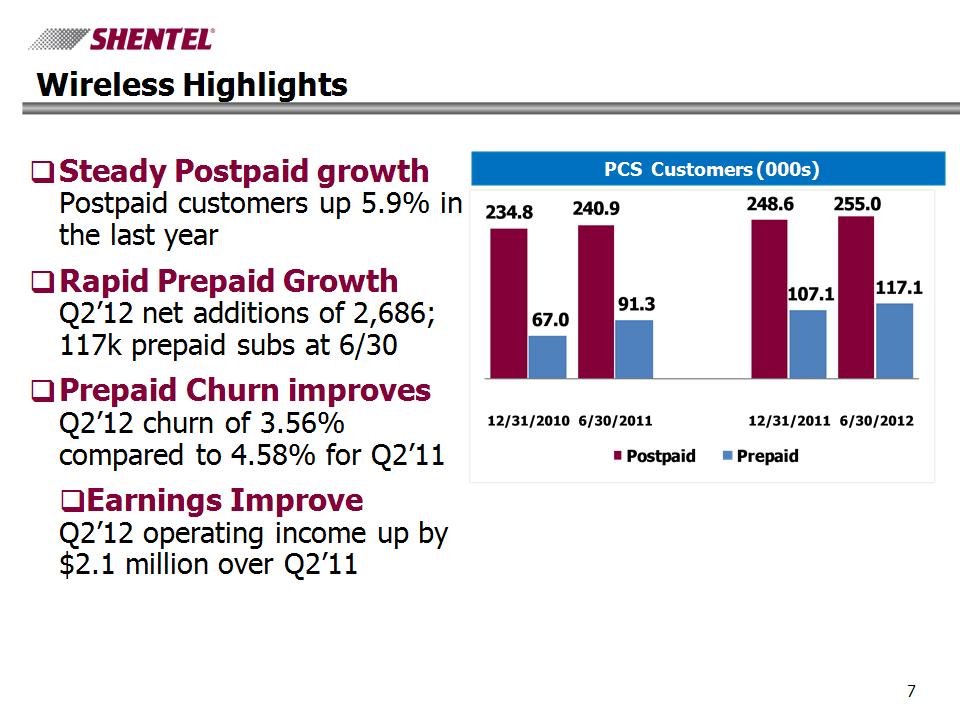
* Wireless Highlights PCS Customers (000s) Steady Postpaid growth Postpaid customers up 5.9% in the last year Rapid Prepaid Growth Q2’12 net additions of 2,686; 117k prepaid subs at 6/30 Prepaid Churn improves Q2’12 churn of 3.56% compared to 4.58% for Q2’11 Earnings Improve Q2’12 operating income up by $2.1 million over Q2’11
* Cable Highlights RGU Growth Year-over-year RGU growth of 4.6% at 6/30/2012 137,025 RGUs at 6/30/2012 Cable Upgrades Started the final planned upgrade to markets acquired in mid-2010. Expect to complete by the end of 2012

* Adele Skolits CFO and VP of Finance
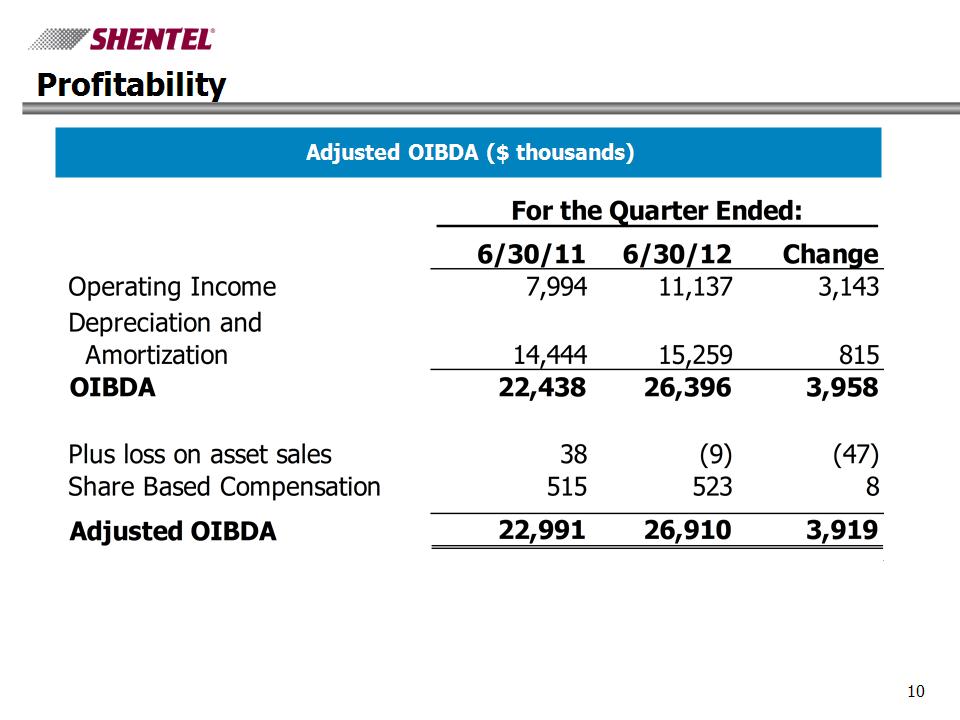
* Profitability Adjusted OIBDA ($ thousands)

* Adjusted OIBDA by Segment ($ millions)
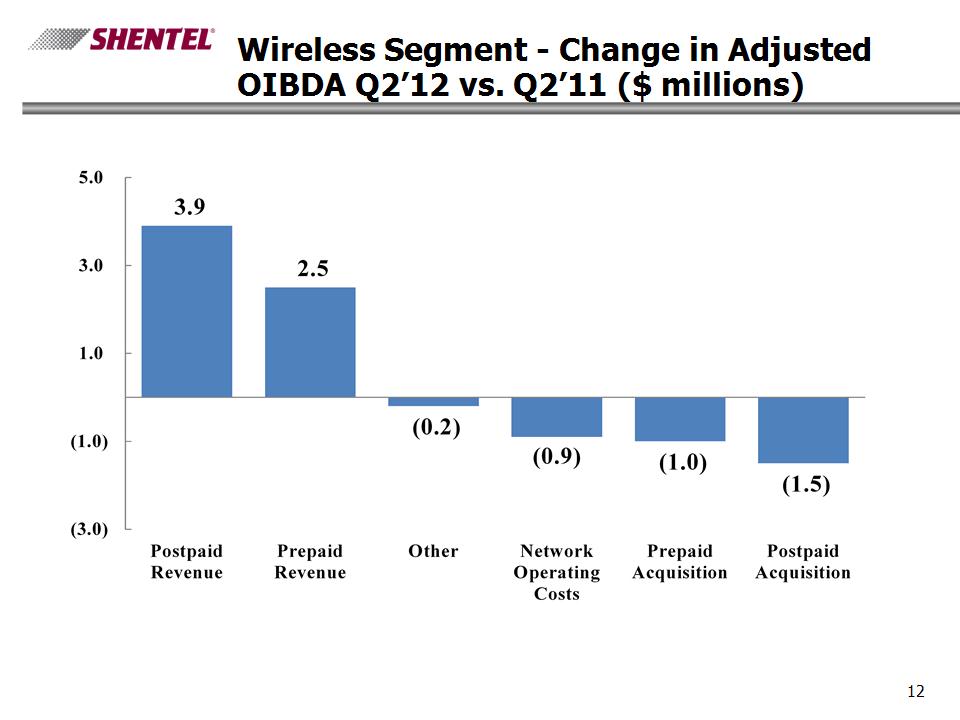
* Wireless Segment – Change in Adjusted OIBDA Q2’12 vs. Q2’11 ($ millions)
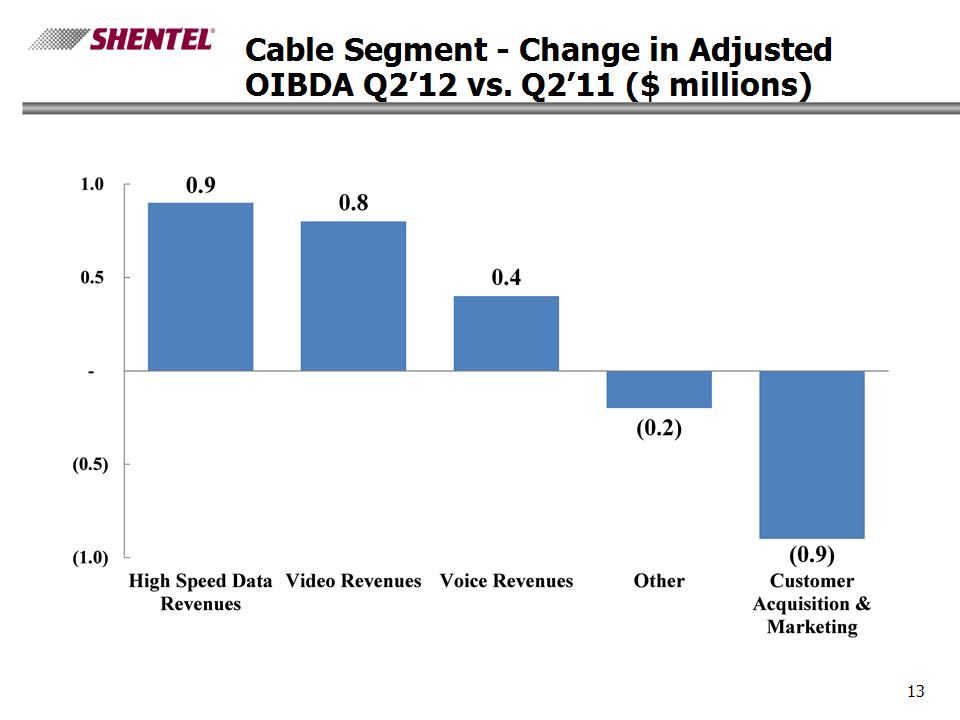
* Cable Segment – Change in Adjusted OIBDA Q2’12 vs. Q2’11 ($ millions)
* Earle MacKenzie EVP and COO
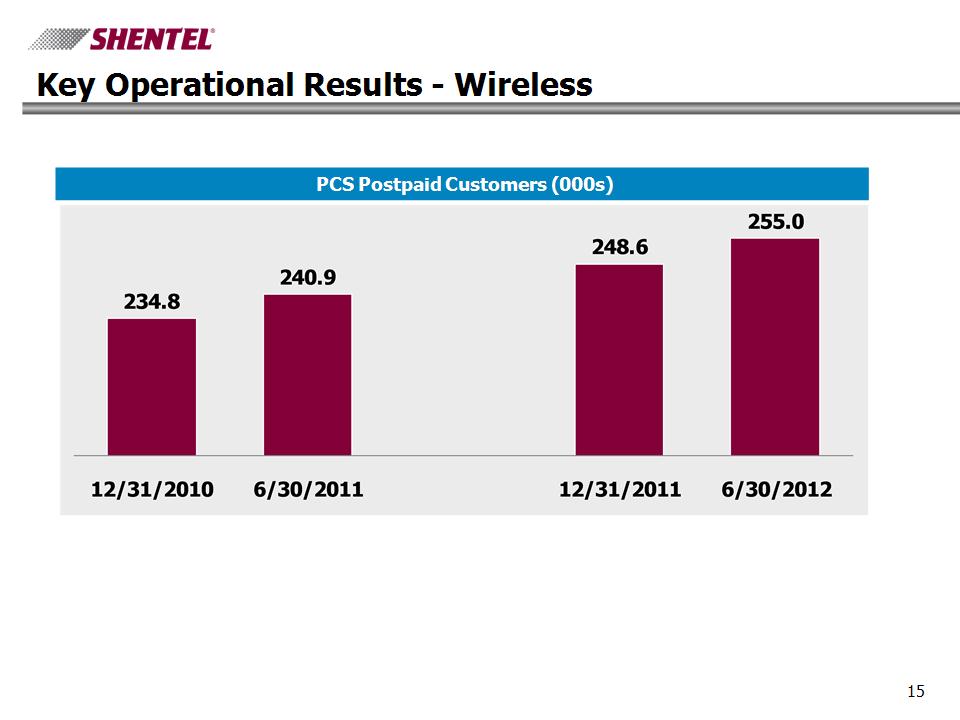
* Key Operational Results – Wireless PCS Postpaid Customers (000s)
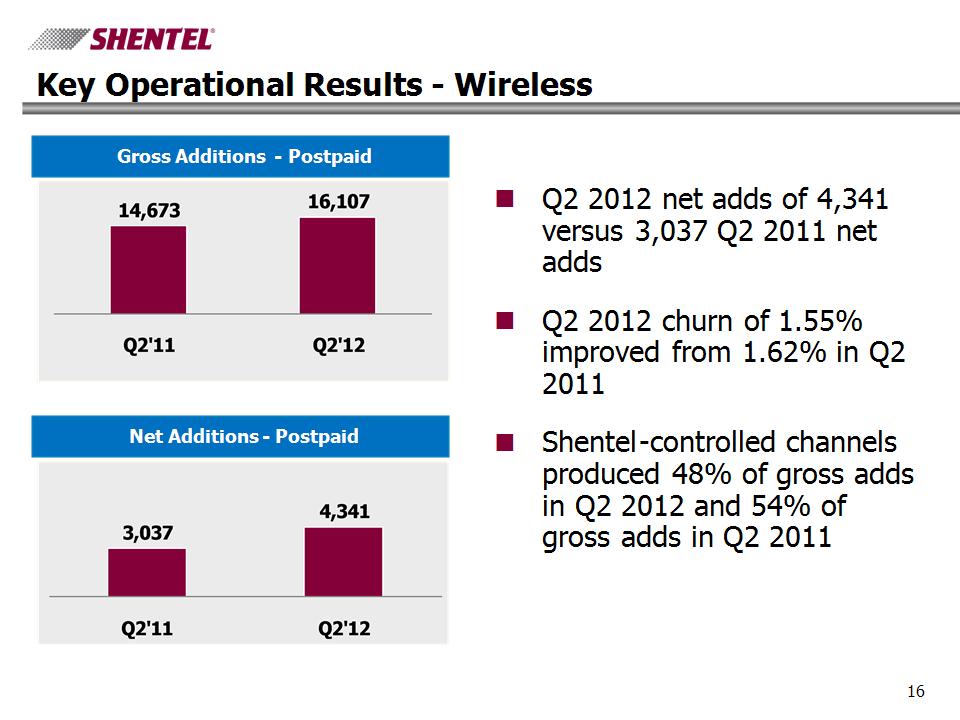
* Key Operational Results – Wireless Gross Additions - Postpaid Net Additions - Postpaid Q2 2012 net adds of 4,341 versus 3,037 Q2 2011 net adds Q2 2012 churn of 1.55% improved from 1.62% in Q2 2011 Shentel-controlled channels produced 48% of gross adds in Q2 2012 and 54% of gross adds in Q2 2011
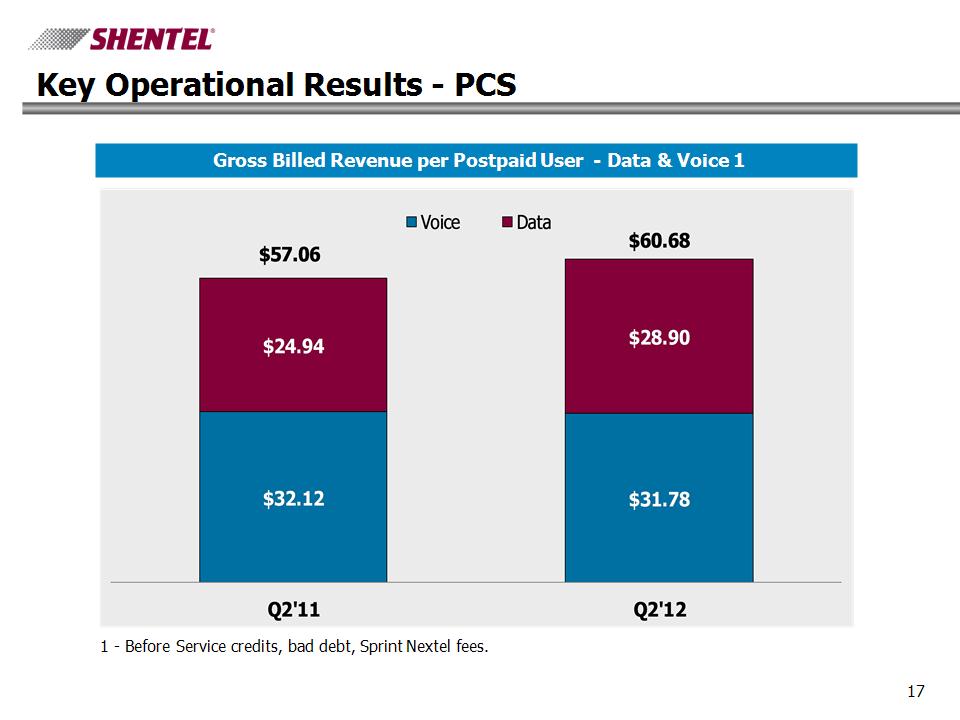
* Key Operational Results – PCS Gross Billed Revenue per Postpaid User – Data & Voice 1 1 – Before Service credits, bad debt, Sprint Nextel fees.
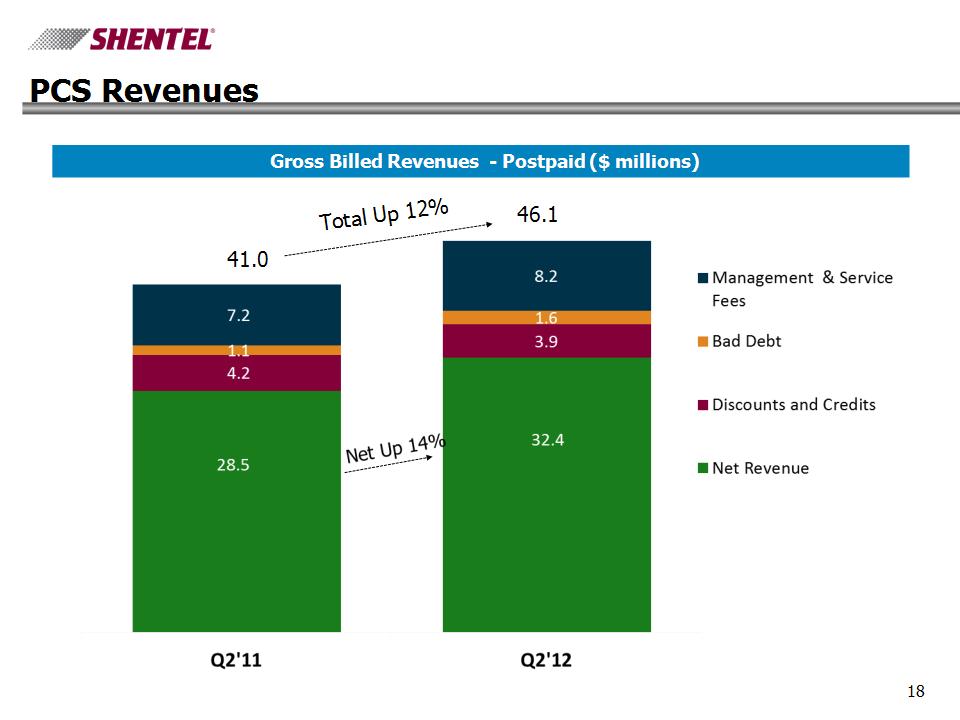
* PCS Revenues Gross Billed Revenues - Postpaid ($ millions) 41.0 46.1 Total Up 12%

* Postpaid PCS Customers Top Picks Q2 2012 Smartphones made up 59% of the Postpaid base in Q2 2012, up from 53% in Q4 2011 and 44% in Q2 2011 Top Service Plans – 66% of Gross Adds Everything Data Family 1500 – 44% Everything 450 – 15% Business Advantage Talk 200 – 7% Top Devices – New Activations - All Channels iPhone 17% Kyocera DuraMax 17% Samsung Epic 4G Touch 12%
* iPhone Statistics – Q2’12 17% of Q2 Gross Adds 41% of iPhones were sold or upgraded in Shentel-controlled channels 9.8% of 6/30/2012 Postpaid customers had the iPhone, up from 6.8% at 3/31/12 59% iPhone 4S 41% iPhone 4

* PCS Prepaid Statistics Gross Additions (000s) Cumulative Customers (000s)

* PCS Prepaid Statistics Churn % Average Gross Billed Revenue
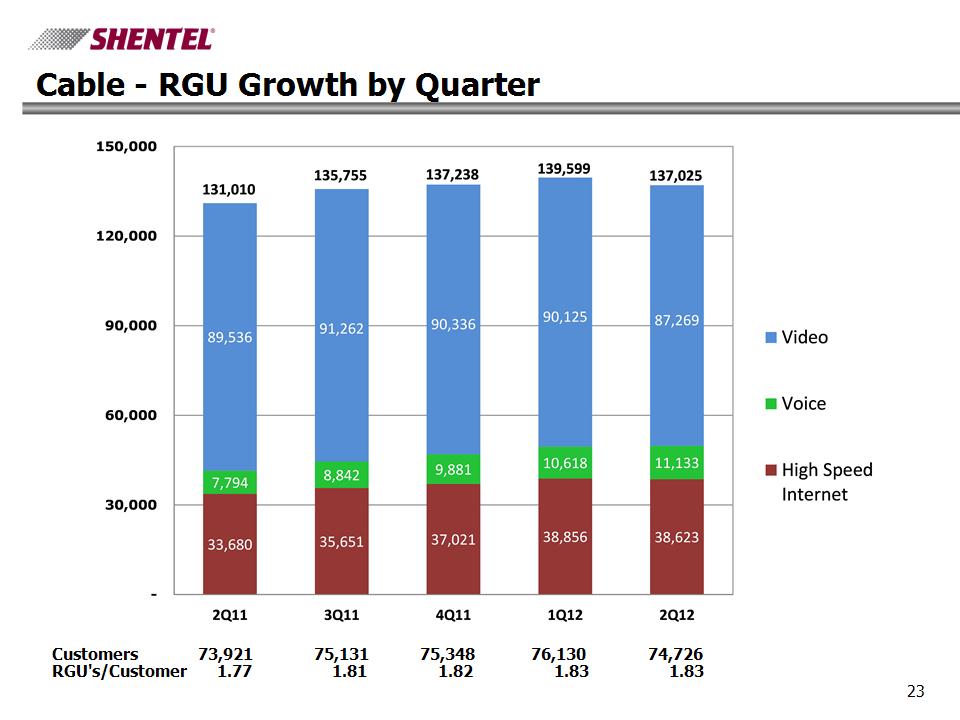
* Cable - RGU Growth by Quarter Customers 73,921 75,131 75,348 76,130 74,726 RGU's/Customer 1.77 1.81 1.82 1.83 1.83
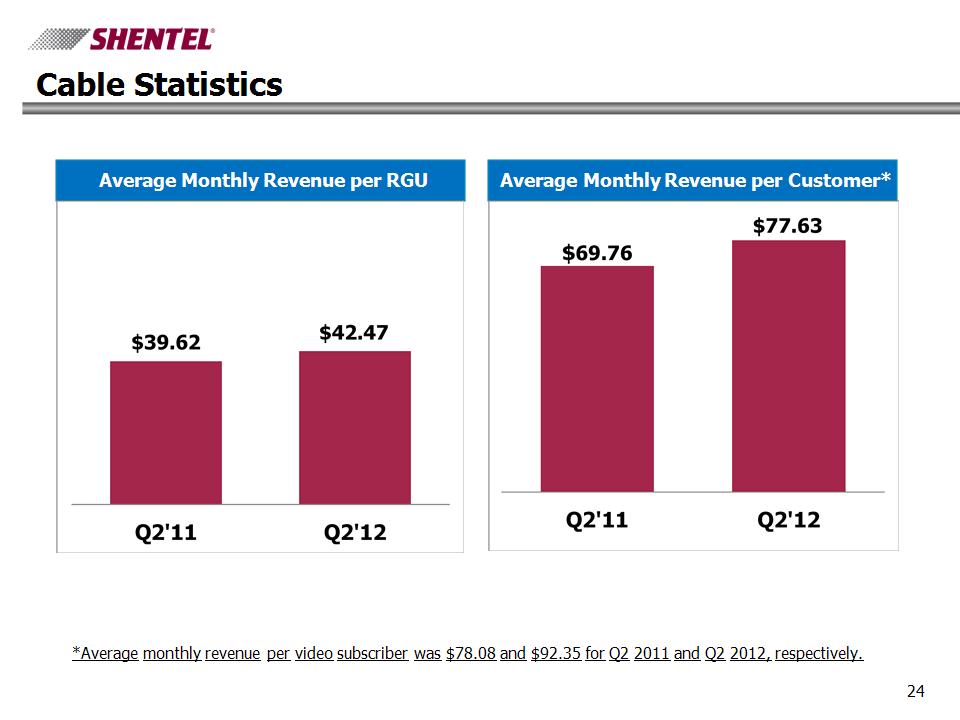
* Cable Statistics Average Monthly Revenue per RGU Average Monthly Revenue per Customer* *Average monthly revenue per video subscriber was $78.08 and $92.35 for Q2 2011 and Q2 2012, respectively.

* Key Operational Results - Cable Note: Video homes passed includes 16K homes located in Shenandoah County, VA, where internet and voice services are provided by the Wireline segment.
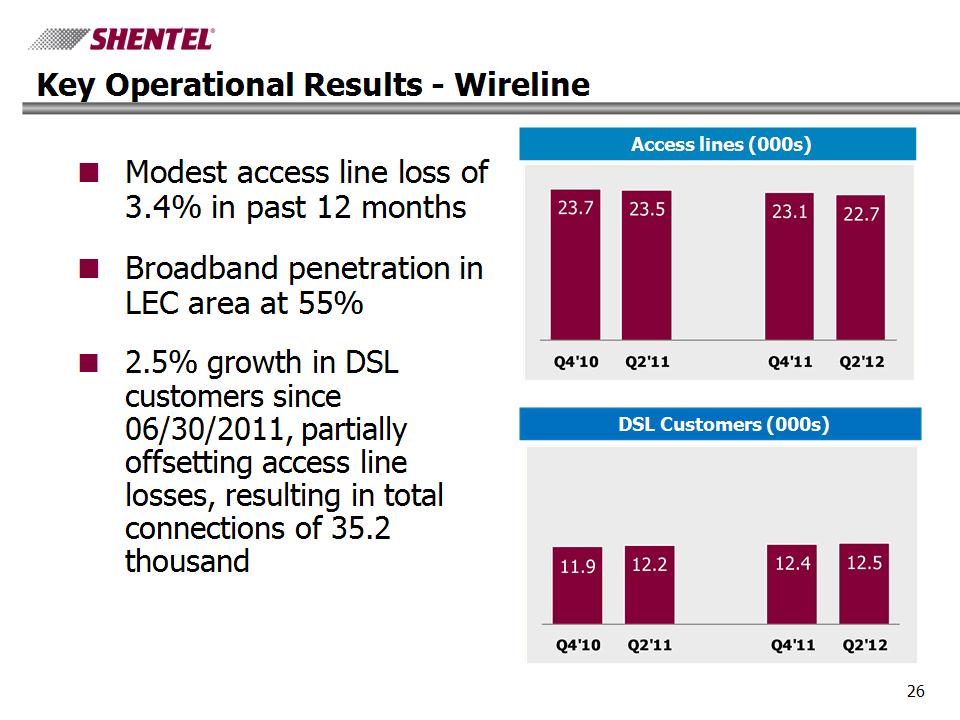
* Key Operational Results - Wireline Modest access line loss of 3.4% in past 12 months Broadband penetration in LEC area at 55% 2.5% growth in DSL customers since 06/30/2011, partially offsetting access line losses, resulting in total connections of 35.2 thousand Access lines (000s) DSL Customers (000s)
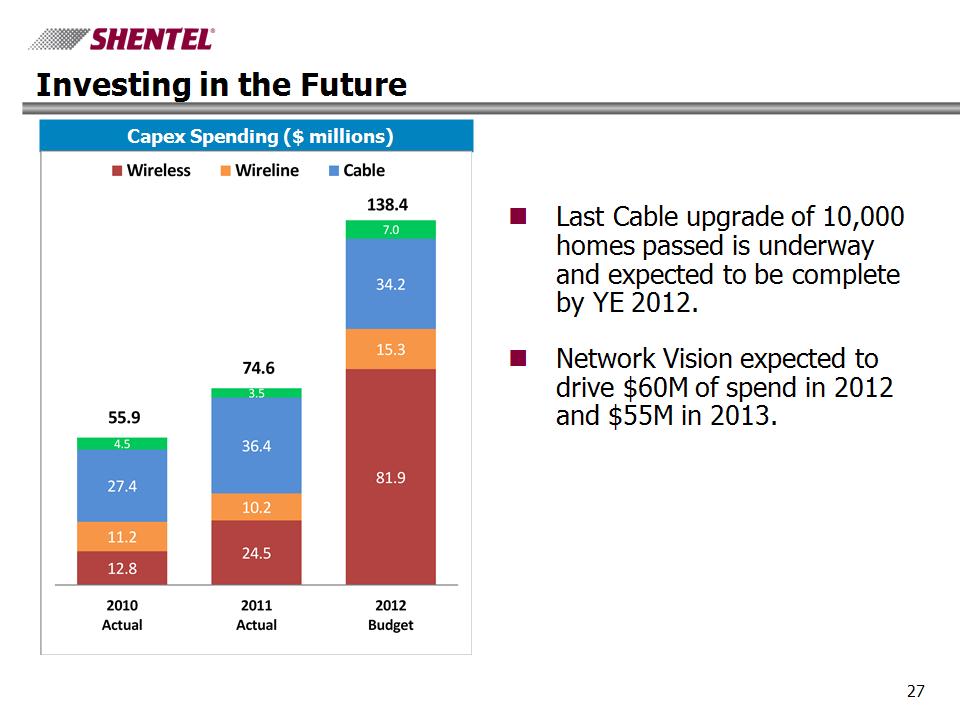
* Investing in the Future Last Cable upgrade of 10,000 homes passed is underway and expected to be complete by YE 2012. Network Vision expected to drive $60M of spend in 2012 and $55M in 2013. Capex Spending ($ millions)

* Q&A

* Appendix
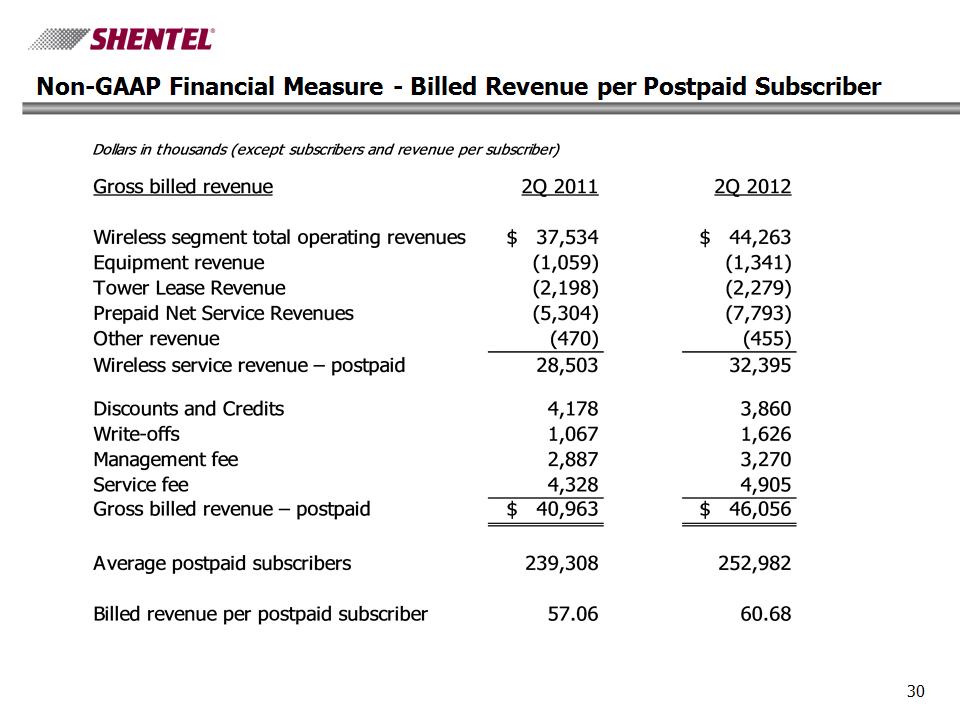
* Non-GAAP Financial Measure – Billed Revenue per Postpaid Subscriber