Attached files
| file | filename |
|---|---|
| 8-K - OVERSEAS SHIPHOLDING GROUP INC | q220128k.htm |
| EX-99.1 - OVERSEAS SHIPHOLDING GROUP INC | q220128kex991.htm |
Exhibit 99.2

Second Quarter Fiscal 2012 Earnings
Conference Call
Conference Call
August 1, 2012

page 2
Forward-Looking Statements
This presentation contains forward-looking statements regarding the Company's prospects, including the outlook
for tanker and articulated tug barge markets, changing oil trading patterns, anticipated levels and timing of
newbuilding and scrapping, prospects for certain strategic alliances and investments, including OSG’s U.S. Flag
business unit, projected scheduled drydock and off hire days for the third and fourth quarters of 2012, projected
locked-in charter revenue and locked-in time charter days for the remaining six months of 2012 and 2013
through 2016 and thereafter, OSG’s ability to achieve its liquidity raising objectives, including satisfactory long-
term financing, estimated revenue and expense items, levels of equity income and capital expenditures for 2012,
the profitability in 2012 of certain business units and OSG’s LNG and FSO joint ventures, OSG’s ability to
access capital markets, raise additional debt financing and sell assets, OSG’s ability to further reduce general
and administrative expense and vessel expenses, prospects of OSG’s strategy of being a market leader in the
segments in which it competes, the projected growth of the Jones Act and world tanker fleets, and the forecast
of world economic activity and oil demand. These statements are based on certain assumptions made by OSG
management based on its experience and perception of historical trends, current conditions, expected future
developments and other factors it believes are appropriate in the circumstances. Forward-looking statements
are subject to a number of risks, uncertainties and assumptions, many of which are beyond the control of OSG,
which may cause actual results to differ materially from those implied or expressed by the forward-looking
statements. Factors, risks and uncertainties that could cause actual results to differ from the expectations
reflected in these forward-looking statements are described in the Company’s Annual Report for 2011 on Form
10-K and those risks discussed in the other reports OSG files with the Securities and Exchange Commission.

page 3
Financial Highlights for 2Q2012
< The second quarter of 2012 opened with improving trading conditions in our key International
markets that gave way in May as seasonal and technical demand turned lower
markets that gave way in May as seasonal and technical demand turned lower
• Adjusted 2Q2012 net loss of $46.0M or $1.52 per diluted share
• Cash flow from operations in 2Q2012 was + $10.1M and + $19.6M for 6 mos. thru June 30
< The 2Q2012 spot rate for MRs was $10,500/day, after our early Q2 bookings of $15,500/day
• Activity fell due to reduced demand and the closure of the Hovensa and Aruba refineries
• The May collapse in product prices shut down the cross-Atlantic arbitrage trade
• Stronger Atlantic basin markets drew in MRs from weaker Far East markets
< In International Crude, inventory building ahead of Iran embargo and Motiva startup drove spot
rate strength in late Q1 / early Q2
rate strength in late Q1 / early Q2
• Reversal of inventory cycle, tepid U.S. and European oil demand, temporary loss of Motiva volumes and
negative seasonality have taken a toll on demand in the larger Crude classes
negative seasonality have taken a toll on demand in the larger Crude classes
• Activity in Aframax market remains subdued - TCEs are little changed from $10-13k over the last 5 qtrs
• As a result, the Q2 average Crude TCE rate was similar to Q1’s - but quarter ended on a weak note
< Weak International market conditions persist as we proceed through the third quarter
< Continued strength in our Jones Act markets - 2Q2012 operating income of $16.7M 1
< Continued focus on cost containment at sea and ashore
• Average 2012 YTD International and U.S. Flag daily vessel expenses remain well inside of 2012 budget
• Consolidation of International Flag technical management in Athens is on track - annual savings of $3 - 4M
with enhanced efficiency
with enhanced efficiency
1 Before direct and allocated general and administrative expense, equity in income of affiliates and gain/(loss) on vessel dispositions.

page 4
Liquidity Update
< In July, OSG drew down the $343 million in remaining availability under the
$1.5 billion revolving credit facility
$1.5 billion revolving credit facility
< This was a prudent step to ensure continued liquidity in light of the ongoing
difficult market conditions we are operating in
difficult market conditions we are operating in
< The cash will be available for general corporate purposes. It is invested in short
-term U.S. Treasury securities and similar high-quality, highly liquid money
market instruments
-term U.S. Treasury securities and similar high-quality, highly liquid money
market instruments
< Combined with the cash we already had on hand, we now have cash of over
$550 million
$550 million
< We are working with our banks to put in place new long term financing for the
Company, while also pursuing other liquidity raising options
Company, while also pursuing other liquidity raising options

page 5
Outlook for International Crude Markets
Modest improvement expected for full year 2012 compared with 2011
Modest improvement expected for full year 2012 compared with 2011
< The Crude tanker market remains oversupplied, but ordering restraint remains intact
• We forecast net Crude fleet growth of 6% in 2012, 5% in 2013 and 1% in 2014
< Global oil demand forecast to increase in 2H2012 to 90.7 mbpd 1
• Increase of 1.0 mbpd over 2H2011 and 1.6 mbpd over 1H2012
• Full year 2013 forecast for oil demand is now 90.9 mbpd, a 1.0 mbpd increase (+1.1%) over 2012
< Increasing U.S. crude production will continue to displace imports, partially offset by:
• Long-haul AG-West VLCC movements will resume with startup of Motiva refinery expansion in 2013
• Suezmax demand should benefit from production at Trainer and Philadelphia refineries in the
Delaware Bay
Delaware Bay
< Despite moderating economic growth, China/Asia to continue to drive tonne-mile
demand growth
demand growth
• New Asian refining capacity coming online - 840 kbpd in 2H2012 and 930 kbpd in 2013
• West African exports to Asia should be restored as Brent-Dubai spread (now $4) normalizes with
completion of North Sea maintenance in late 3Q2012
completion of North Sea maintenance in late 3Q2012
• Latin America is forecast to increase exports to Asia to 1.1 mbpd in 2H2012, a 25% increase vs.
2011
2011
1 Global oil demand forecast per International Energy Agency (IEA).

page 6
Outlook for International Products Markets
< Net fleet growth to remain restrained at about 2.5% in both 2012 and 2013
< The U.S. Gulf Coast is now firmly established as a key Products export center
• Highly competitive due to access to cheap domestic crudes and natural gas feedstock
• Export growth driven primarily by strong Latin American demand
- Forecast growth of 150 kbpd per year in both 2012 and 2013
• Startup of Valero’s hydrocrackers and Motiva expansion in 2013 should increase product exports
< Improving prospects for increased cross-Atlantic trade
• Potential for higher gasoline/additive movements from Europe into U.S. East Coast
- Lower U.S. ethanol production due to Midwest drought
• European diesel demand bottoming - local refinery closures create import requirement that
should benefit MRs
should benefit MRs
< New long-haul MR trade developing from U.S. West Coast to South America
< Increased Asian product trade flows should draw back MRs that repositioned to the Atlantic
basin in 1H2012
basin in 1H2012
• Shutdown of Australian refinery capacity to increase long-haul import requirement
• Increase in export refining capacity in India to result in growth in product movements East and West

page 7
Outlook for U.S. Flag Markets
Jones Act market continues to improve
Jones Act market continues to improve
< Positive Jones Act fundamentals remain intact
• Restrained fleet growth - net increase of only 4 vessels to 58 thru 2015
• U.S. Gulf refiners benefiting from closure of Hovensa refinery, which supplied
Florida with 150 kbpd of clean products
Florida with 150 kbpd of clean products
• Motiva startup in 2013 provides opportunity for longer term Jones Act
demand growth
demand growth
< Our 12 Jones Act tankers are all on time charter - 2012 renewals are
being done at consecutively higher rates
being done at consecutively higher rates
< Four of our clean Products ATBs are now on time charter
< Recently announced transactions for the Philadelphia and Trainer
refineries in the Delaware Bay are positive for our Jones Act business
refineries in the Delaware Bay are positive for our Jones Act business

page 8
Management Priorities
< Reach agreement with our banks to put in place long-term financing that
allows us to manage through an extended downturn in our markets
allows us to manage through an extended downturn in our markets
< Execute some of the other liquidity raising options we have been pursuing
< Capitalize on strong U.S. Flag fundamentals, sustain commercial
outperformance in International Flag segments and improve results from
our LNG and FSO joint ventures
outperformance in International Flag segments and improve results from
our LNG and FSO joint ventures
< Continue to keep costs on shore and at sea under control
< Maintain high technical performance of the fleet at the same time we
pursue further fuel efficiency savings and tight management of drydock
costs
pursue further fuel efficiency savings and tight management of drydock
costs

page *
Financial Review
Myles Itkin, CFO

page 10
Financial Review - Income Statement
Reflects improved results from U.S. Flag Product Carriers
and ATBs and higher average spot rates for VLCCs and
Suezmaxes, partially offset by weaker rates for Aframaxes
and MRs
and ATBs and higher average spot rates for VLCCs and
Suezmaxes, partially offset by weaker rates for Aframaxes
and MRs
Reflects $3.0M in retention bonuses, partially offset by
$2.6M reduction in compensation for shore-based staff
relating to headcount reductions and decreased incentive
compensation accruals
$2.6M reduction in compensation for shore-based staff
relating to headcount reductions and decreased incentive
compensation accruals
Reflects newbuild deliveries in U.S. Flag, Int’l Products
and VLCC fleets
and VLCC fleets
Costs associated with the relocation of technical
management operations for the International Crude fleet
management operations for the International Crude fleet
Reflects increase in the average amount of variable rate
debt outstanding, along with a decline in capitalized
interest resulting from the completion of the construction
on several newbuilds and commitment fees on the
forward start facility entered in May 2011
debt outstanding, along with a decline in capitalized
interest resulting from the completion of the construction
on several newbuilds and commitment fees on the
forward start facility entered in May 2011
Reflects $3.9M in unrealized losses on FFAs and bunker
swaps and $3.4M in net losses on securities / investments
swaps and $3.4M in net losses on securities / investments

page 11
Financial Review - Balance Sheet
Reflects $229M drawn under revolving credit facility
Includes CIP of $86M for 2 Aframaxes
Reflects transfer of marketable securities portfolio to
short term investments which were sold in June 2012
short term investments which were sold in June 2012
Reflects $256M related to excess of current unsecured
revolving credit facility (plus outstanding letters of
credit), which matures in February 2013, over the
$900M capacity of the forward start facility
revolving credit facility (plus outstanding letters of
credit), which matures in February 2013, over the
$900M capacity of the forward start facility
Cash balances will be available to the extent
necessary to pay down any excess revolver
balance prior to the effectiveness of the
forward start facility in February 2013
necessary to pay down any excess revolver
balance prior to the effectiveness of the
forward start facility in February 2013

page 12
2012 Guidance

page *
Appendix

page 14
Reconciling Items
Special Items Affecting Net Loss
Set forth below are significant items of income and expense that affected the Company’s results for the three and six months ended June 30,
2012 and 2011, all of which are typically excluded by securities analysts in their published estimates of the Company’s financial results.
2012 and 2011, all of which are typically excluded by securities analysts in their published estimates of the Company’s financial results.

page 15
Reconciling Items (cont’d)
EBITDA
EBITDA represents operating earnings before interest expense and income taxes and depreciation and amortization expense. EBITDA is
presented to provide investors with meaningful additional information that management uses to monitor ongoing operating results and evaluate
trends over comparative periods. EBITDA should not be considered a substitute for net income / (loss) or cash flow from operating activities
prepared in accordance with accounting principles generally accepted in the United States or as a measure of profitability or liquidity. While
EBITDA is frequently used as a measure of operating results and performance, it is not necessarily comparable to other similarly titled captions of
other companies due to differences in methods of calculation.
TCE Revenues

page 16
Fleet Composition - As of July 30, 2012
|
|
Owned
|
Chartered-in
|
Total
|
Newbuild
|
Total
|
|
VLCC 1
|
11
|
2
|
13
|
-
|
13
|
|
FSO
|
2
|
-
|
2
|
-
|
2
|
|
Suezmax
|
-
|
3
|
3
|
-
|
3
|
|
Aframax
|
4
|
4
|
8
|
2
|
10
|
|
Panamax
|
9
|
-
|
9
|
-
|
9
|
|
Lightering
|
4
|
2
|
6
|
-
|
6
|
|
Total Crude
|
30
|
11
|
41
|
2
|
43
|
|
LR1
|
4
|
2
|
6
|
-
|
6
|
|
MR 2
|
17
|
22
|
39
|
-
|
39
|
|
Total Products
|
21
|
24
|
45
|
-
|
45
|
|
Product Carrier
|
2
|
10
|
12
|
-
|
12
|
|
Clean ATB
|
7
|
-
|
7
|
-
|
7
|
|
Lightering ATB
|
3
|
-
|
3
|
-
|
3
|
|
Total U.S. Flag
|
12
|
10
|
22
|
-
|
22
|
|
Total Gas
|
4
|
-
|
4
|
-
|
4
|
|
TOTAL
|
67
|
45
|
112
|
2
|
114
|
1 Includes 1 owned ULCC. 2 Includes 2 owned U.S. Flag MRs that trade internationally, an owned car carrier and a chartered-in chemical tanker.
Note: Excludes charters-in of less than one year: 0.2 VLCCs, 3.6 Suezmaxes, 2.0 Aframaxes and 1.0 Aframax Lightering (based on percent interest).
page 17
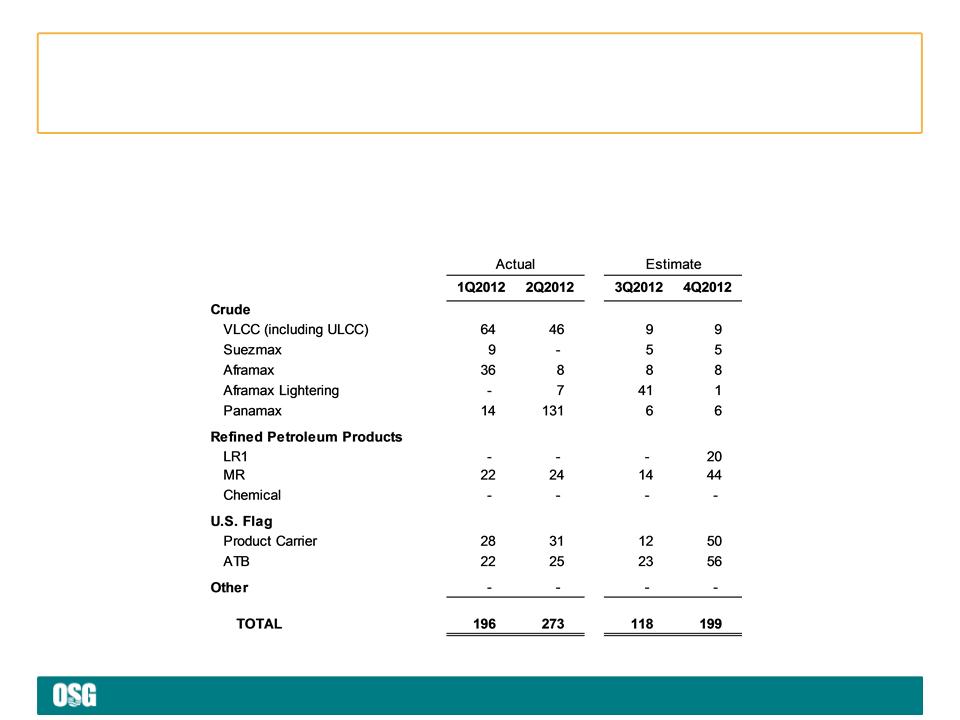
Off Hire Schedule
Off Hire and Scheduled Drydock
In addition to regular inspections by OSG personnel, all vessels are subject to periodic drydock, special survey and other scheduled or known
maintenance and repairs. The table below sets forth, by vessel class, actual days off hire for the first and second quarters of 2012 and
anticipated days off hire for the third and fourth quarters of 2012 for the above-mentioned events.
maintenance and repairs. The table below sets forth, by vessel class, actual days off hire for the first and second quarters of 2012 and
anticipated days off hire for the third and fourth quarters of 2012 for the above-mentioned events.

page 18
Charter Hire Expense by Segment
For the Quarter Ended June 30, 2012
($ in thousands)
Note: Vessels chartered-in for less than one year are not on the Company’s fleet list.
All from vessels
not on fleet list
not on fleet list
All from vessels
not on fleet list
not on fleet list
Includes $10.9 mil
from vessels not
on fleet list
from vessels not
on fleet list
Includes $10.9 mil
from vessels not
on fleet list
from vessels not
on fleet list

page 19
Future Revenue $/Days by Segment
As of June 30, 2012
As of June 30, 2012
Locked-in Time Charter
Days by Segment
Days by Segment
Locked-in Time Charter
Revenue by Segment
Revenue by Segment
($ in 000)
Locked-in
Charter Revenue
Charter Revenue
($ in 000)
Note: Locked-in time charter days for 2012 are as of 6/30/12 and will differ from a more current date used in Appendices 3 and 4 in the quarterly
earnings press release.
earnings press release.

www.osg.com