Attached files
| file | filename |
|---|---|
| 8-K - 8-K - EarthLink Holdings, LLC | a12-17564_18k.htm |
| EX-99.1 - EX-99.1 - EarthLink Holdings, LLC | a12-17564_1ex99d1.htm |
Exhibit 99.2
|
|
Q2 2012 Earnings Highlights August 2, 2012 |
|
|
|

|
|
1 Participants Rolla Huff Chairman & Chief Executive Officer Joe Wetzel President & Chief Operating Officer Louis Alterman Vice President Finance & Investor Relations Brad Ferguson Chief Financial Officer |

|
|
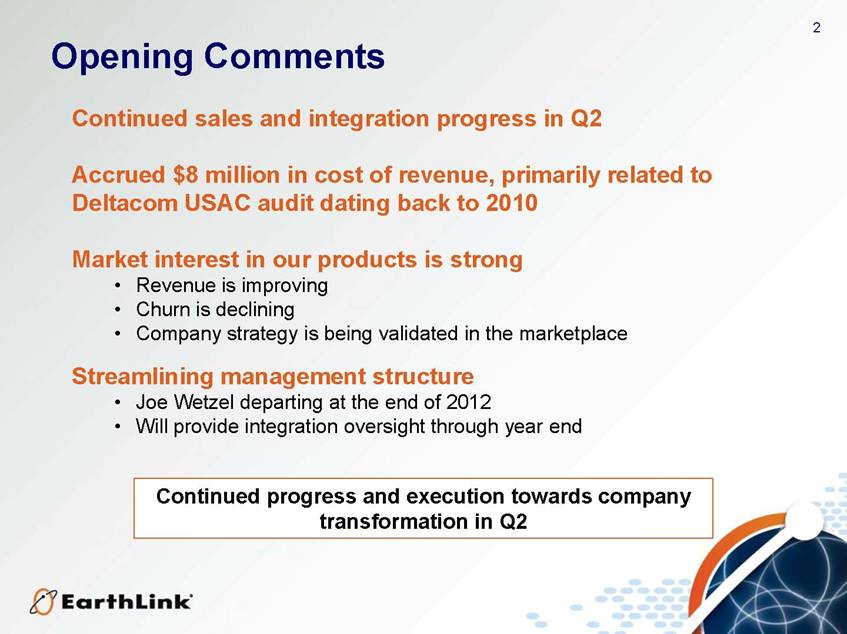
2 Opening Comments Continued sales and integration progress in Q2 Accrued $8 million in cost of revenue, primarily related to Deltacom USAC audit dating back to 2010 Market interest in our products is strong Revenue is improving Churn is declining Company strategy is being validated in the marketplace Streamlining management structure Joe Wetzel departing at the end of 2012 Will provide integration oversight through year end Continued progress and execution towards company transformation in Q2 |
|
|
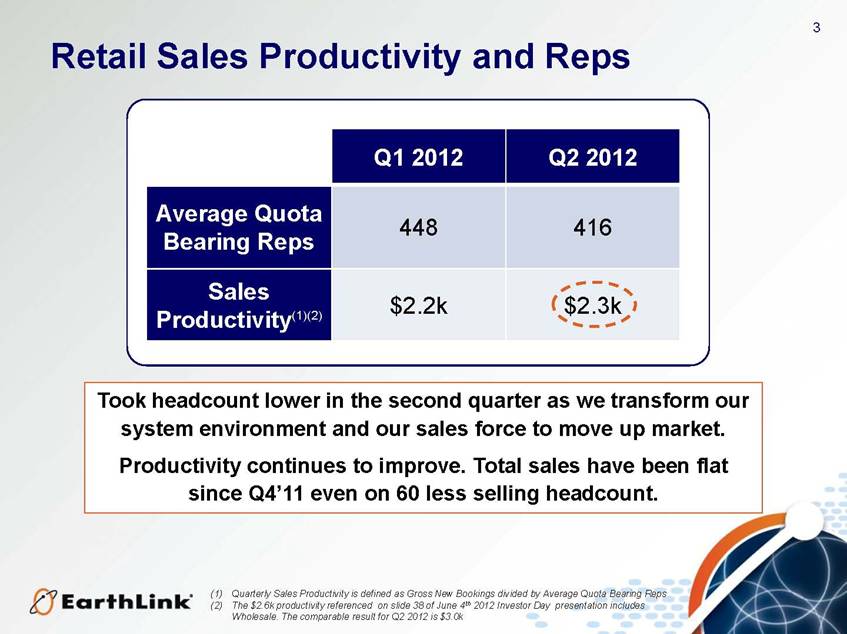
3 Retail Sales Productivity and Reps Q1 2012 Q2 2012 Average Quota Bearing Reps 448 416 Sales Productivity(1)(2) $2.2k $2.3k Took headcount lower in the second quarter as we transform our system environment and our sales force to move up market. Productivity continues to improve. Total sales have been flat since Q4’ 11 even on 60 less selling headcount. (1) Quarterly Sales Productivity is defined as Gross New Bookings divided by Average Quota Bearing Reps (2) The $2.6k productivity referenced on slide 38 of June 4th 2012 Investor Day presentation includes Wholesale. The comparable result for Q2 2012 is $3.0k |
|
|
4 1.0% 1.2% 1.4% 1.6% 1.8% 2.0% Q1 '10 Q2 '10 Q3 '10 Q4 '10 Q1 '11 Q2 '11 Q3 '11 Q4 '11 Q1 '12 Q2'12 We continue to drive Business churn lower Integration activities, better products and account management Down to 1.4% in Q2’ 12 from ~2% pre-acquisition Churn Improving Business Services Retail Churn(1) 1.0% 1.5% 2.0% 2.5% 3.0% 3.5% 4.0% 4.5% Q1 '09 Q2 '09 Q3 '09 Q4 '09 Q1 '10 Q2 '10 Q3 '10 Q4 '10 Q1 '11 Q2 '11 Q3 '11 Q4 '11 Q1 '12 Q2 '12 Consumer Churn Consumer churn continues to fall We expect further improvement Driven by increasingly tenured mix of customers 39% of Narrowband customers have been with us for 10+ years and churn at 1.1% (1) Pro Forma monthly gross revenue loss excluding customer write-downs. Pre-acquisition data is pro forma and data is sourced from multiple company systems |

|
|
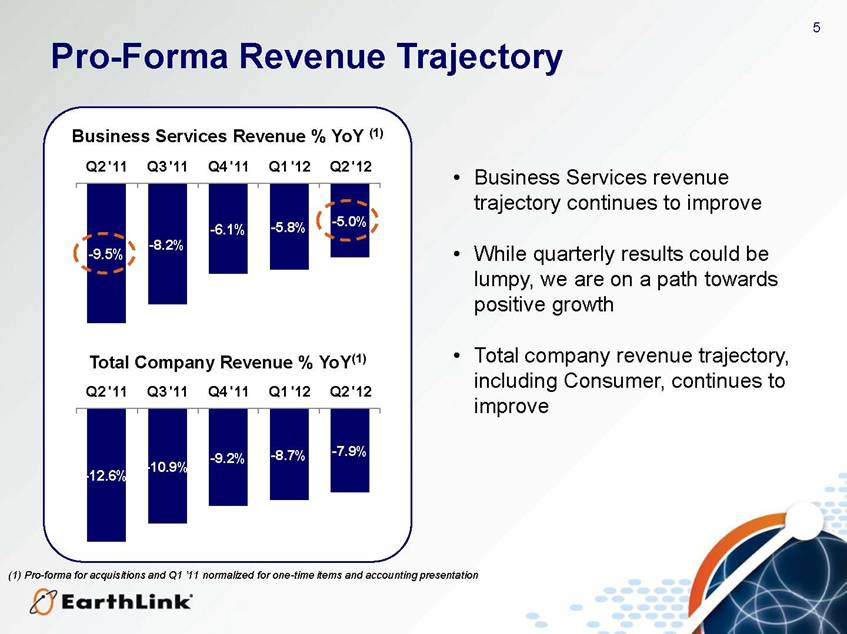
5 Business Services Revenue % YoY (1) Total Company Revenue % YoY(1) Business Services revenue trajectory continues to improve While quarterly results could be lumpy, we are on a path towards positive growth Total company revenue trajectory, including Consumer, continues to improve Pro-Forma Revenue Trajectory (1) Pro-forma for acquisitions and Q1 ’11 normalized for one-time items and accounting presentation -9.5% -8.2% -6.1% -5.8% -5.0% Q2 '11 Q3 '11 Q4 '11 Q1 '12 Q2 '12 -12.6% -10.9% -9.2% -8.7% -7.9% Q2 '11 Q3 '11 Q4 '11 Q1 '12 Q2 '12 |
|
|
6 Second Half 2012 Revenue Trajectory We increased sales headcount in July New sales reps take 6 months to become fully productive Additional headcount ramp over the next few quarters may pressure total blended productivity per rep However, we expect productivity amongst tenured reps to continue to improve We are focused on growing our Business segment We may reach the quarterly sequential inflection point in Q3 2012 - it will be close Q4 revenues are seasonally low If we do not reach flat in Q3 2012 we expect it to happen in early 2013 We are encouraged and getting closer Business segment YoY declines are now at 5% Were previously in double digits |

|
|
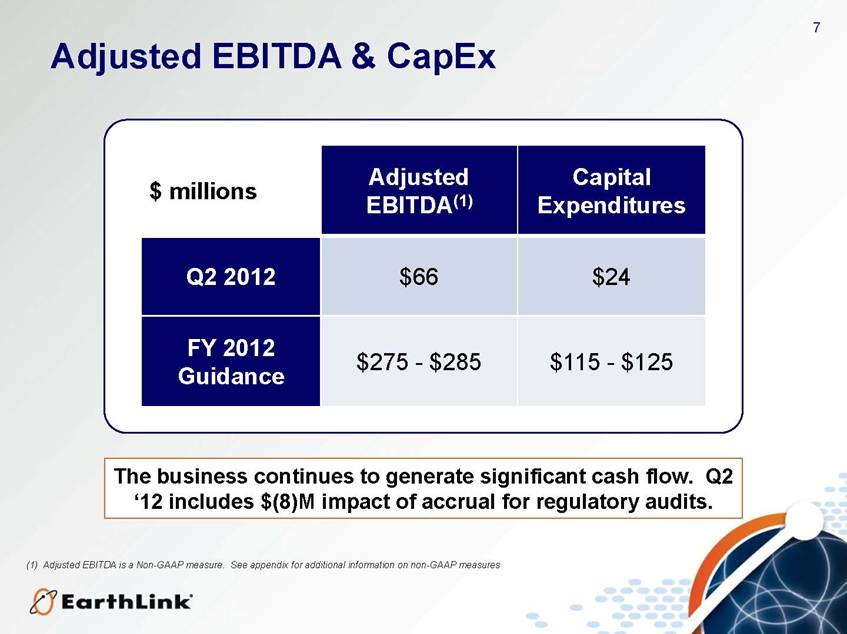
7 Adjusted EBITDA & CapEx $ millions Adjusted EBITDA(1) Capital Expenditures Q2 2012 $66 $24 FY 2012 Guidance $275 - $285 $115 - $125 The business continues to generate significant cash flow. Q2 ’12 includes $(8)M impact of accrual for regulatory audits. (1) Adjusted EBITDA is a Non-GAAP measure. See appendix for additional information on non-GAAP measures |
|
|
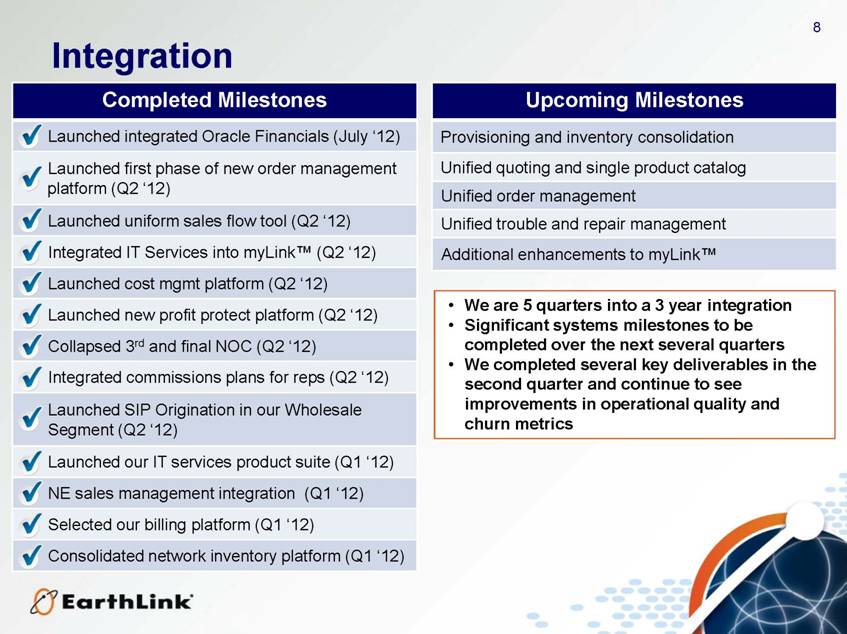
8 Integration Completed Milestones Launched integrated Oracle Financials (July ’12) Launched first phase of new order management platform (Q2 ’12) Launched uniform sales flow tool (Q2 ’12) Integrated IT Services into myLink TM (Q2 ’12) Launched cost mgmt platform (Q2 ’12) Launched new profit protect platform (Q2 ’12) Collapsed 3rd and final NOC (Q2 ’12) Integrated commissions plans for reps (Q2 ’12) Launched SIP Origination in our Wholesale Segment (Q2 ’12) Launched our IT services product suite (Q1 ’12) NE sales management integration (Q2 ’12) Selected our billing platform (Q2 ’12) Consolidated network inventory platform (Q2 ’12) Upcoming Milestones Provisioning and inventory consolidation Unified quoting and single product catalog Unified order management Unified trouble and repair management Additional enhancements to myLink TM We are 5 quarters into a 3 year integration Significant systems milestones to be completed over the next several quarters We completed several key deliverables in the second quarter and continue to see improvements in operational quality and churn metrics |
|
|
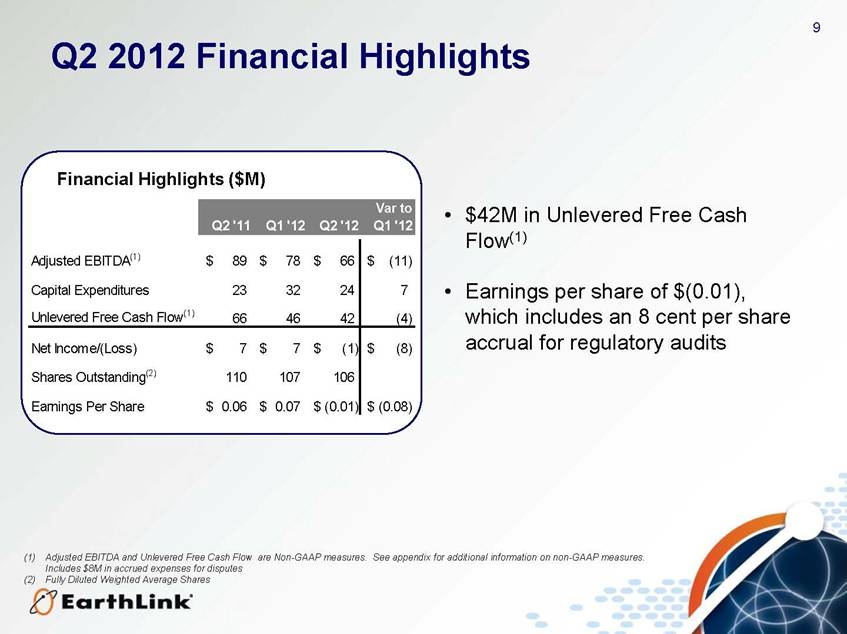
9 Q2 2012 Financial Highlights $42M in Unlevered Free Cash Flow(1) Earnings per share of $(0.01), which includes an 8 cent per share accrual for regulatory audits (1) Adjusted EBITDA and Unlevered Free Cash Flow are Non-GAAP measures. See appendix for additional information on non-GAAP measures. Includes $8M in accrued expenses for disputes (2) Fully Diluted Weighted Average Shares Financial Highlights ($M) Q2 '11 Q1 '12 Q2 '12 Var to Q1 '12 Adjusted EBITDA(1) 89 $ 78 $ 66 $ (11) $ Capital Expenditures 23 32 24 7 Unlevered Free Cash Flow(1) 66 46 42 (4) Net Income/(Loss) 7 $ 7 $ (1) $ (8) $ Shares Outstanding(2) 110 107 106 Earnings Per Share 0.06 $ 0.07 $ (0.01) $ (0.08) $ |
|
|
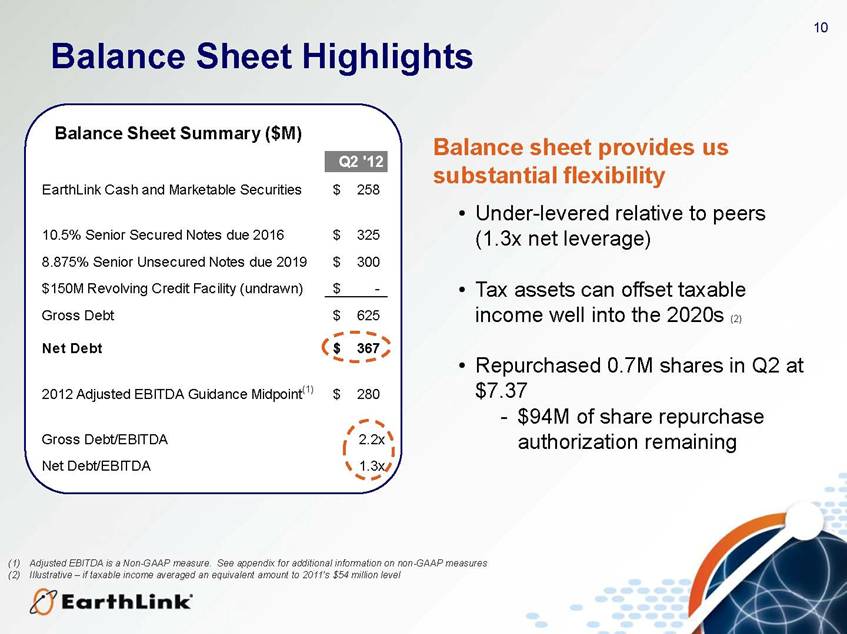
10 Balance Sheet Highlights Balance Sheet Summary ($M) Balance sheet provides us substantial flexibility Under-levered relative to peers (1.3x net leverage) Tax assets can offset taxable income well into the 2020s (2) Repurchased 0.7M shares in Q2 at $7.37 - $94M of share repurchase authorization remaining (1) Adjusted EBITDA is a Non-GAAP measure. See appendix for additional information on non-GAAP measures (2) Illustrative - if taxable income averaged an equivalent amount to 2011’s $54 million level Q2 '12 EarthLink Cash and Marketable Securities 258 $ 10.5% Senior Secured Notes due 2016 325 $ 8.875% Senior Unsecured Notes due 2019 300 $ $150M Revolving Credit Facility (undrawn) - $ Gross Debt 625 $ Net Debt 367 $ 2012 Adjusted EBITDA Guidance Midpoint(1) 280 $ Gross Debt/EBITDA 2.2x Net Debt/EBITDA 1.3x |
|
|
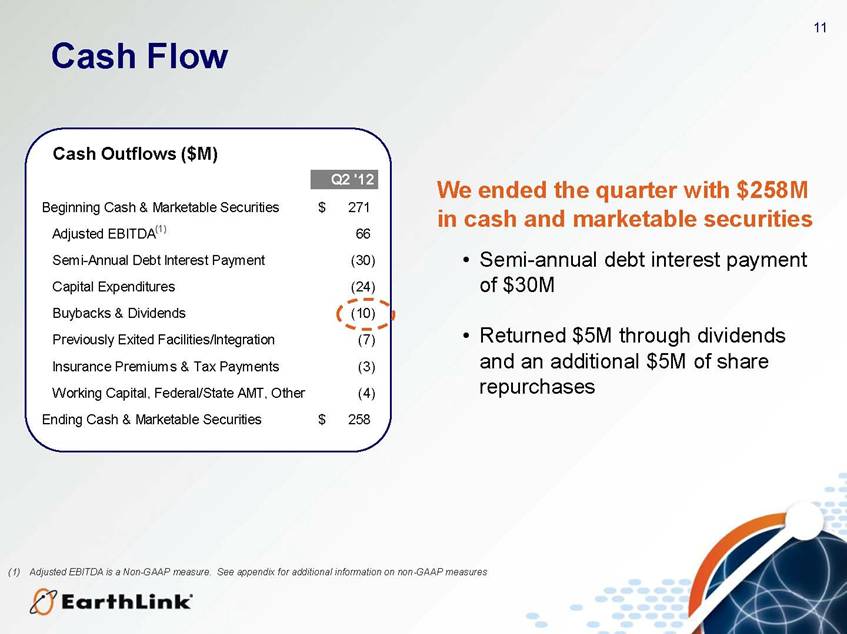
11 Cash Flow We ended the quarter with $258M in cash and marketable securities Semi-annual debt interest payment of $30M Returned $5M through dividends and an additional $5M of share repurchases Cash Outflows ($M) (1) Adjusted EBITDA is a Non-GAAP measure. See appendix for additional information on non-GAAP measures Q2 '12 Beginning Cash & Marketable Securities 271 $ Adjusted EBITDA(1) 66 Semi-Annual Debt Interest Payment (30) Capital Expenditures (24) Buybacks & Dividends (10) Previously Exited Facilities/Integration (7) Insurance Premiums & Tax Payments (3) Working Capital, Federal/State AMT, Other (4) Ending Cash & Marketable Securities 258 $ |
|
|
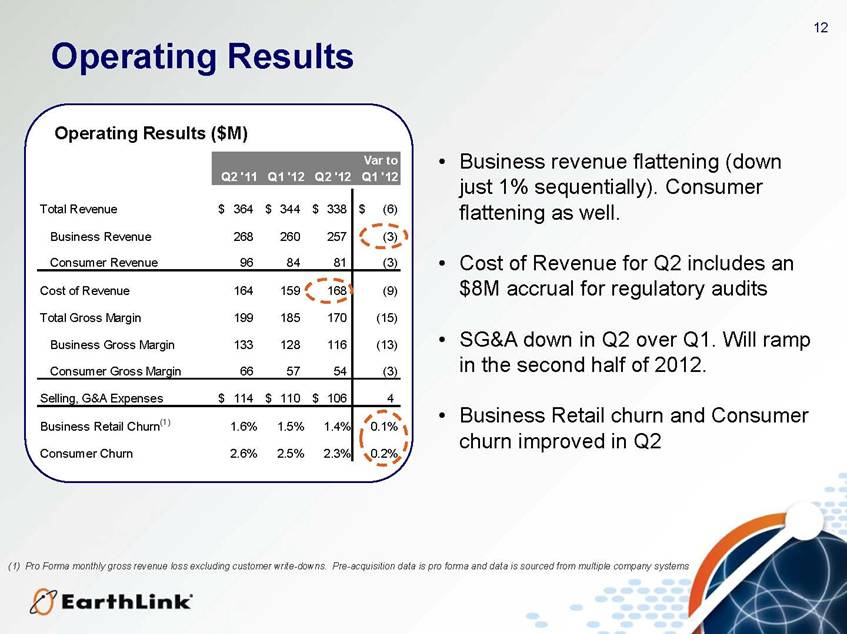
12 Operating Results Business revenue flattening (down just 1% sequentially). Consumer flattening as well. Cost of Revenue for Q2 includes an $8M accrual for regulatory audits SG&A down in Q2 over Q1. Will ramp in the second half of 2012. Business Retail churn and Consumer churn improved in Q2 Operating Results ($M) Q2 '11 Q1 '12 Q2 '12 Var to Q1 '12 Total Revenue 364 $ 344 $ 338 $ (6) $ Business Revenue 268 260 257 (3) Consumer Revenue 96 84 81 (3) Cost of Revenue 164 159 168 (9) Total Gross Margin 199 185 170 (15) Business Gross Margin 133 128 116 (13) Consumer Gross Margin 66 57 54 (3) Selling, G&A Expenses 114 $ 110 $ 106 $ 4 Business Retail Churn(1) 1.6% 1.5% 1.4% 0.1% Consumer Churn 2.6% 2.5% 2.3% 0.2% (1) Pro Forma monthly gross revenue loss excluding customer write-downs. Pre-acquisition data is pro forma and data is sourced from multiple company systems |
|
|
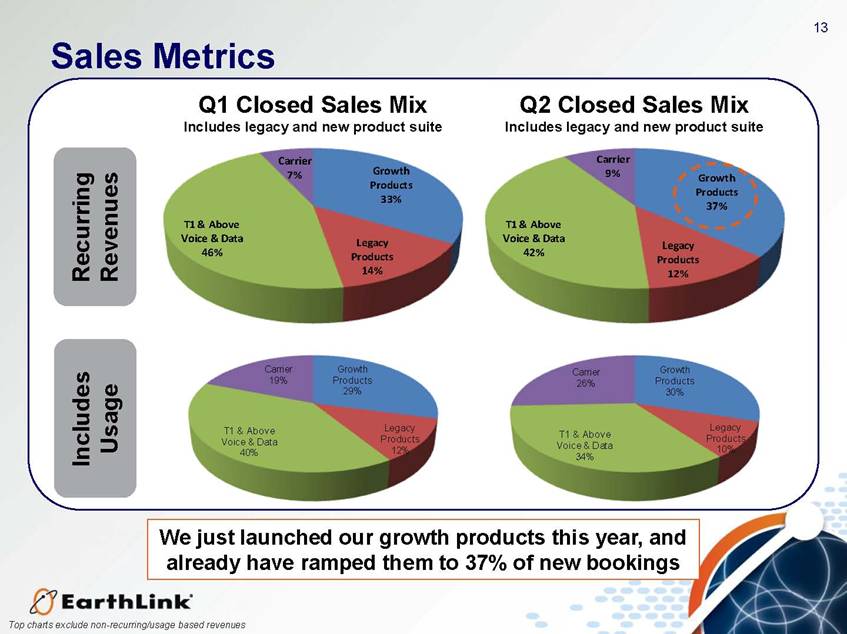
13 Sales Metrics Q1 Closed Sales Mix Includes legacy and new product suite Includes Usage Recurring Revenues Growth Products 29% Legacy Products 12% T1 & Above Voice & Data 40% Carrier 19% Growth Products 30% Legacy Products 10% T1 & Above Voice & Data 34% Carrier 26% Q2 Closed Sales Mix Includes legacy and new product suite We just launched our growth products this year, and already have ramped them to 37% of new bookings Growth Products 37% Legacy Products 12% T1 & Above Voice & Data 42% Carrier 9% Growth Products 33% Legacy Products 14% T1 & Above Voice & Data 46% Carrier 7% Top charts exclude non-recurring/usage based revenues |
|
|
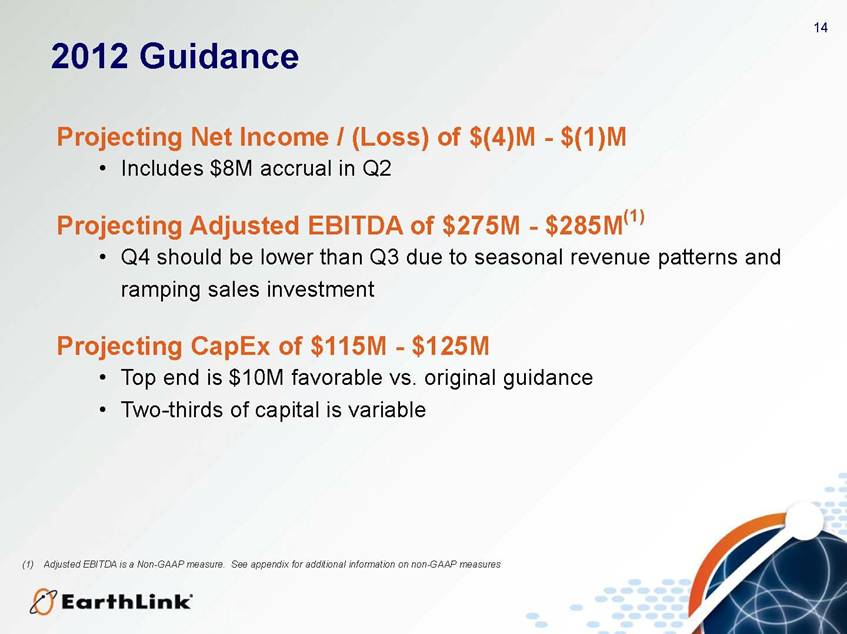
14 2012 Guidance Projecting Net Income / (Loss) of $(4)M - $(1)M Includes $8M accrual in Q2 Projecting Adjusted EBITDA of $275M - $285M(1) Q4 should be lower than Q3 due to seasonal revenue patterns and ramping sales investment Projecting CapEx of $115M - $125M Top end is $10M favorable vs. original guidance Two-thirds of capital is variable (1) Adjusted EBITDA is a Non-GAAP measure. See appendix for additional information on non-GAAP measures |
|
|
15 Summary We are nearly halfway through a 3 year transformation Tackling a simultaneous large scale integration and complete overhaul of product and distribution motion Investing EBITDA in advance of new recurring revenues to scale our sales motion Will continue to actively evaluate strategic opportunities Positioned to grow with the assets we have Will remain opportunistic and disciplined Lots of work left to do but we are making great progress |

|
|
16 Appendix |
|
|
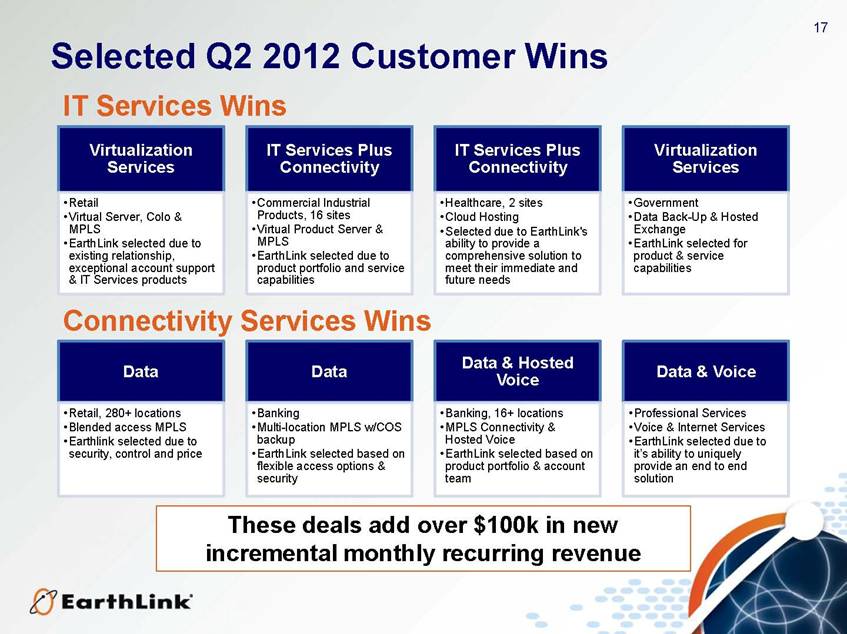
17 Selected Q2 2012 Customer Wins Virtualization Services Retail Virtual Server, Colo & MPLS EarthLink selected due to existing relationship, exceptional account support & IT Services products IT Services Plus Connectivity Commercial Industrial Products, 16 sites Virtual Product Server & MPLS EarthLink selected due to product portfolio and service capabilities IT Services Plus Connectivity Healthcare, 2 sites Cloud Hosting Selected due to EarthLink's ability to provide a comprehensive solution to meet their immediate and future needs Virtualization Services Government Data Back-Up & Hosted Exchange EarthLink selected for product & service capabilities Data Retail, 280+ locations Blended access MPLS Earthlink selected due to security, control and price Data Banking Multi-location MPLS w/COS backup EarthLink selected based on flexible access options & security Data & Hosted Voice Banking, 16+ locations MPLS Connectivity & Hosted Voice EarthLink selected based on product portfolio & account team Data & Voice Professional Services Voice & Internet Services EarthLink selected due to provide an end to end solution IT Services Wins Connectivity Services Wins These deals add over $100k in new incremental monthly recurring revenue |
|
|
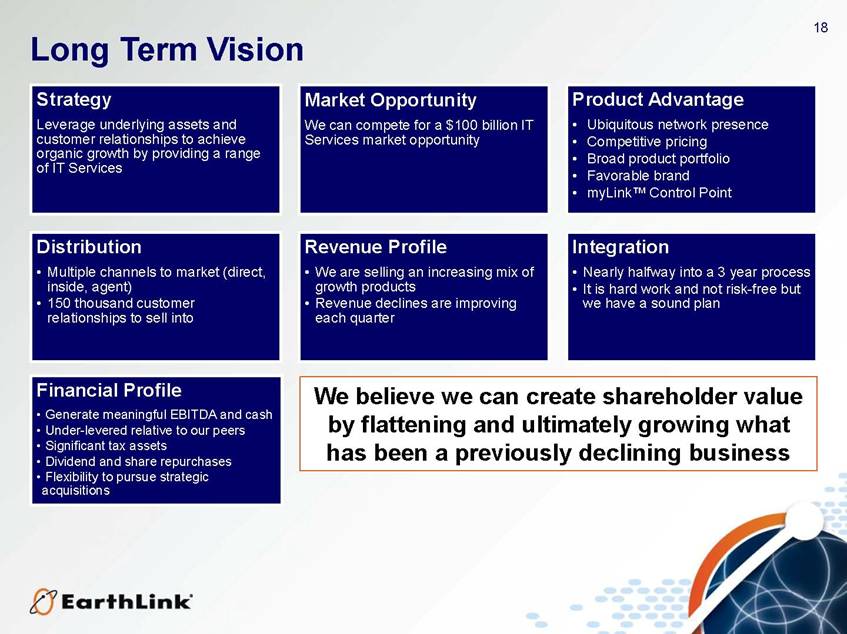
18 Long Term Vision Strategy Leverage underlying assets and customer relationships to achieve organic growth by providing a range of IT Services Market Opportunity We can compete for a $100 billion IT Services market opportunity Product Advantage Ubiquitous network presence Competitive pricing Broad product portfolio Favorable brand myLinkTM Control Point Distribution Multiple channels to market (direct, inside, agent) 150 thousand customer relationships to sell into Revenue Profile We are selling an increasing mix of growth products Revenue declines are improving each quarter Integration Nearly halfway into a 3 year process It is hard work and not risk-free but we have a sound plan Financial Profile Generate meaningful EBITDA and cash Under-levered relative to our peers Significant tax assets Dividend and share repurchases Flexibility to pursue strategic acquisitions We believe we can create shareholder value by flattening and ultimately growing what has been a previously declining business |
|
|
19 8.1% 6.9% 6.6% 18.3% 17.5% 17.3% 73.6% 75.6% 76.1% Q2 '11 Q1 '12 Q2 '12 Business Services Consumer BBD & VAS Consumer Dial $338M $344M $364M We continue to transform the revenue profile of our company Business Services, Broadband and Value Added Services comprise over 93% of our revenues Dial represents less than 7% of our total revenue Revenue Mix Over Time |

|
|
20 Non GAAP Information EarthLink Non-GAAP Measures Adjusted EBITDA is defined by EarthLink as net income (loss) before interest expense and other, net, income taxes, depreciation and amortization, stock-based compensation expense, impairment of goodwill and intangible assets, and restructuring, acquisition and integration-related costs. Unlevered Free Cash Flow is defined by EarthLink as net income (loss) before interest expense and other, net, income taxes, depreciation and amortization, stock-based compensation expense, impairment of goodwill and intangible assets, and restructuring, acquisition and integrationrelated costs, less cash used for purchases of property and equipment. Adjusted EBITDA and Unlevered Free Cash Flow are non-GAAP measures and are not determined in accordance with U.S. generally accepted accounting principles. These non-GAAP financial measures are commonly used in the industry and are presented because management believes they provide relevant and useful information to investors. Management uses these non-GAAP financial measures to evaluate the performance of its business, for budget planning purposes and as factors in its employee compensation programs. Management believes that excluding the effects of certain non-cash and non-operating items enables investors to better understand and analyze the current period’s results and provides a better measure of comparability. There are limitations to using these non-GAAP financial measures. Adjusted EBITDA and Unlevered Free Cash Flow are not indicative of cash provided or used by operating activities and may differ from comparable information provided by other companies. Adjusted EBITDA and Unlevered Free Cash Flow should not be considered in isolation, as an alternative to, or more meaningful than measures of financial performance determined in accordance with U.S. generally accepted accounting principles. |

|
|
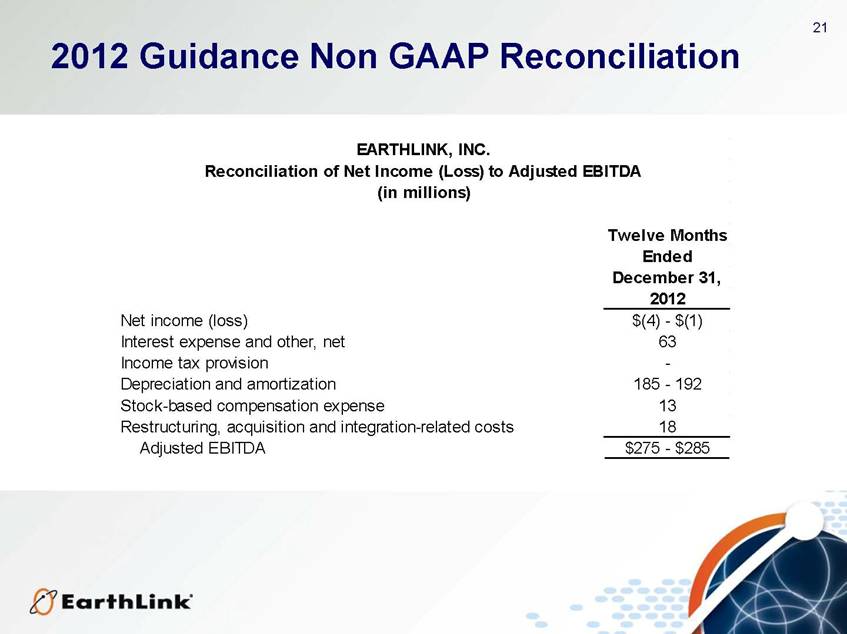
21 2012 Guidance Non GAAP Reconciliation Twelve Months Ended December 31, 2012 Net income (loss) $(4) - $(1) Interest expense and other, net 63 Income tax provision - Depreciation and amortization 185 - 192 Stock-based compensation expense 13 Restructuring, acquisition and integration-related costs 18 Adjusted EBITDA $275 - $285 EARTHLINK, INC. Reconciliation of Net Income (Loss) to Adjusted EBITDA (in millions) |
|
|
22 Historical Non GAAP Reconciliations Three Months Three Months Three Months Ended Ended Ended June 30, March 31, June 30, 2011 2012 2012 Net income (loss) 6,548 $ 7,263 $ (1,106) $ Interest expense and other, net 19,076 15,758 15,709 Income tax provision (benefit) 3,644 3,174 (893) Depreciation and amortization 45,093 45,254 45,980 Stock-based compensation expense 3,514 2,672 2,868 Restructuring, acquisition and integration-related costs 11,046 3,521 3,836 Adjusted EBITDA 88,921 $ 77,642 $ 66,394 $ EARTHLINK, INC. Reconciliation of Net Income (Loss) to Adjusted EBITDA (in thousands) |

|
|
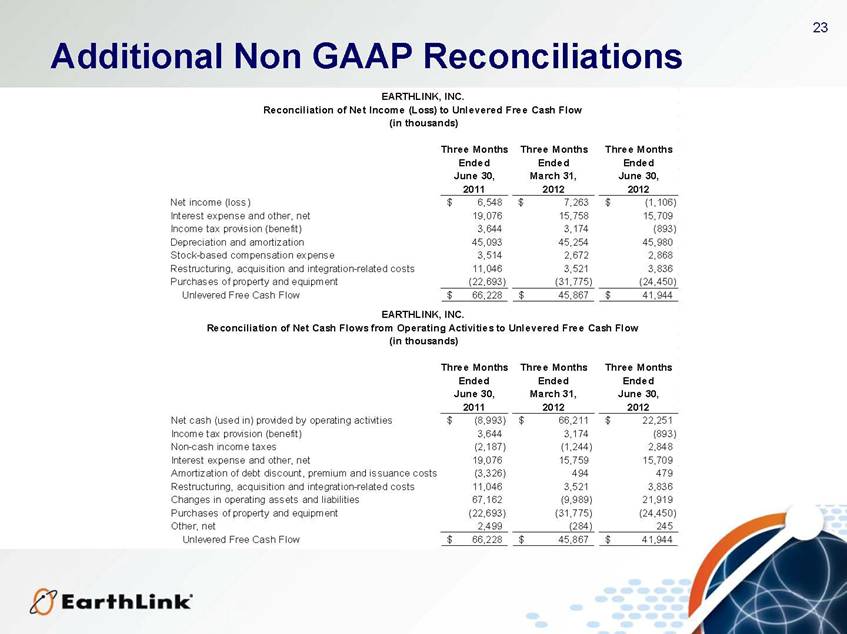
23 Additional Non GAAP Reconciliations Three Months Three Months Three Months Ended Ended Ended June 30, March 31, June 30, 2011 2012 2012 Net income (loss) 6,548 $ 7,263 $ (1,106) $ Interest expense and other, net 19,076 15,758 15,709 Income tax provision (benefit) 3,644 3,174 (893) Depreciation and amortization 45,093 45,254 45,980 Stock-based compensation expense 3,514 2,672 2,868 Restructuring, acquisition and integration-related costs 11,046 3,521 3,836 Purchases of property and equipment (22,693) (31,775) (24,450) Unlevered Free Cash Flow 66,228 $ 45,867 $ 41,944 $ EARTHLINK, INC. Reconciliation of Net Income (Loss) to Unlevered Free Cash Flow (in thousands) Three Months Three Months Three Months Ended Ended Ended June 30, March 31, June 30, 2011 2012 2012 Net cash (used in) provided by operating activities (8,993) $ 66,211 $ 22,251 $ Income tax provision (benefit) 3,644 3,174 (893) Non-cash income taxes (2,187) (1,244) 2,848 Interest expense and other, net 19,076 15,759 15,709 Amortization of debt discount, premium and issuance costs (3,326) 494 479 Restructuring, acquisition and integration-related costs 11,046 3,521 3,836 Changes in operating assets and liabilities 67,162 (9,989) 21,919 Purchases of property and equipment (22,693) (31,775) (24,450) Other, net 2,499 (284) 245 Unlevered Free Cash Flow 66,228 $ 45,867 $ 41,944 $ EARTHLINK, INC. Reconciliation of Net Cash Flows from Operating Activities to Unlevered Free Cash Flow (in thousands) |
|
|
24 Cautionary Information Regarding Forward Looking Statements This presentation includes “forward-looking” statements (rather than historical facts) that are subject to risks and uncertainties that could cause actual results to differ materially from those described. Although we believe that the expectations expressed in these forward-looking statements are reasonable, we cannot promise that our expectations will turn out to be correct. Our actual results could be materially different from and worse than our expectations. We disclaim any obligation to update any forward-looking statements contained herein, except as may be required pursuant to applicable law. With respect to forward-looking statements in this press release, the company seeks the protections afforded by the Private Securities Litigation Reform Act of 1995. These risks include: uncertainties (1) that we may not be able to execute our strategy to grow our business services revenue, especially revenue from advanced products, in an expeditious manner, which could adversely impact our results of operations and cash flows; (2) that we may be unsuccessful or experience delays in integrating acquisitions into our business while we develop our Business Services advanced product portfolio, which could result in operating difficulties, losses and other adverse consequences; (3) that we may be unable to successfully identify, manage and assimilate future acquisitions, which could adversely affect our results of operations; (4) that if we are unable to adapt to changes in technology and customer demands, we may not remain competitive, and our revenues and operating results could suffer; (5) that our failure to achieve operating efficiencies will adversely affect our results of operations; (6) that unfavorable general economic conditions could harm our business; (7) that we face significant competition in the communications and managed IT services industry that could reduce our profitability; (8) that decisions by the Federal Communications Commission relieving incumbent carriers of certain regulatory requirements, and possible further deregulation in the future, may restrict our ability to provide services and may increase the costs we incur to provide these services; (9) that if we are unable to interconnect with AT&T, Verizon and other incumbent carriers on acceptable terms, our ability to offer competitively priced local telephone services will be adversely affected; (10) that our operating performance will suffer if we are not offered competitive rates for the access services we need to provide our long distance services; (11) that we may experience reductions in switched access and reciprocal compensation revenue; (12) that failure to obtain and maintain necessary permits and rights-of-way could interfere with our network infrastructure and operations; (13) that we have substantial business relationships with several large telecommunications carriers, and some of our customer agreements may not continue due to financial difficulty, acquisitions, non-renewal or other factors, which could adversely affect our revenue and results of operations; (14) that our commercial and alliance arrangements may not be renewed or may not generate expected benefits, which could adversely affect our results of operations; (15) that our consumer business is dependent on the availability of third-party network service providers; (16) that we face significant competition in the Internet industry that could reduce our profitability; (17) that the continued decline of our consumer access subscribers, combined with the change in mix of our consumer access base from narrowband to broadband, will adversely affect our results of operations; (18) that potential regulation of Internet service providers could adversely affect our operations; (19) that we may be unable to hire and retain sufficient qualified personnel, including Business Services sales personnel, and that the loss of any of our key executive officers could adversely affect us; (20) that privacy concerns relating to our business could damage our reputation and deter current and potential users from using our services; (21) that security breaches could damage our reputation and harm our operating results; (22) that interruption or failure of our network and information systems and other technologies could impair our ability to provide our services, which could damage our reputation and harm our operating results; (23) that our business depends on effective business support systems and processes; (24) that government regulations could adversely affect our business or force us to change our business practices; (25) that our business may suffer if third parties are unable to provide services or terminate their relationships with us; (26) that we may not be able to protect our intellectual property; (27) that we may be accused of infringing upon the intellectual property rights of third parties, which is costly to defend and could limit our ability to use certain technologies in the future; (28) that if we, or other industry participants, are unable to successfully defend against legal actions, we could face substantial liabilities or suffer harm to our financial and operational prospects; (29) that we may be required to recognize additional impairment charges on our goodwill and intangible assets, which would adversely affect our results of operations and financial position; (30) that we may have exposure to greater than anticipated tax liabilities and the use of our net operating losses and certain other tax attributes could be limited in the future; (31) that our indebtedness could adversely affect our financial health and limit our ability to react to changes in our industry; (32) that we may require additional capital to support business growth, and this capital may not be available to us on acceptable terms, or at all; (33) that we may reduce, or cease payment of, quarterly cash dividends; (34) that our stock price may be volatile; and (35) that provisions of our third restated certificate of incorporation, amended and restated bylaws and other elements of our capital structure could limit our share price and delay a change of management. These risks and uncertainties, as well as other risks and uncertainties that could cause our actual results to differ significantly from management’s expectations, are not intended to represent a complete list of all risks and uncertainties inherent in our business, and should be read in conjunction with the more detailed cautionary statements and risk factors included in our Annual Report on Form 10-K for the year ended December 31, 2011. |