Attached files
| file | filename |
|---|---|
| 8-K - FORM 8-K - HERITAGE FINANCIAL CORP /WA/ | d388999d8k.htm |
 Q2 2012 Investor Presentation
Brian L. Vance, President and CEO
Jeffrey J. Deuel, Executive Vice President and COO
Donald J. Hinson, Senior Vice President and CFO
Heritage
Financial
Corporation
Exhibit 99.1 |
 Forward Looking Statement
2
This presentation contains forward-looking statements that are subject to
risks and uncertainties, including, but not limited to: The credit and
concentration risks of lending activities Changes in general economic
conditions, either nationally or in our market areas Competitive market
pricing factors and interest rate risks Market interest rate
volatility Balance sheet (for example, loans) concentrations
Fluctuations in demand for loans and other financial services in our market
areas Changes in legislative or regulatory requirements or the results
of regulatory examinations The ability to recruit and retain key
management and staff Risks associated with our ability to implement our
expansion strategy and merger integration Stability of funding sources
and continued availability of borrowings Adverse changes in the
securities markets The inability of key third-party providers to
perform their obligations to us Changes in accounting policies and
practices and the use of estimates in determining fair value of certain of our
assets, which estimates may prove to be incorrect and result in significant
declines in valuation; and These and other risks as may be detailed from
time to time in our filings with the Securities and Exchange
Commission.
The Company cautions readers not to place undue reliance on any
forward-looking statements. Moreover, you should treat these
statements as speaking only as of the date they are made and based only on information then actually known to the
Company. The Company does not undertake and specifically disclaims any
obligation to revise any forward-looking statements to reflect the
occurrence of anticipated or unanticipated events or circumstances after
the date of such statements. These risks could cause our actual results
for 2012 and beyond to differ materially from those expressed in any forward-looking
statements by, or on behalf of, us, and could negatively affect the
Company’s operating and stock price performance. |
 Overview
•
Company Information
•
Financial Performance
•
Corporate Strategies
3 |
 Company Information
4 |
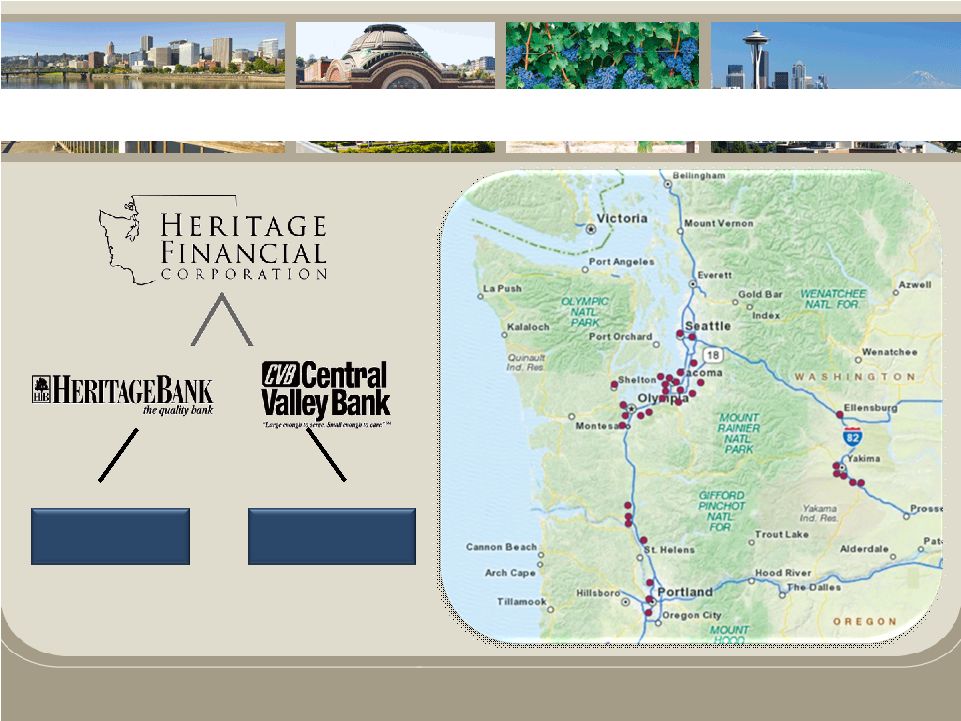 Our Market Area
5
Total assets: $1.17 billion
Branches: 27
Total assets: $164.1 million
Branches: 6
Financial Data as of June 30, 2012 |
 Award Recognition
6
Top Places to Work
Business Examiner –
2012 -
Large Company & Appreciation Awards and
2009
Large Company & Equity Award
Washington Best Workplaces
Puget Sound Business Journal –
Gold Award 2011, Bronze Award 2010 and
Silver Award 2009
The 100 Best Companies to Work For
The Seattle Business Magazine–
2nd Midsized Companies for 2010 |
 Financial Performance
7 |
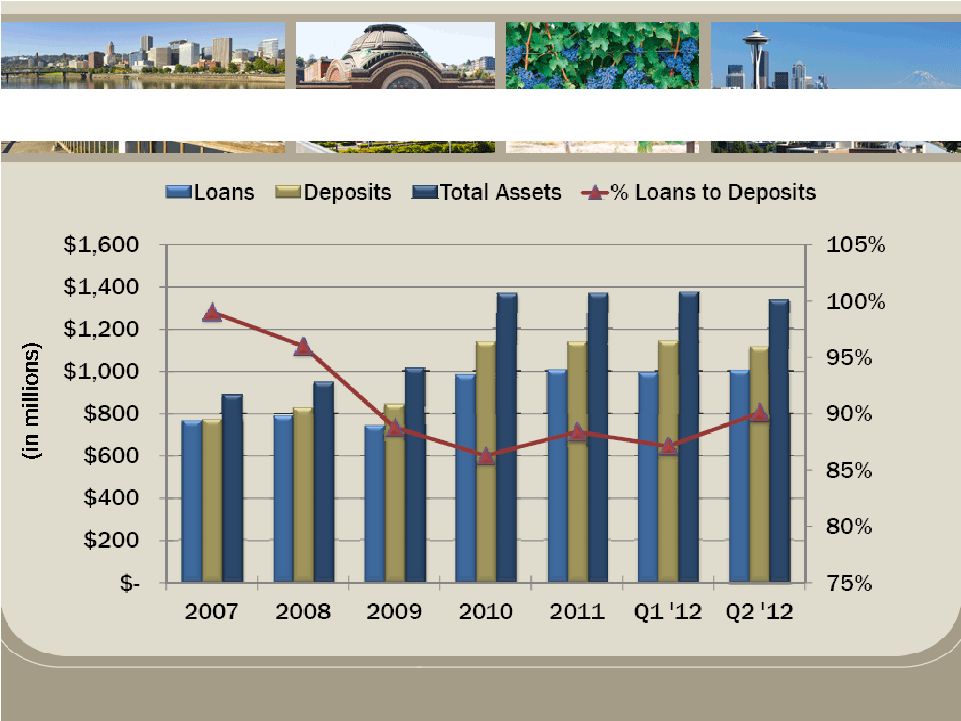 Balance Sheet
8 |
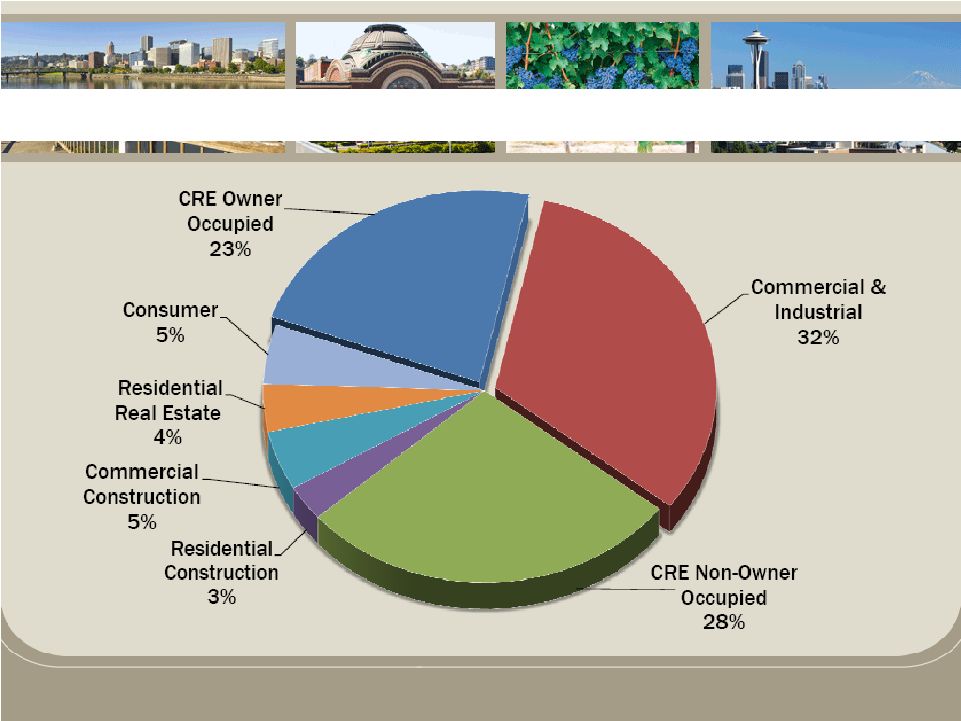 Loan Portfolio
9
Financial data as of June 30, 2012 |
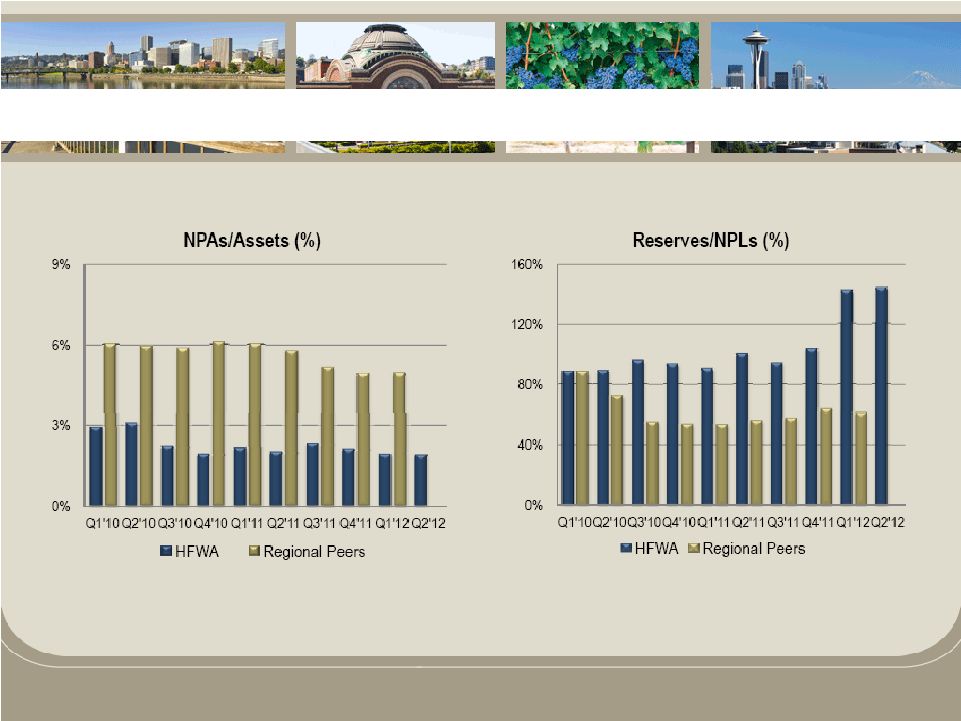 Credit Quality
10
* HFWA ratios relate to originated loan portfolios only. Regional Peer data not
available for Q2’12 Regional
Peer
Group
(12):
Ticker
Symbols
–
BANR,
CACB,
COLB,
FFNW,
HOME,
NRIM,
PCBK,
PRWT,
RVSB,
TSBK,
WBCO,
WCBO
Source: SNL Financial |
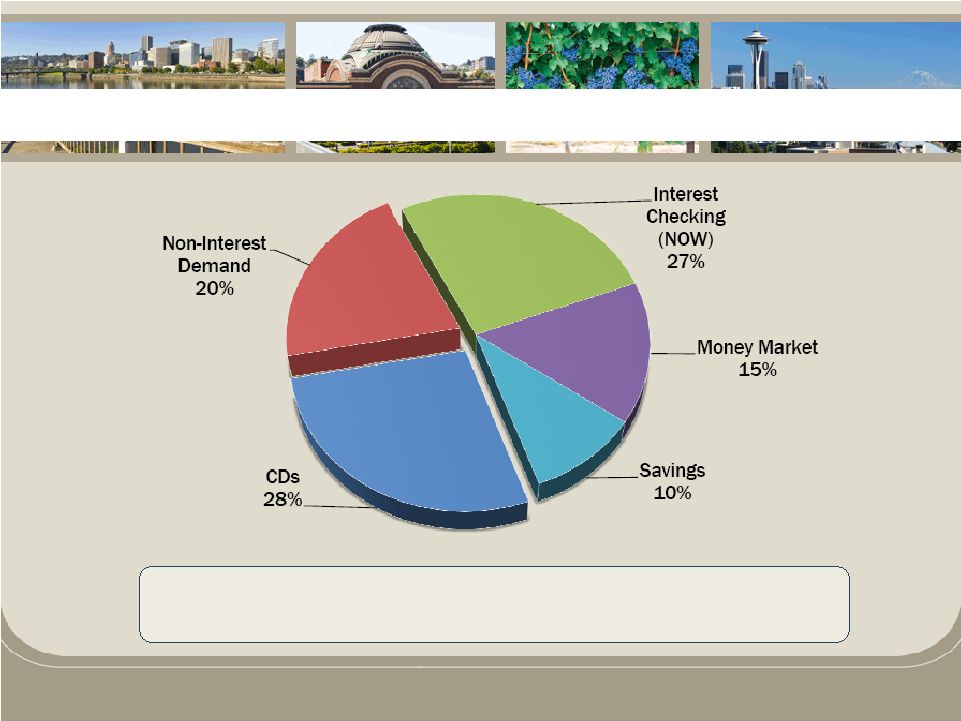 Deposit Base
11
Total
Deposits
$1.1 billion Cost of
Deposits 0.42%
Non-Maturity Deposits / Total Deposits 72.4%
Cost of Interest Bearing Deposits 0.53%
Financial data as of June 30, 2012 |
 Core Deposit Growth
12 |
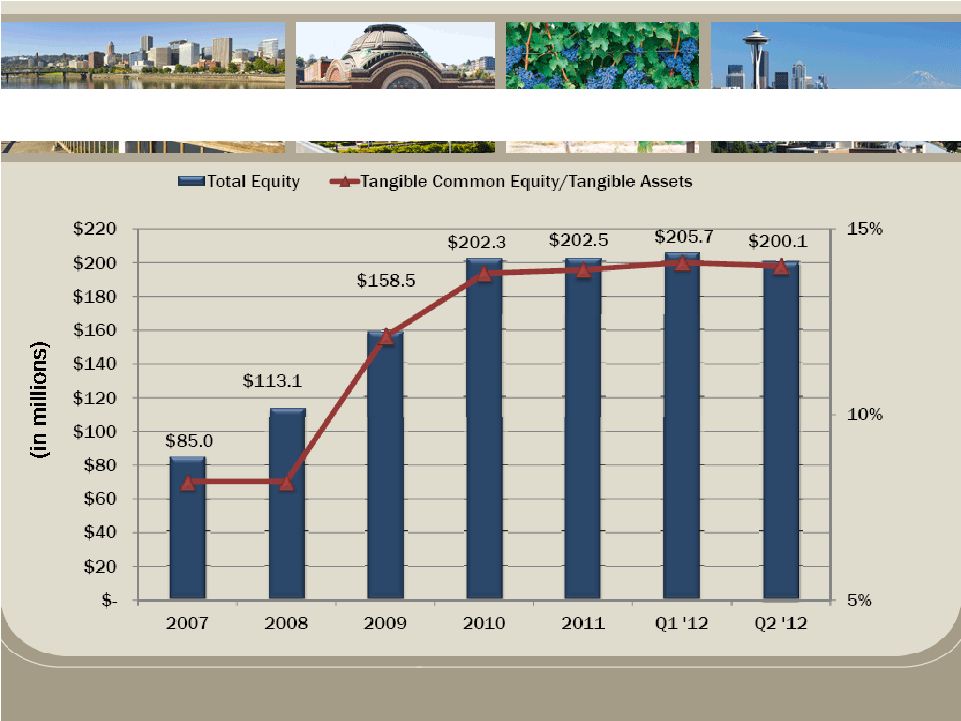 Equity Growth
13 |
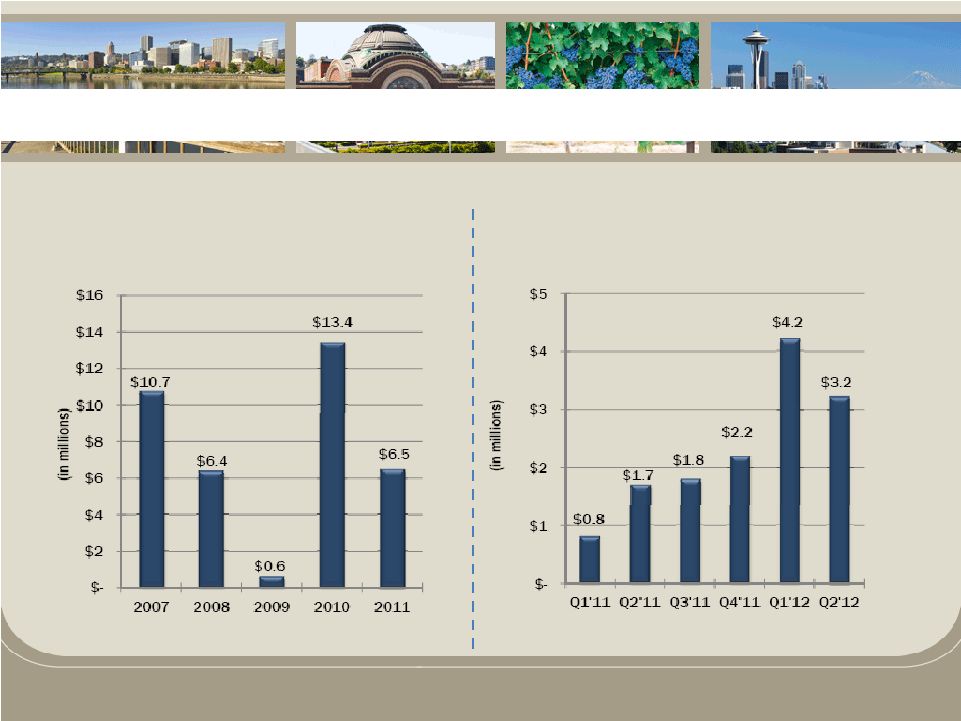 Earnings
Annual Net Income
Quarterly Net Income
14 |
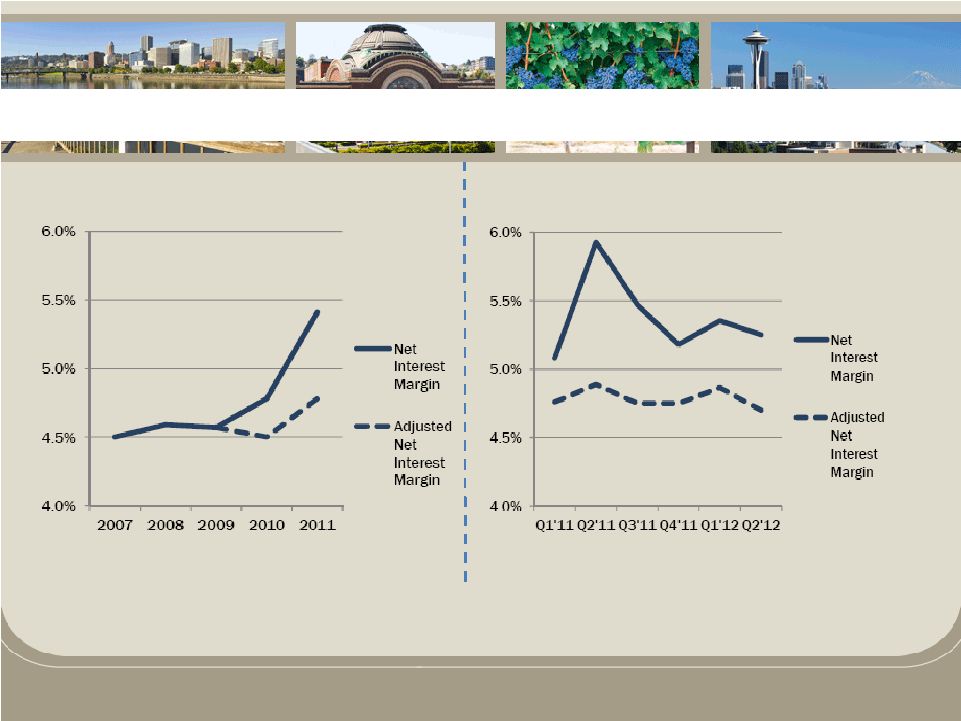 Net Interest Margin
Annual NIM
Quarterly NIM
15
Adjusted
Net
Interest
Margin
removes
the
effects
of
“incremental
accretion
income”
from
net
interest
income
in
the
net
interest
margin
calculation.
“Incremental
accretion
income”
represents
the
amount
of
income
recorded
on
the
acquired
loans
above
the
contractual
stated
interest
rate
of
the
individual
loan
notes.
This
income
stems
from
the
discount
established
at
the
time
these
loan
portfolios
were
acquired
and
modified
as
a
result of quarterly cash flow re-estimations.
|
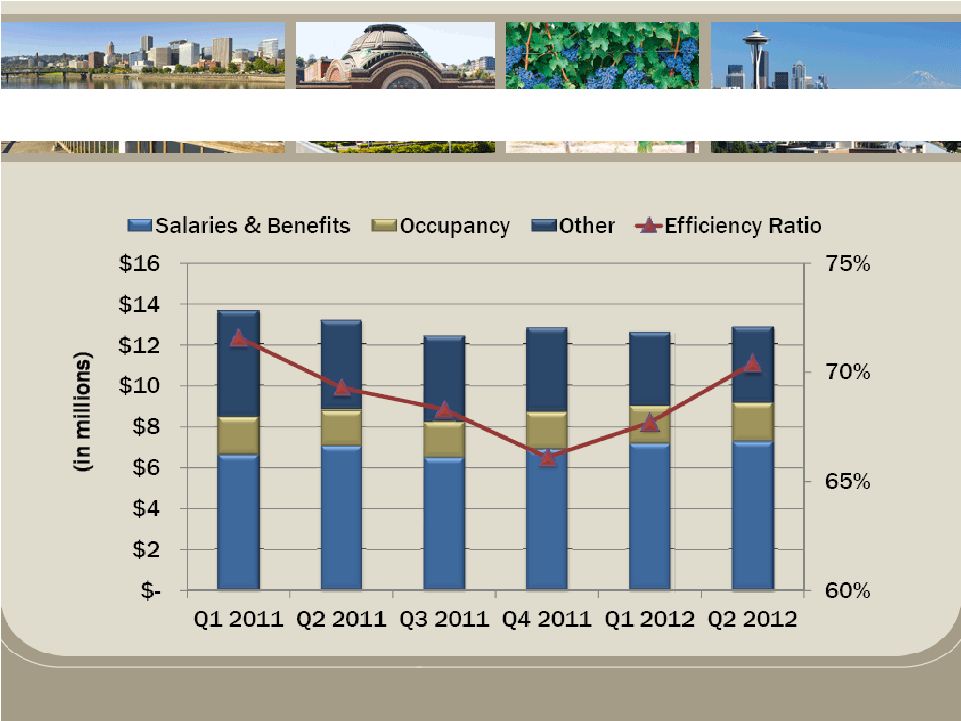 Operating Expenses
16 |
 Corporate Strategies
17 |
 Growth Initiatives
•
Organic Growth
–
Lender recruitment
–
Strategic branching
–
Develop Southwest Washington
–
Wealth Management initiative
•
Targeted Acquisitions
–
Enhance Pacific Northwest footprint
18 |
 Growth Initiatives
•
Lender Recruitment
–
During 2011 and 2012 we hired 9 new Lenders and
a Market Executive
•
4 lenders in King County (Seattle/Bellevue/Kent)
•
2 lenders in Pierce County (Tacoma)
•
1 lender in Thurston County (Olympia)
•
1 lender in Clark County (Vancouver)
•
1 lender in Portland, OR
•
1 Market Executive for Vancouver, WA / OR
–
Continue to recruit Lenders
19 |
 Growth Initiatives
•
Loan Growth
–
Increased net loans $24.8 million, or 2.5%, in 2011
–
Increased originated loans $95.9 million, or 12.9%,
in 2011
–
Originated loan growth was $15.7 million, or 1.9%,
during first 6 months of 2012
20 |
 Growth Initiatives
21
•
Wealth Management
–
Trust services added in Cowlitz Bank transaction
–
Wealth Management leader joined team in 2011
–
Goal to align existing Trust and Brokerage Services with
new Investment Management Services to create integrated
Wealth Management platform
–
Serve the clients on both sides of their balance sheet with
responsive credit products as well as comprehensive asset
management services
–
Relatively low capital requirements, fee income from
organic growth, and growth through acquisitions |
 Leverage Capital
•
FDIC Acquisitions
–
Successfully completed two FDIC acquisitions
–
Continue to consider future FDIC assisted
transactions
–
Expect very few closures in WA/OR in 2012
•
Bank Mergers and Acquisitions
–
Actively seeking M&A opportunities
22 |
 Capital Management Strategies
Cash Dividends
Stock Repurchases
Announced 5% repurchase program in Q3 2011
Since inception, repurchased 590,832 shares (76%
of repurchase program at an average price of $12.83)
23
2011
2012
Q2
Q3
Q4
Q1
Q2
Q3
Quarterly
Dividend
$0.03
$0.05
$0.05
$0.06
$0.08
$0.08
Special
Dividend
-
-
$0.25
-
$0.20
- |
 Capital Return
24
Total
Capital
Returned*
Since
Q1
2011
(%
of
Tg.
Common
Equity
in
Q1
2011)
HFWA has returned more
capital to shareholders
than most peers since
Q1 2011 based on
beginning balance of
tangible common equity
Total amount of capital
returned through cash
dividends and buybacks
since Q1 2011, as a % of
tangible common equity
9.93% vs. median
5.59%
Source: SNL Financial, as of 6/30/2012 unless noted otherwise
*Total capital returned includes all cash dividends and stock buybacks since Q1
2011 **As of 3/31/2012. 2
nd
quarter information not yet available |
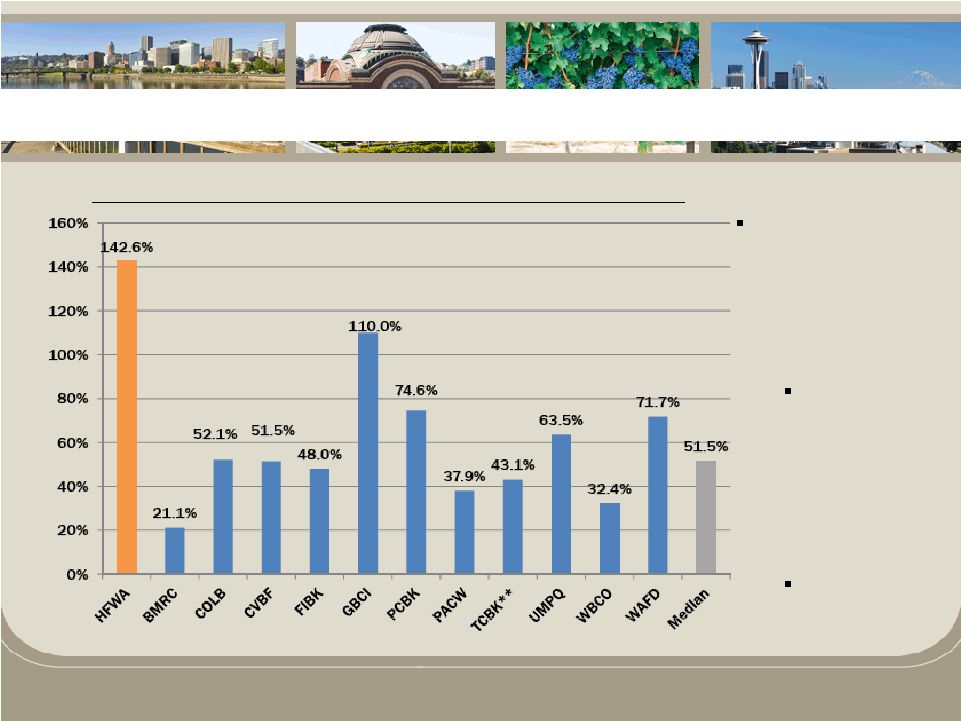 Capital Return
25
HFWA has returned
more capital to
shareholders than
accumulated net
income since Q1
2011
142.6% of net
income has
been returned
to shareholders
through
dividends and
buybacks
51.5% median
Total Capital Returned* / Net Income (Since Q1 2011)
Source: SNL Financial, as of 6/30/2012 unless noted otherwise
*Total capital returned includes all cash dividends and stock buybacks since Q1
2011 **As of 3/31/2012. 2
nd
quarter information not yet available |
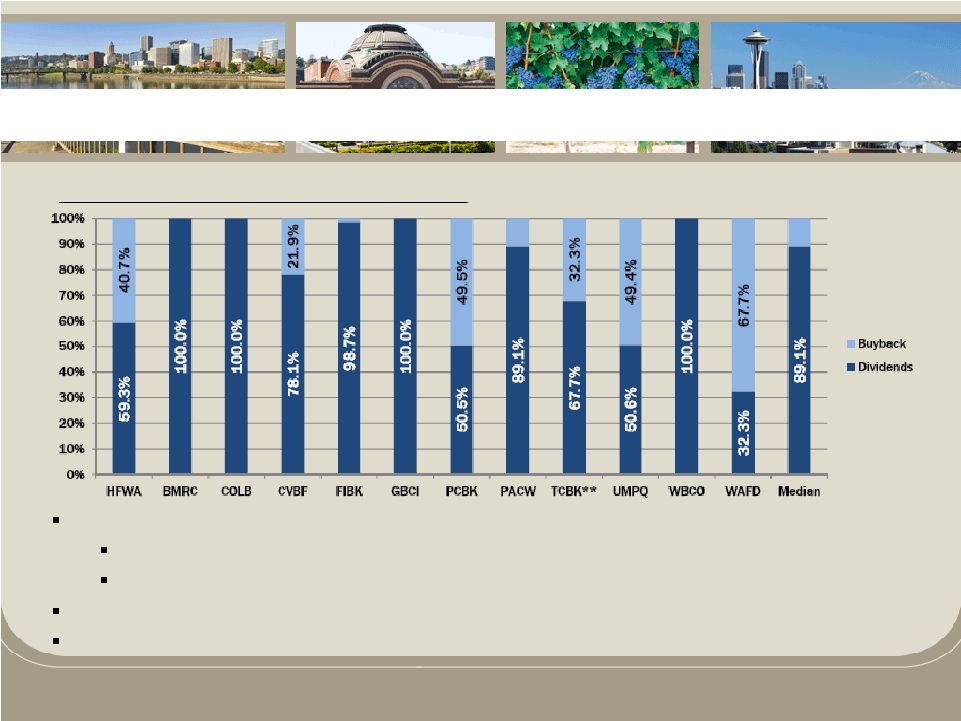 Capital Return
26
HFWA has returned capital through both dividends and stock buybacks
59.3% through dividends and 40.7% through buybacks
vs. peer median 89.1% through dividends and 10.9% through buybacks
More advantageous for shareholders from a tax perspective for stock buybacks
vs. dividends None of the selected companies had a buyback program in
place without a dividend program as well Source: SNL Financial, as of
6/30/2012 unless noted otherwise *Total capital returned includes all
cash dividends and stock buybacks since Q1 2011 **As of 3/31/2012.
2 nd
quarter information not yet available
Mix of Capital Returned* (Since Q1 2011) |
 Conclusion
27 |
 Investment Value
•
Strong financial performance trends
•
Well-positioned to take advantage of the right
opportunities
•
Continuing focus on building long-term
franchise value
•
Disciplined approach to acquisitions
•
Experienced management team supported by
a strong Board of Directors
28 |
 Thank You
Questions?
Questions?
Heritage Financial Corporation
Heritage Financial Corporation |