Attached files
| file | filename |
|---|---|
| 8-K - 8-K - VEECO INSTRUMENTS INC | a12-16958_18k.htm |
| EX-99.1 - EX-99.1 - VEECO INSTRUMENTS INC | a12-16958_1ex99d1.htm |
Exhibit 99.2
|
|
Q2 2012 Financial Results Earnings Conference Call July 26, 2012 |
|
|
Safe Harbor Statement To the extent that this presentation discusses expectations or otherwise makes statements about the future, such statements are forward-looking and are subject to a number of risks and uncertainties that could cause actual results to differ materially from the statements made. These items include the risk factors discussed in the Business Description and Management's Discussion and Analysis sections of Veeco's Annual Report on Form 10-K for the year ended December 31, 2011 and subsequent Quarterly Reports on Form 10-Q and current reports on Form 8-K. Veeco does not undertake any obligation to update any forward-looking statements to reflect future events or circumstances after the date of such statements. In addition, this presentation includes non-GAAP financial measures. For GAAP reconciliation, please refer to the reconciliation section in this presentation as well as Veeco’s financial press releases and 10-K and 10-Q filings available on www.veeco.com. Note: All results presented herein are for Veeco’s “Continuing Operations” which excludes the Metrology business sold to Bruker Corporation on October 7, 2010 and reflects the discontinuation of Veeco’s CIGS Solar Systems Business in the third quarter of 2011. |
|
|
John Peeler, Chairman and CEO Q2 2012 Results Overview |
|
|
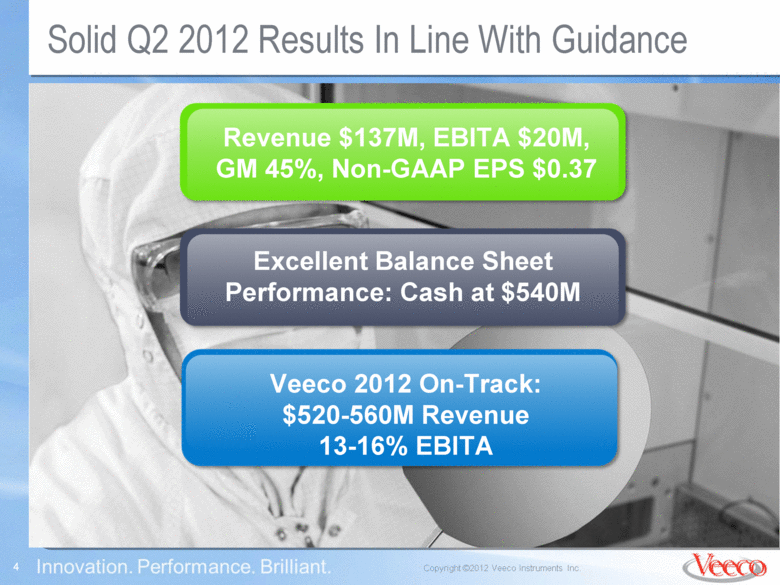
Solid Q2 2012 Results In Line With Guidance Excellent Balance Sheet Performance: Cash at $540M Veeco 2012 On-Track: $520-560M Revenue 13-16% EBITA Revenue $137M, EBITA $20M, GM 45%, Non-GAAP EPS $0.37 |
|
|
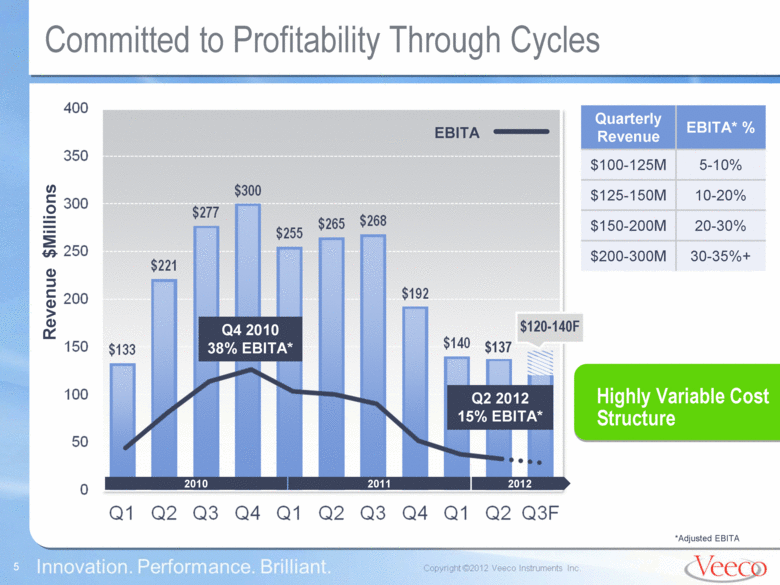
Committed to Profitability Through Cycles Quarterly Revenue EBITA* % $100-125M 5-10% $125-150M 10-20% $150-200M 20-30% $200-300M 30-35%+ Highly Variable Cost Structure Revenue $Millions EBITA $137 Q2 2012 15% EBITA* $120-140F *Adjusted EBITA Q4 2010 38% EBITA* 2010 2011 2012 |
|
|
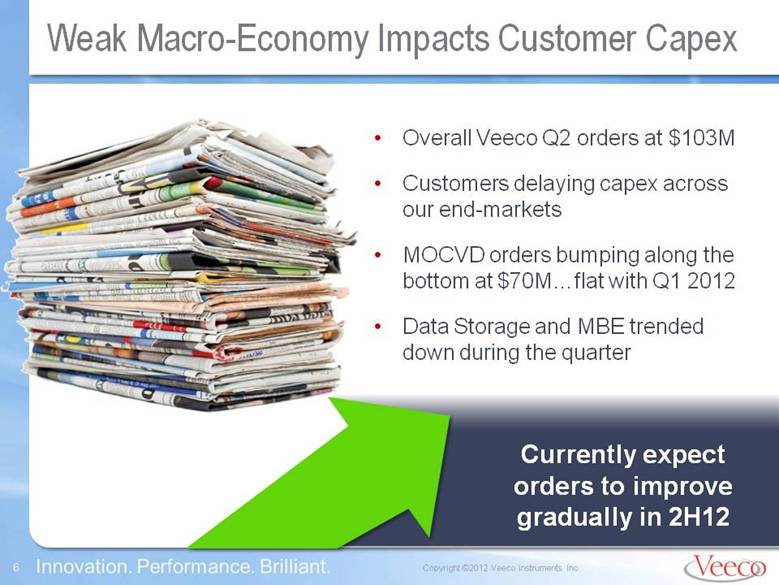
Weak Macro-Economy Impacts Customer Capex Overall Veeco Q2 orders at $103M Customers delaying capex across our end-markets MOCVD orders bumping along the bottom at $70M... flat with Q1 2012 Data Storage and MBE trended down during the quarter Currently expect orders to improve gradually in 2H12 |
|
|
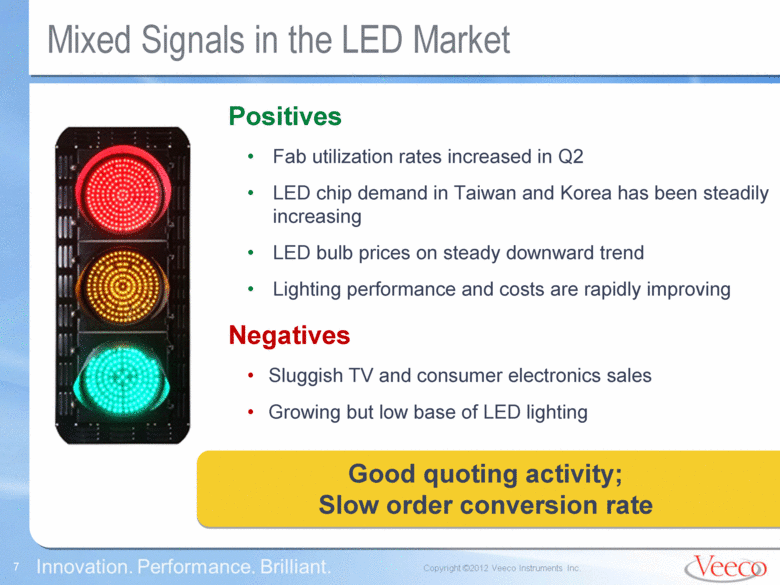
Mixed Signals in the LED Market Good quoting activity; Slow order conversion rate Positives Fab utilization rates increased in Q2 LED chip demand in Taiwan and Korea has been steadily increasing LED bulb prices on steady downward trend Lighting performance and costs are rapidly improving Negatives Sluggish TV and consumer electronics sales Growing but low base of LED lighting |
|
|
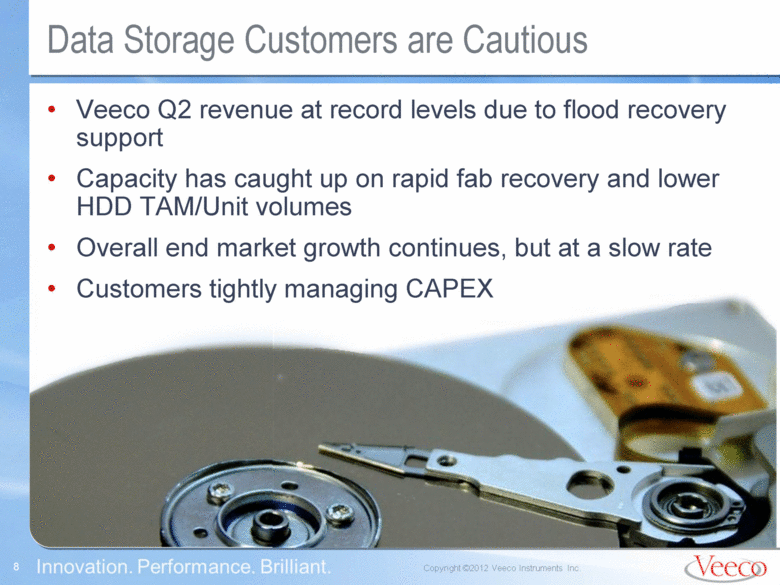
Data Storage Customers are Cautious Veeco revenue at record levels due to flood recovery support Capacity has caught up on rapid fab recovery and lower HDD TAM/Unit volumes Overall end market growth continues, but at a slow rate Customers tightly managing CAPEX |
|
|
David Glass, CFO Q2 12 Results & Guidance |
|
|
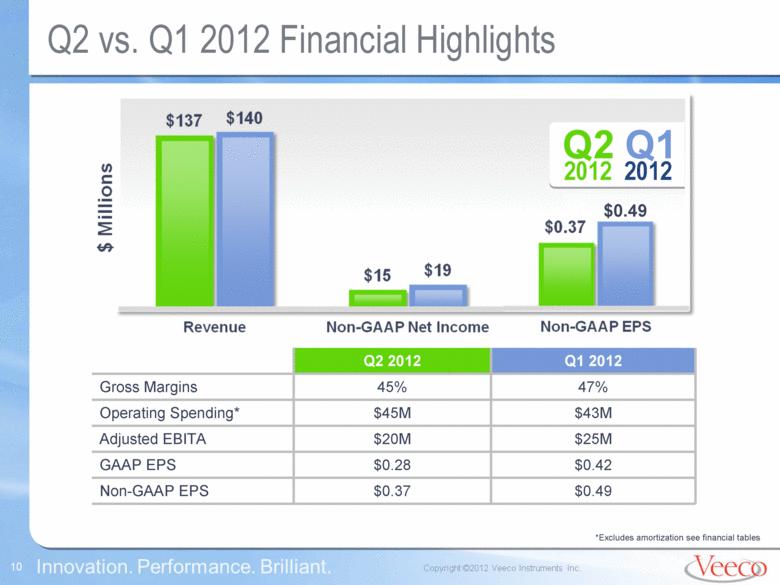
Q2 vs. Q1 2012 Financial Highlights Q2 2012 Q1 2012 $0.49 Q2 2012 Q1 2012 Gross Margins 45% 47% Operating Spending* $45M $43M Adjusted EBITA $20M $25M GAAP EPS $0.28 $0.42 Non-GAAP EPS $0.37 $0.49 *Excludes amortization see financial tables |
|
|
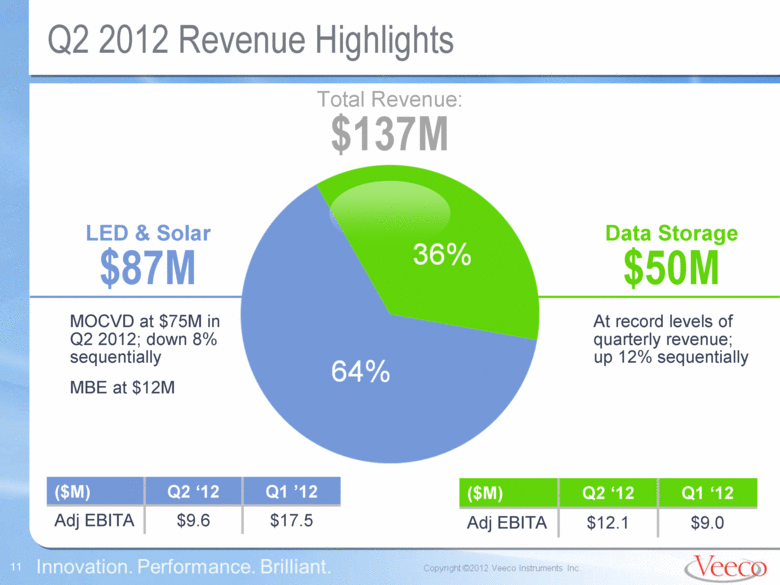
Q2 2012 Revenue Highlights Total Revenue: $137M LED & Solar $87M MOCVD at $75M in Q2 2012; down 8% sequentially MBE at $12M ($M) Q2 ‘12 Q1 ’12 Adj EBITA $9.6 $17.5 ($M) Q2 ‘12 Q1 ‘12 Adj EBITA $12.1 $9.0 Data Storage $50M At record levels of quarterly revenue; up 12% sequentially |
|
|
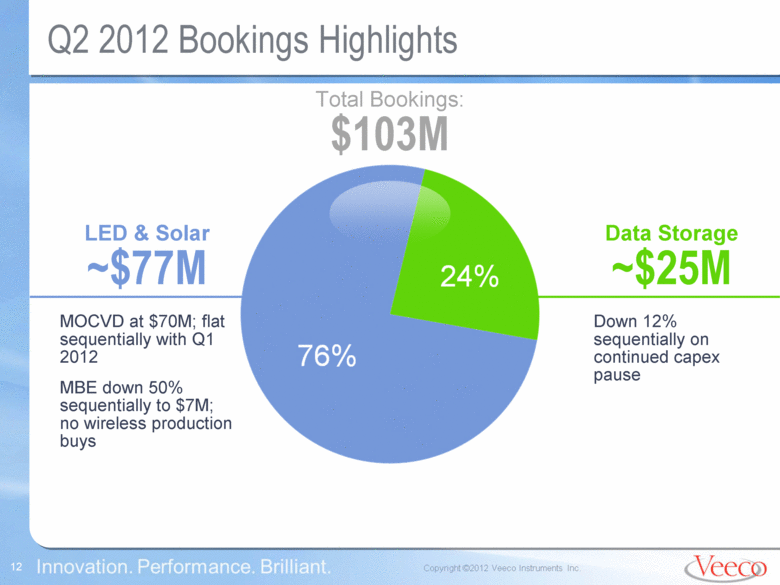
Q2 2012 Bookings Highlights Total Bookings: $103M LED & Solar ~$77M MOCVD at $70M; flat sequentially with Q1 2012 MBE down 50% sequentially to $7M; no wireless production buys Data Storage ~$25M Down 12% sequentially on continued capex pause |
|
|
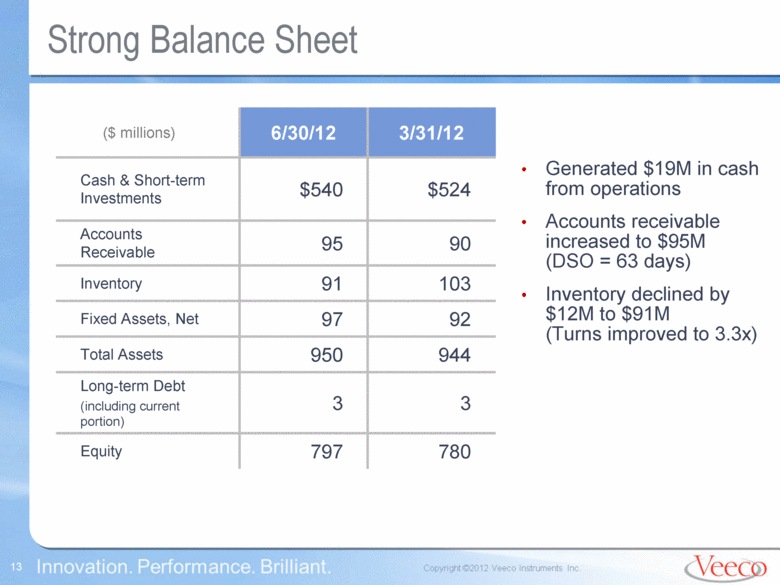
Strong Balance Sheet 6/30/12 3/31/12 Cash & Short-term Investments $540 $524 Accounts Receivable 95 90 Inventory 91 103 Fixed Assets, Net 97 92 Total Assets 950 944 Long-term Debt (including current portion) 3 3 Equity 797 780 ($ millions) Generated $19M in cash from operations Accounts receivable increased to $95M (DSO = 63 days) Inventory declined by $12M to $91M (Turns improved to 3.3x) |
|
|
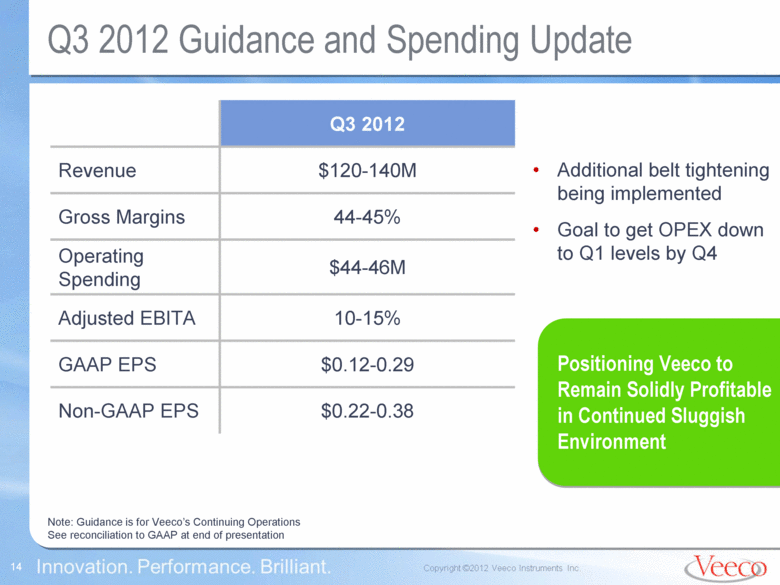
Q3 2012 Guidance and Spending Update Note: Guidance is for Veeco’s Continuing Operations See reconciliation to GAAP at end of presentation Q3 2012 Revenue $120-140M Gross Margins 44-45% Operating Spending $44-46M Adjusted EBITA 10-15% GAAP EPS $0.12-0.29 Non-GAAP EPS $0.22-0.38 Additional belt tightening being implemented Goal to get OPEX down to Q1 levels by Q4 Positioning Veeco to Remain Solidly Profitable in Continued Sluggish Environment |
|
|
John Peeler, Outlook |
|
|
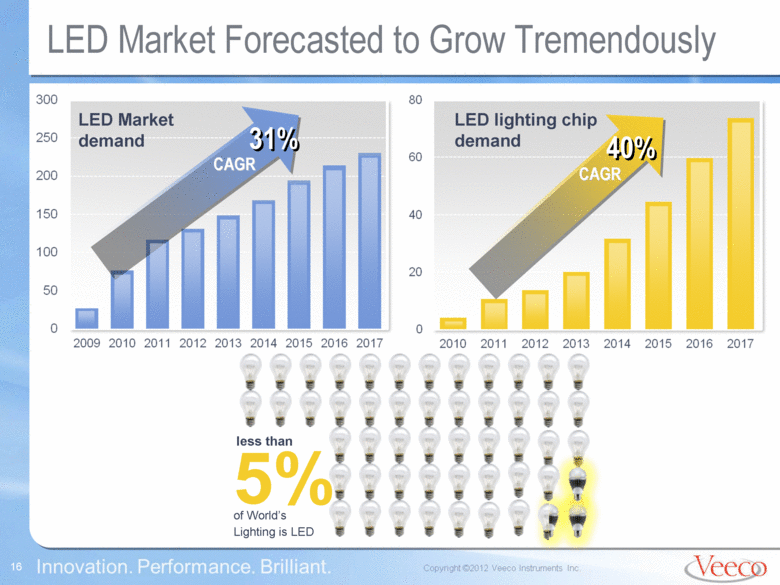
LED Market Forecasted to Grow Tremendously 31% LED Market demand CAGR 40% LED lighting chip demand CAGR |
|
|
K465i and MaxBright are #1 Selling MOCVD Systems Since Q3’10; Industry’s Highest Productivity 1 # Accelerated Pace of MOCVD System Development 2007 K465 2011 MaxBright 2010 K465i 2012 MaxBright® M™, MHP™ K465iHP™ |
|
|
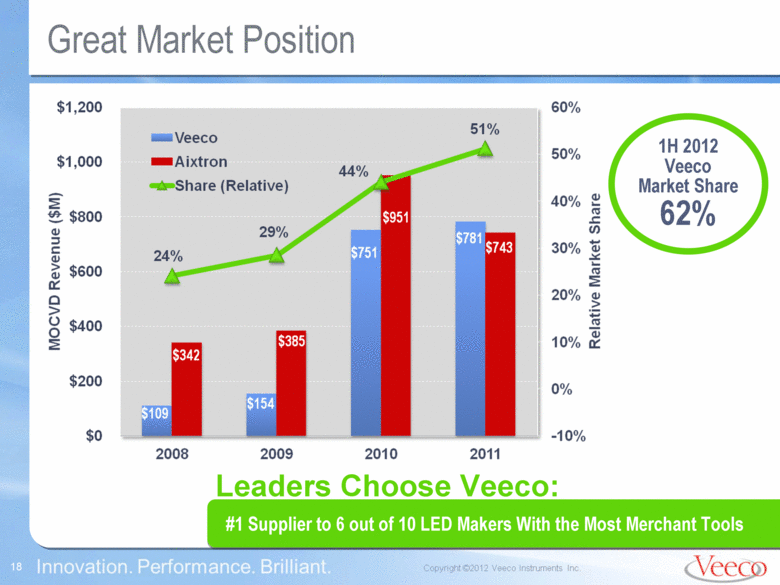
Great Market Position 1H 2012 Veeco Market Share 62% #1 Supplier to 6 out of 10 LED Makers With the Most Merchant Tools Leaders Choose Veeco: |
|
|
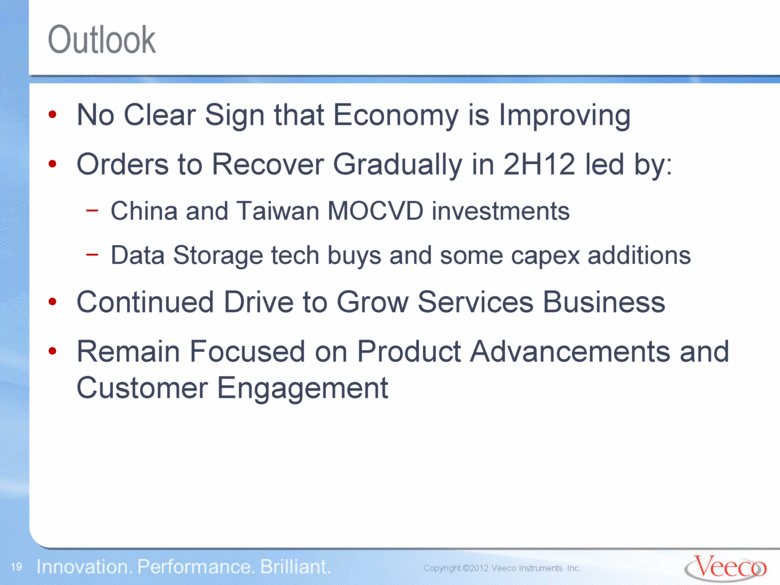
Outlook No Clear Sign that Economy is Improving Orders to Recover Gradually in 2H12 led by: China and Taiwan MOCVD investments Data Storage tech buys and some capex additions Continued Drive to Grow Services Business Remain Focused on Product Advancements and Customer Engagement |
|
|
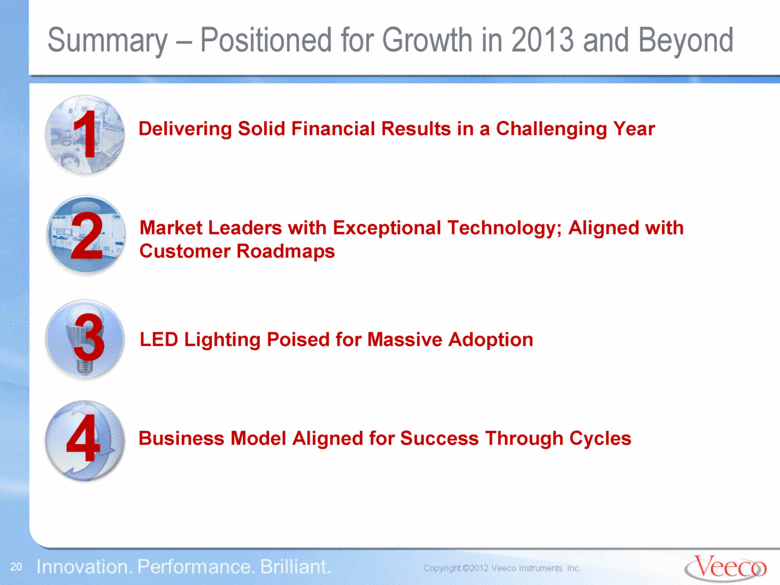
Summary – Positioned for Growth in 2013 and Beyond 1 Delivering Solid Financial Results in a Challenging Year 2 Market Leaders with Exceptional Technology; Aligned with Customer Roadmaps LED Lighting Poised for Massive Adoption Business Model Aligned for Success Through Cycles 3 4 |
|
|
Additional Financial Slides |
|
|
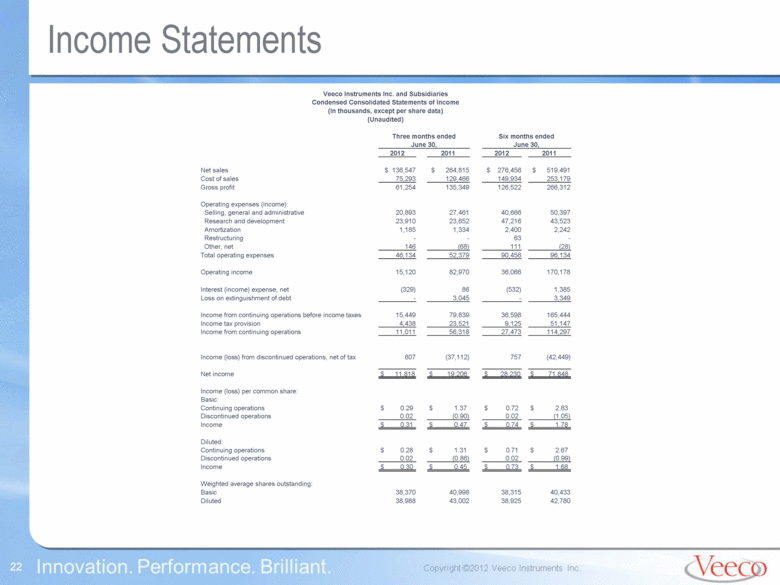
Income Statements Veeco Instruments Inc. and Subsidiaries Condensed Consolidated Statements of Income (In thousands, except per share data) (Unaudited) Three months ended Six months ended June 30, June 30, 2012 2011 2012 2011 Net sales $ 136,547 $ 264,815 $ 276,456 $ 519,491 Cost of sales 75,293 129,466 149,934 253,179 Gross profit 61,254 135,349 126,522 266,312 Operating expenses (income): Selling, general and administrative 20,893 27,461 40,666 50,397 Research and development 23,910 23,652 47,216 43,523 Amortization 1,185 1,334 2,400 2,242 Restructuring - - 63 - Other, net 146 (68) 111 (28) Total operating expenses 46,134 52,379 90,456 96,134 Operating income 15,120 82,970 36,066 170,178 Interest (income) expense, net (329) 86 (532) 1,385 Loss on extinguishment of debt - 3,045 - 3,349 Income from continuing operations before income taxes 15,449 79,839 36,598 165,444 Income tax provision 4,438 23,521 9,125 51,147 Income from continuing operations 11,011 56,318 27,473 114,297 Income (loss) from discontinued operations, net of tax 807 (37,112) 757 (42,449) Net income $ 11,818 $ 19,206 $ 28,230 $ 71,848 Income (loss) per common share: Basic: Continuing operations $ 0.29 $ 1.37 $ 0.72 $ 2.83 Discontinued operations 0.02 (0.90) 0.02 (1.05) Income $ 0.31 $ 0.47 $ 0.74 $ 1.78 Diluted: Continuing operations $ 0.28 $ 1.31 $ 0.71 $ 2.67 Discontinued operations 0.02 (0.86) 0.02 (0.99) Income $ 0.30 $ 0.45 $ 0.73 $ 1.68 Weighted average shares outstanding: Basic 38,370 40,998 38,315 40,433 Diluted 38,988 43,002 38,925 42,780 |
|
|
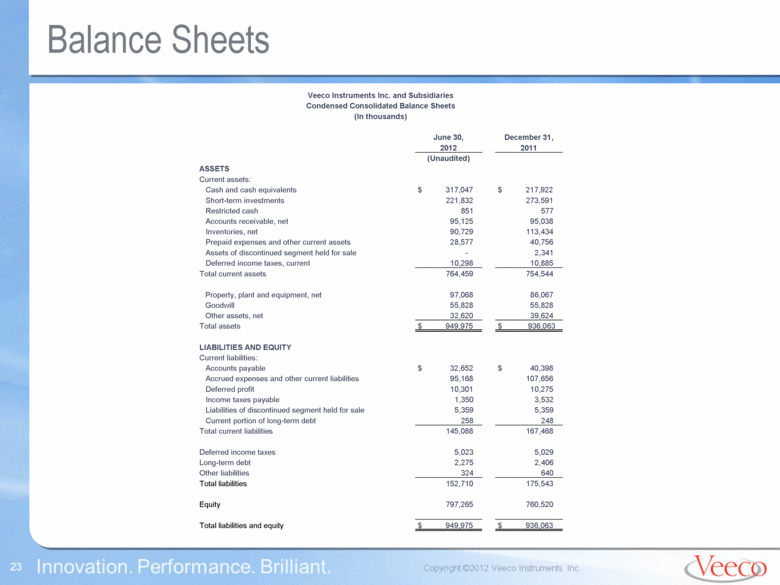
Balance Sheets Veeco Instruments Inc. and Subsidiaries Condensed Consolidated Balance Sheets (In thousands) June 30, December 31, 2012 2011 (Unaudited) ASSETS Current assets: Cash and cash equivalents $ 317,047 $ 217,922 Short-term investments 221,832 273,591 Restricted cash 851 577 Accounts receivable, net 95,125 95,038 Inventories, net 90,729 113,434 Prepaid expenses and other current assets 28,577 40,756 Assets of discontinued segment held for sale - 2,341 Deferred income taxes, current 10,298 10,885 Total current assets 764,459 754,544 Property, plant and equipment, net 97,068 86,067 Goodwill 55,828 55,828 Other assets, net 32,620 39,624 Total assets $ 949,975 $ 936,063 LIABILITIES AND EQUITY Current liabilities: Accounts payable $ 32,652 $ 40,398 Accrued expenses and other current liabilities 95,168 107,656 Deferred profit 10,301 10,275 Income taxes payable 1,350 3,532 Liabilities of discontinued segment held for sale 5,359 5,359 Current portion of long-term debt 258 248 Total current liabilities 145,088 167,468 Deferred income taxes 5,023 5,029 Long-term debt 2,275 2,406 Other liabilities 324 640 Total liabilities 152,710 175,543 Equity 797,265 760,520 Total liabilities and equity $ 949,975 $ 936,063 |
|
|
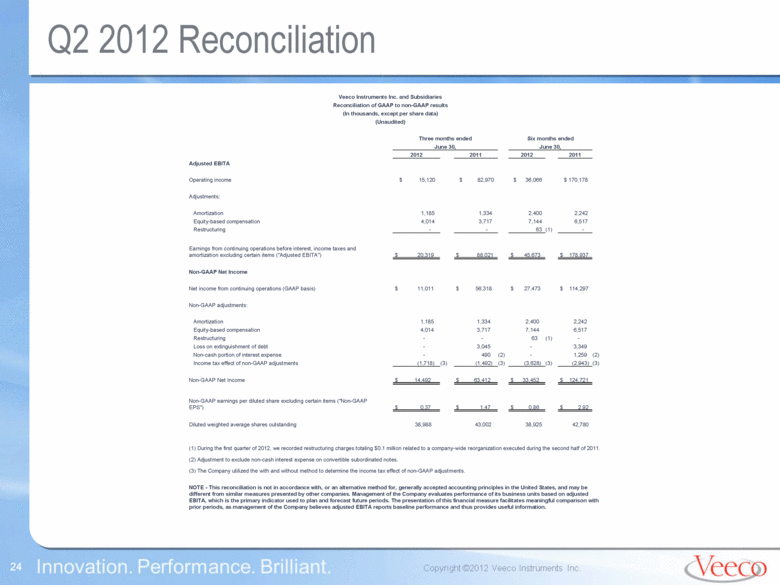
Q2 2012 Reconciliation Veeco Instruments Inc. and Subsidiaries Reconciliation of GAAP to non-GAAP results (In thousands, except per share data) (Unaudited) Three months ended Six months ended June 30, June 30, 2012 2011 2012 2011 Adjusted EBITA Operating income $ 15,120 $ 82,970 $ 36,066 $ 170,178 Adjustments: Amortization 1,185 1,334 2,400 2,242 Equity-based compensation 4,014 3,717 7,144 6,517 Restructuring - - 63 (1) - Earnings from continuing operations before interest, income taxes and amortization excluding certain items ("Adjusted EBITA") $ 20,319 $ 88,021 $ 45,673 $ 178,937 Non-GAAP Net Income Net income from continuing operations (GAAP basis) $ 11,011 $ 56,318 $ 27,473 $ 114,297 Non-GAAP adjustments: Amortization 1,185 1,334 2,400 2,242 Equity-based compensation 4,014 3,717 7,144 6,517 Restructuring - - 63 (1) - Loss on extinguishment of debt - 3,045 - 3,349 Non-cash portion of interest expense - 490 (2) - 1,259 (2) Income tax effect of non-GAAP adjustments (1,718) (3) (1,492) (3) (3,628) (3) (2,943) (3) Non-GAAP Net Income $ 14,492 $ 63,412 $ 33,452 $ 124,721 Non-GAAP earnings per diluted share excluding certain items ("Non-GAAP EPS") $ 0.37 $ 1.47 $ 0.86 $ 2.92 Diluted weighted average shares outstanding 38,988 43,002 38,925 42,780 (1) During the first quarter of 2012, we recorded restructuring charges totaling $0.1 million related to a company-wide reorganization executed during the second half of 2011. (2) Adjustment to exclude non-cash interest expense on convertible subordinated notes. (3) The Company utilized the with and without method to determine the income tax effect of non-GAAP adjustments. NOTE - This reconciliation is not in accordance with, or an alternative method for, generally accepted accounting principles in the United States, and may be different from similar measures presented by other companies. Management of the Company evaluates performance of its business units based on adjusted EBITA, which is the primary indicator used to plan and forecast future periods. The presentation of this financial measure facilitates meaningful comparison with prior periods, as management of the Company believes adjusted EBITA reports baseline performance and thus provides useful information. |
|
|
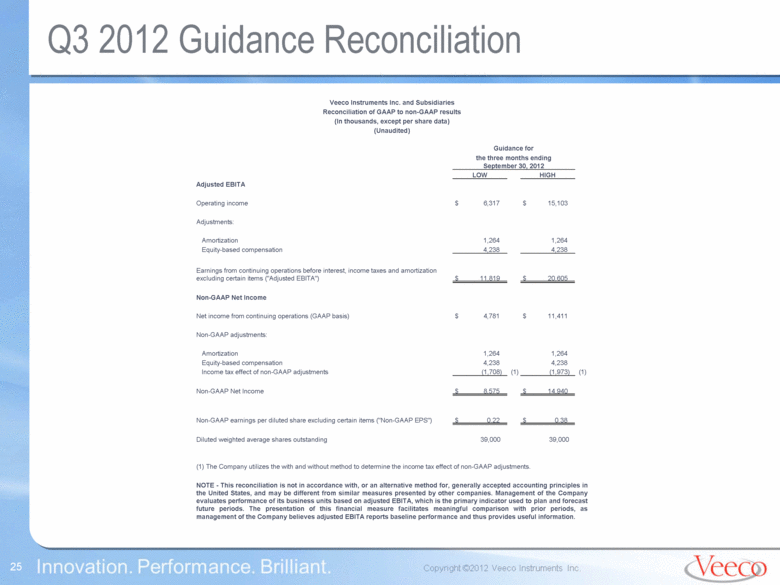
Q3 2012 Guidance Reconciliation Veeco Instruments Inc. and Subsidiaries Reconciliation of GAAP to non-GAAP results (In thousands, except per share data) (Unaudited) Guidance for the three months ending September 30, 2012 LOW HIGH Adjusted EBITA Operating income $ 6,317 $ 15,103 Adjustments: Amortization 1,264 1,264 Equity-based compensation 4,238 4,238 Earnings from continuing operations before interest, income taxes and amortization excluding certain items ("Adjusted EBITA") $ 11,819 $ 20,605 Non-GAAP Net Income Net income from continuing operations (GAAP basis) $ 4,781 $ 11,411 Non-GAAP adjustments: Amortization 1,264 1,264 Equity-based compensation 4,238 4,238 Income tax effect of non-GAAP adjustments (1,708) (1) (1,973) (1) Non-GAAP Net Income $ 8,575 $ 14,940 Non-GAAP earnings per diluted share excluding certain items ("Non-GAAP EPS") $ 0.22 $ 0.38 Diluted weighted average shares outstanding 39,000 39,000 (1) The Company utilizes the with and without method to determine the income tax effect of non-GAAP adjustments. NOTE - This reconciliation is not in accordance with, or an alternative method for, generally accepted accounting principles in the United States, and may be different from similar measures presented by other companies. Management of the Company evaluates performance of its business units based on adjusted EBITA, which is the primary indicator used to plan and forecast future periods. The presentation of this financial measure facilitates meaningful comparison with prior periods, as management of the Company believes adjusted EBITA reports baseline performance and thus provides useful information. |
|
|
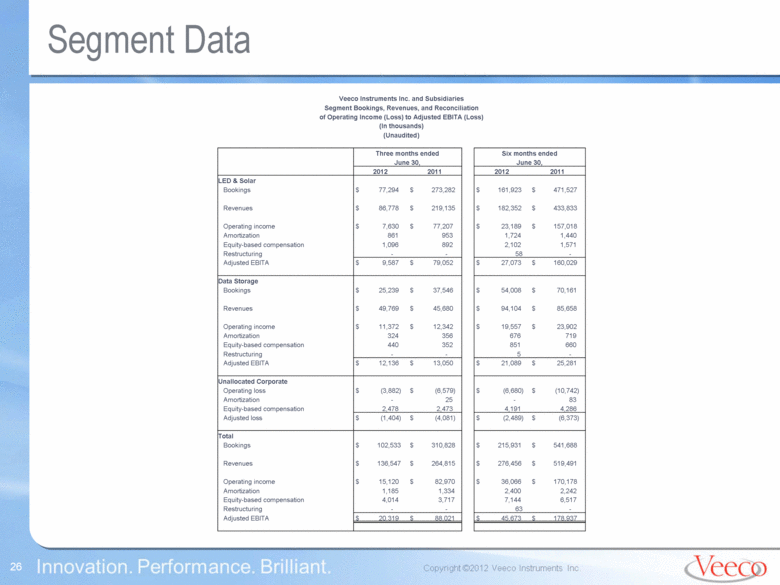
Segment Data Veeco Instruments Inc. and Subsidiaries Segment Bookings, Revenues, and Reconciliation of Operating Income (Loss) to Adjusted EBITA (Loss) (In thousands) (Unaudited) Three months ended Six months ended June 30, June 30, 2012 2011 2012 2011 LED & Solar Bookings $ 77,294 $ 273,282 $ 161,923 $ 471,527 Revenues $ 86,778 $ 219,135 $ 182,352 $ 433,833 Operating income $ 7,630 $ 77,207 $ 23,189 $ 157,018 Amortization 861 953 1,724 1,440 Equity-based compensation 1,096 892 2,102 1,571 Restructuring - - 58 - Adjusted EBITA $ 9,587 $ 79,052 $ 27,073 $ 160,029 Data Storage Bookings $ 25,239 $ 37,546 $ 54,008 $ 70,161 Revenues $ 49,769 $ 45,680 $ 94,104 $ 85,658 Operating income $ 11,372 $ 12,342 $ 19,557 $ 23,902 Amortization 324 356 676 719 Equity-based compensation 440 352 851 660 Restructuring - - 5 - Adjusted EBITA $ 12,136 $ 13,050 $ 21,089 $ 25,281 Unallocated Corporate Operating loss $ (3,882) $ (6,579) $ (6,680) $ (10,742) Amortization - 25 - 83 Equity-based compensation 2,478 2,473 4,191 4,286 Adjusted loss $ (1,404) $ (4,081) $ (2,489) $ (6,373) Total Bookings $ 102,533 $ 310,828 $ 215,931 $ 541,688 Revenues $ 136,547 $ 264,815 $ 276,456 $ 519,491 Operating income $ 15,120 $ 82,970 $ 36,066 $ 170,178 Amortization 1,185 1,334 2,400 2,242 Equity-based compensation 4,014 3,717 7,144 6,517 Restructuring - - 63 - Adjusted EBITA $ 20,319 $ 88,021 $ 45,673 $ 178,937 |

