Attached files
| file | filename |
|---|---|
| 8-K - 8-K - DATALINK CORP | a12-17082_18k.htm |
| EX-99.1 - EX-99.1 - DATALINK CORP | a12-17082_1ex99d1.htm |
Exhibit 99.2
Q2 2012 Investor Conference Call Script
July 26, 2012
Paul Lidsky:
Thank you, operator. Good afternoon. I’d like to welcome everyone to this afternoon’s conference call. Thank you for joining us. With me today is Greg Barnum, our Vice President of Finance and Chief Financial Officer. I’ll now turn the call over to Greg to discuss our second-quarter results and then I will provide some additional perspectives on the quarter and our outlook for the third quarter of 2012.
Greg Barnum:
Thanks Paul.
Before we begin with the quarter’s results let me first remind everyone that in today’s conference call we will be discussing our views regarding future events and financial performance. These forward-looking statements are subject to certain risks and uncertainties. Actual future results and trends may differ materially from historical results or those anticipated, depending on a variety of factors. We undertake no obligation to publicly update any forward-looking statement, whether written or oral, that may be made from time to time, whether as a result of new information, future developments or otherwise. Please refer to Datalink’s filings with the Securities and Exchange Commission for a full discussion of our company’s risk factors.
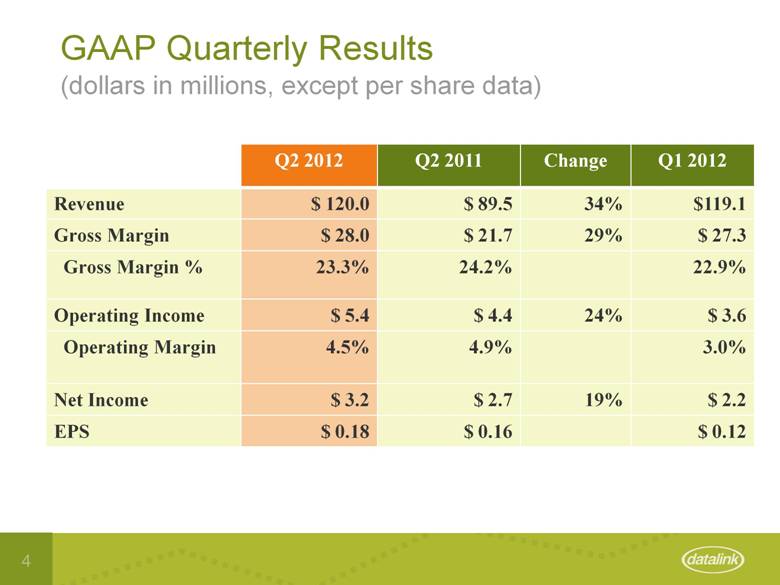
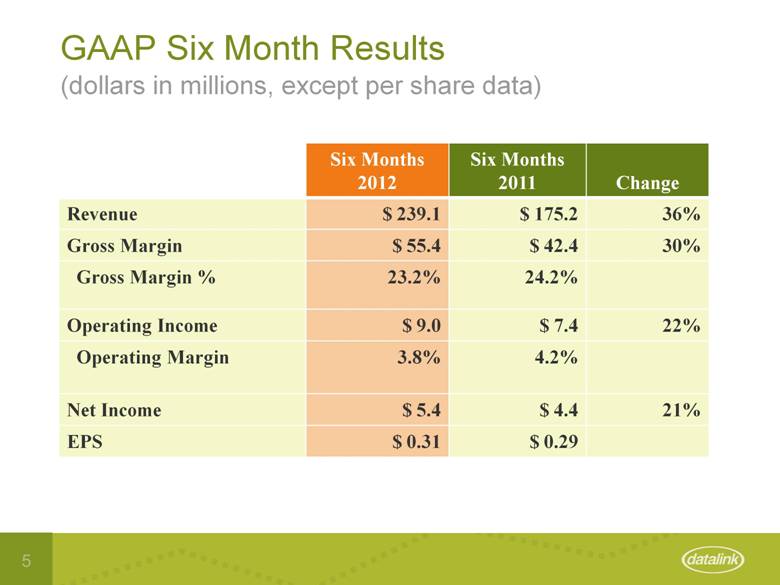
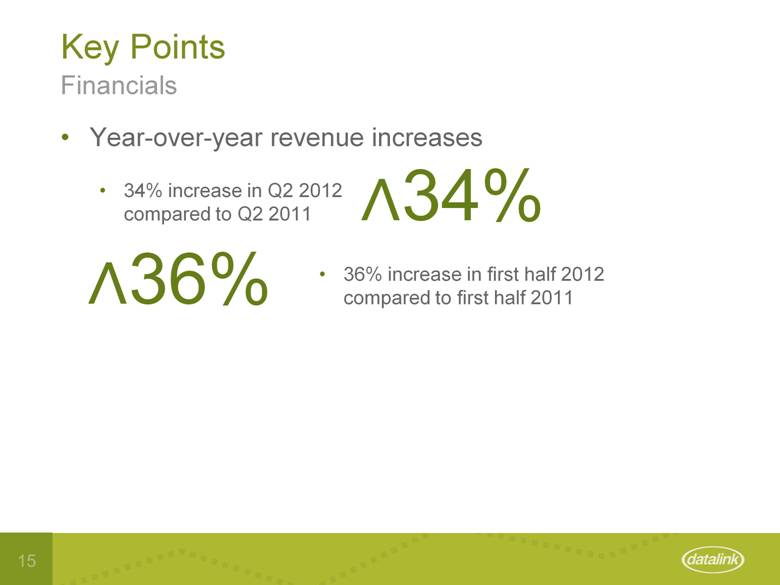
Revenues for the second quarter ended June 30, 2012 increased 34% to $120.0 million compared to $89.5 million for the prior-year second quarter. Sequential revenues from Q1 to Q2 were flat, primarily because of lengthening sales cycles, as Paul will explain shortly. Revenues for the six
months ended June 30, 2012 increased 36% to $239.1 million compared to $175.2 million in the first six months of 2011.
On a GAAP basis, we reported net earnings of $3.2 million or $0.18 per share for the second quarter of 2012. This compares to net earnings of $2.2 million or $0.12 per share in the previous quarter, and $2.7 million or $0.16 per share in the comparable quarter of 2011. For the first six months of 2012, we reported net earnings of $5.4 million, or $0.31 per share, compared to net earnings of $4.4 million, or $0.29 per share for the first six months of 2011.
The results for the first two quarters of 2012 include the results from operations from the acquisition of Midwave in October 2011. Since Midwave has been totally integrated into our operations we are no longer able to accurately break out the contribution from the acquisition.
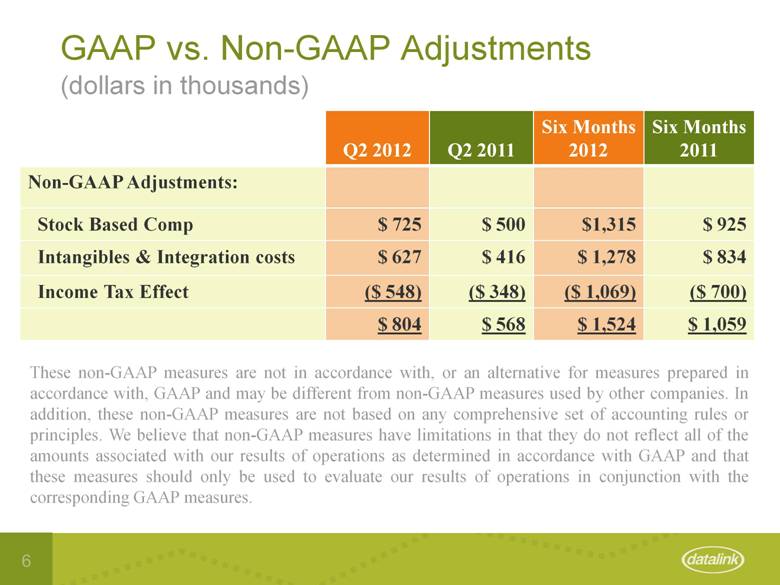
For the rest of my comments on the income statement, I will be referring to non-GAAP amounts and percentages as reported in today’s press release. A detailed reconciliation between GAAP and non-GAAP information is contained in the tables included in the today’s press release. The primary adjustments to GAAP results relate to stock based compensation charges, the amortization of intangibles, and integration and acquisition costs, net of income taxes.
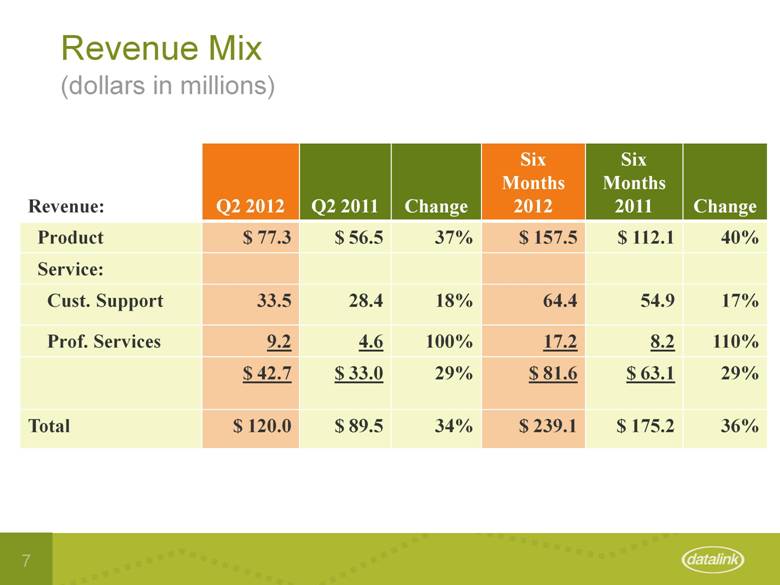
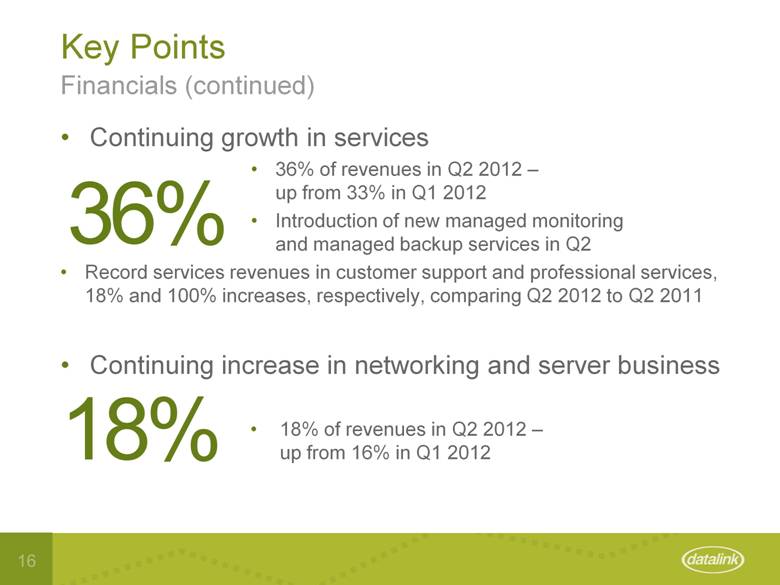
In the second quarter of 2012 our product revenues increased 37% to $77.3 million, and our service revenues increased 29% to $42.7 million compared to the second quarter of 2011. Within the service component of revenues we saw customer support revenues increase 18% to $33.5 million and professional service revenues doubled to $9.2 million, both records for Datalink. Revenue gains when compared to Q1 were negligible, but for the first six months of 2012 we saw product revenues increase 40% and service revenues increase 29%.
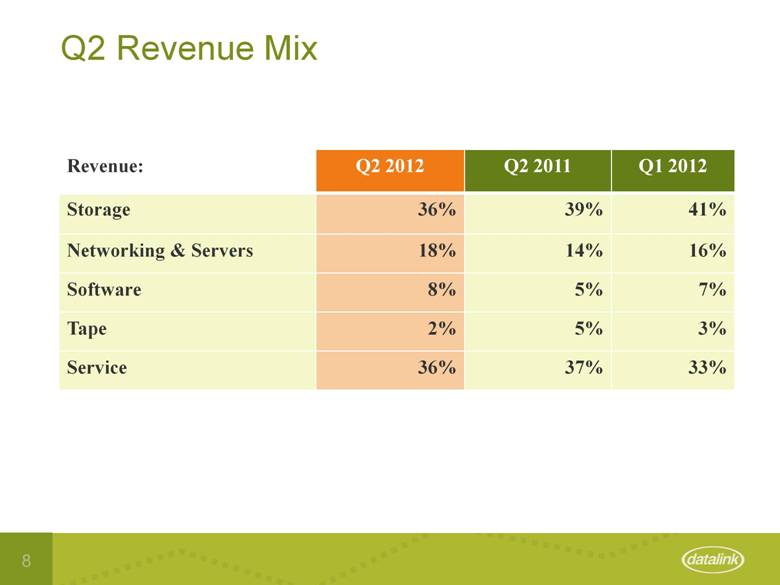
Our revenue mix for the quarter was 36% storage, 18% networking and servers, 8% software, 2% tape, and 36% service. This mix represents a continual increase in our networking and server revenues, mainly driven by increased Cisco revenues, from the second quarter of last year and
the first quarter of this year when networking and servers comprised 14% and 16% of our total revenues, respectively.
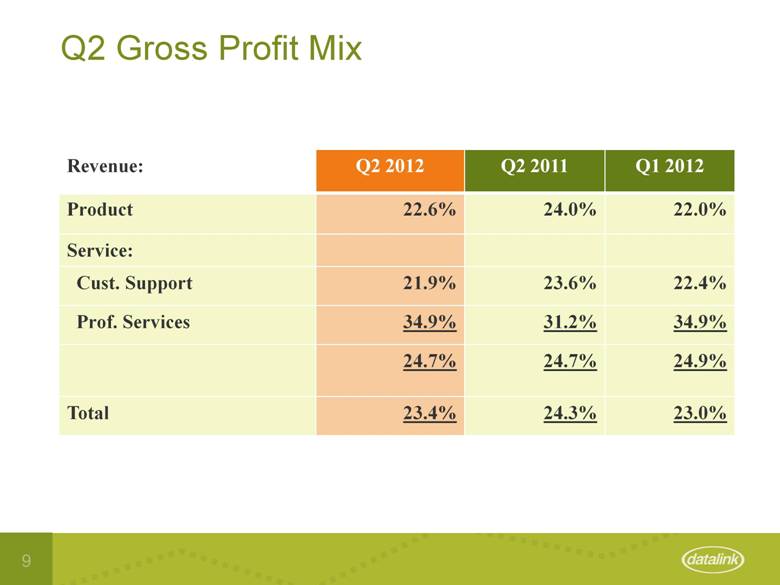
Overall gross margin in the second quarter of 2012 was 23.4% which is down from 24.3% in the second quarter of 2011, however up from 23.0% in the first quarter of 2012. This year over year decrease is mainly due to the increase in our networking and server businesses, which historically have carried lower gross margins than storage. The uptick from the first quarter of this year is mainly due to product mix and the record level of professional services revenues which carry our highest gross margins.
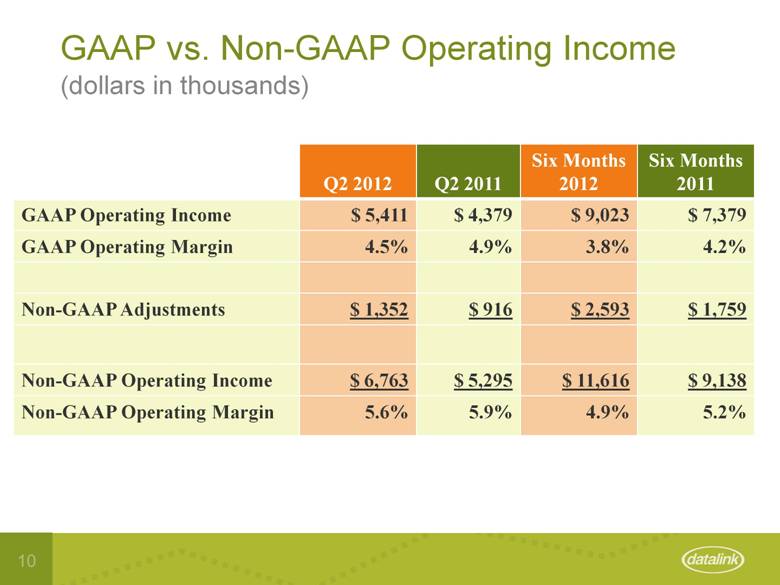
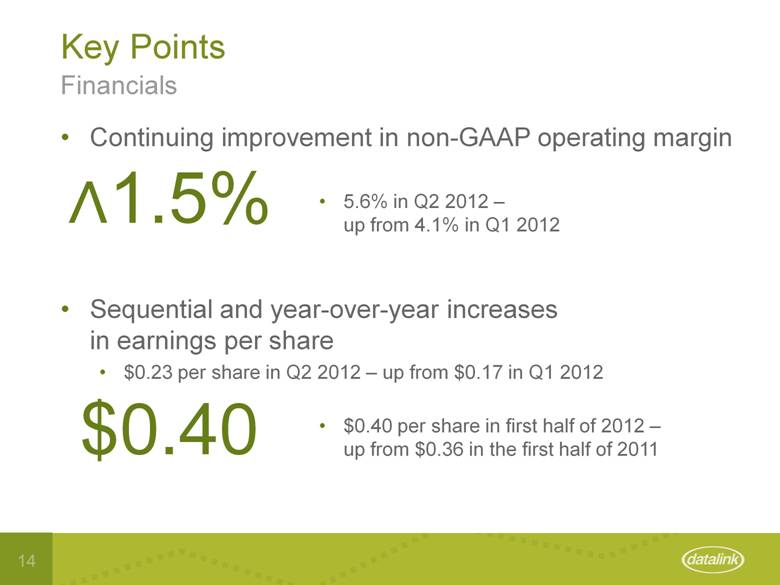
Operating income for the second quarter of 2012 was a record $6.8 million or 5.6% of revenue compared to $4.9 million or 4.1% of revenue for the previous quarter. In addition, we saw a small decline in operating margin from the comparable quarter in 2011, when we had operating income of $5.3 million representing 5.9% of revenue. The slight decrease was mainly due to planned investments in infrastructure, including human resources, customer support and IT systems.
For the six months our operating income was a record $11.6 million or 4.9% of revenue compared to $9.1 million or 5.2% in the first six months of last year.
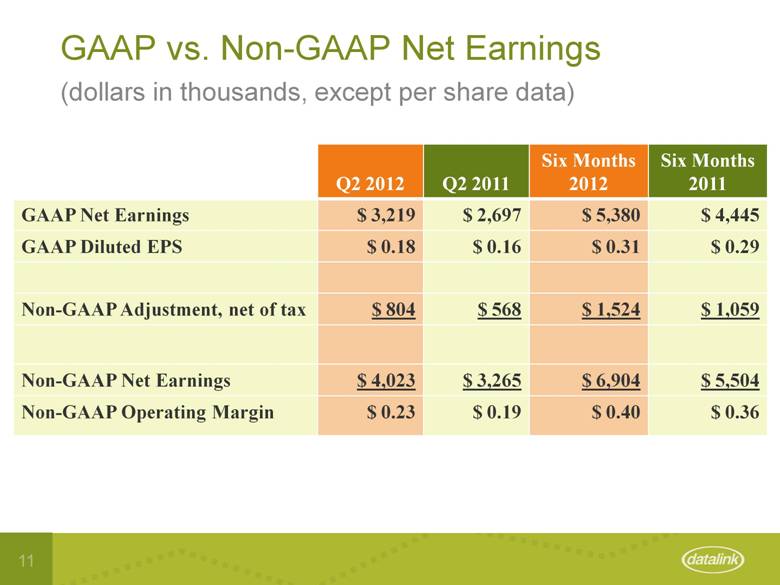
Net earnings for the second quarter of 2012 were a record $4.0 million or $0.23 per share. This compares to net earnings of $2.9 million or $0.17 per share in the first quarter of 2012, a 36% increase. For the six month period we saw net earnings increase 25% to $6.9 million or $0.40 per share compared to $5.5 million or $0.36 per share in the first six months of 2011.
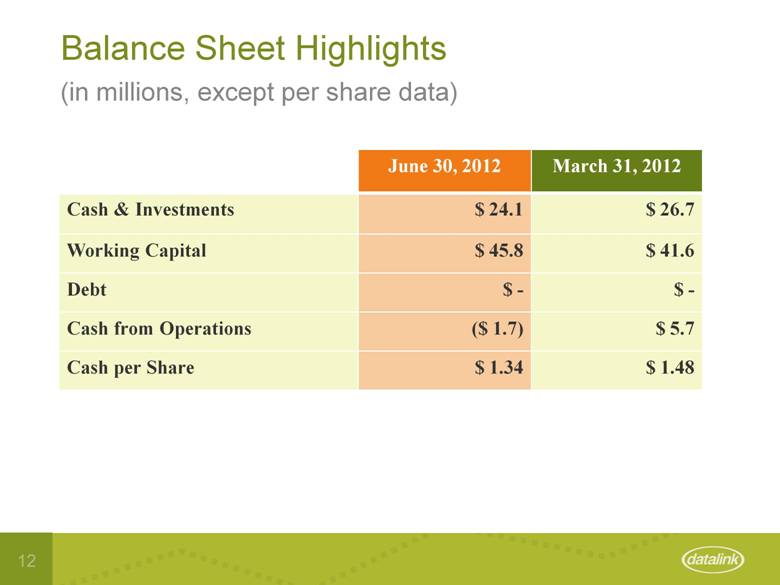
We furthered strengthened our balance sheet during the quarter. Our working capital position at the end of the quarter was $45.8 million, compared to $41.6 million at the end of the first quarter. Our cash and investment balance at the end of June was $24.1 million and our balance sheet remains debt free.
Let me now turn the call over to Paul.
Paul Lidsky:
Thanks Greg.
As you have just heard, Datalink’s operating income as a percentage of revenues and earnings per share both increased quarter over quarter. This is in keeping with our projections and the strategies we have put into place to achieve them including: last October’s acquisition of Midwave, the diversification of our product portfolio, and the expansion of our services business. Notably, as Greg mentioned, we saw a record level of professional services revenues, which helped drive gross margins as well as earnings gains over the previous quarter.
Our operating income for the second quarter of 2012 was a record $6.8 million or 5.6% of revenue compared to $4.9 million or 4.1% of revenue in the previous quarter. These operating margins are consistent with the financial models we have shared with investors over the past two years.
Our favorable revenue mix and cost savings achieved through good management contributed to delivering our 13th consecutive quarter of non-GAAP net earnings, and a six-cent per share gain over the first quarter. Again, non-GAAP net earnings for the second quarter of 2012 were a record $4.0 million or $0.23 per share. That’s a 40% increase over the previous quarter and a 23% increase over the second quarter of 2011.
Revenues / Sales Cycle / Pipeline
These positive developments in operating income as a percentage of revenues and earnings during the second quarter occurred despite the fact that, as Greg indicated our top-line revenues
were below our guidance for the quarter with very little change from Q1 to Q2. Let me make several points about the revenue numbers.
First, Datalink revenues increased 34% over the comparable quarter in 2011 and are up 36% for the first half of the year. We have made major gains because of the steps we have taken to expand and diversify our revenue stream.
Second, we are not seeing the cancellation of large projects that we experienced at the height of the recession, nor a decrease in new projects in our pipeline. June was slower than expected, but orders picked up during the last week of the quarter. Sales cycles are lengthening because we are selling larger projects — in part because of our integrated data center strategy — and because companies are requiring additional rounds of approval given the current economic climate.
Third, our sales pipeline is strong and continuing to grow, with a 16% increase over the previous quarter. This indicates that our customers are planning to spend even though they are scrutinizing large capital expenditures more carefully than in the past. The demand for a modernized data center infrastructure, including unified data centers and virtualization with all of the associated business efficiency and agility benefits, has not abated. It is simply taking customers longer to make decisions.
Overall, our business remains healthy, our strategy is on course, and we anticipate that revenue gains from the second to third quarter will be consistent with previous years.
Product Mix / Services Growth
The evolving change in our product mix continues to validate our move from our roots in selling silo’d storage to providing entire data center infrastructures. As Greg mentioned, our networking and server revenues grew from 14% to 18% of total revenues between Q2 2011 and Q2 2012. That compares to 9% of revenues coming from networking and server sales in Q1 2011. It
shows a growing understanding in the marketplace that you gain efficiencies if you deploy newer technologies that integrate server, storage, network and virtualized solutions.
Another bright spot - particularly from a profit perspective — is the rise in services from 33% to 36% of our total revenues from Q1 2012 to Q2 2012. Year over year, as the accompanying data shows, this translates into a doubling of Q2 revenues for professional services from $4.6 million to $9.2 million. The change is being driven by an increase in complex systems integration projects handled by our field engineering and consulting groups. We continue to work on our services strategy that we expect will increase these numbers, along with the higher gross margins associated with services. We expect to unfold additional new offerings over the next four quarters.
We also launched our new managed monitoring and managed backup services this quarter. These new offerings are part of our ongoing initiative to increase services revenues by adding new high-touch programs designed to establish long-term customer relationships. We expect to announce the first contract in our new managed services portfolio shortly.
Virtual Data Centers
Part of the change in our product and services mix continues to involve the unified or virtual data centers - or VDCs for short — that are a key component of our growth strategy. These newer data center infrastructures unify network, compute and storage platforms to help businesses achieve greater agility and efficiency, while also taking advantage of cloud and virtualization technologies. They are marketed under brand names including Flexpod by NetApp with Cisco and VMware; and VBlock and VCE by EMC with Cisco & VMware.
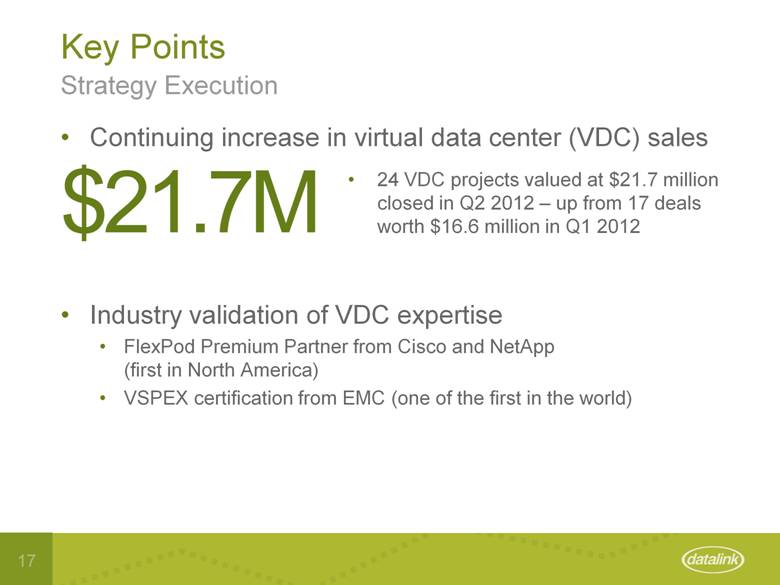
Our VDC business continued to grow in the second quarter. We closed 24 VDC sales valued at $21.7 million — up from 17 deals worth $16.6 million in the previous quarter. Many of these sales have included our OneCall Unified Support Service, which streamlines problem resolution
by providing a single support contact and support organization for these multiple vendor systems.
During the quarter, we also achieved two significant milestones related to VDCs:
· First, we became the first North American channel partner to achieve the new FlexPod Premium Partner designation from Cisco and NetApp, based on our advanced competencies in providing solutions and services supporting FlexPod architectures.
· Second, we became one of the first partners certified to sell, design, deploy, integrate and support EMC’s new VSPEX reference data center architecture.
With the addition of VSPEX to our portfolio, we have extended our ability to customize unified data centers to meet the requirements of each particular customer. This is a key market strength for Datalink that builds on the VDC expertise and integration capabilities we have been developing over the past several years to support the market shift toward this new data center model.
Cisco and EMC Partnerships
As a final note before we discuss guidance, I want to mention that both our Cisco and EMC partnerships are playing an important role in executing our data center strategy and expanding our overall business.
In the case of Cisco, as we have discussed before, one of the big drivers is the Cisco Unified Computing or UCS System. In simple terms, UCS is the plumbing of the modern data center. It’s important because it reduces server, cabling, power, cooling and management needs through strategies like virtualization. Our second quarter Cisco revenues were up 11% over the previous quarter, and we expect to continued steady growth with this product offering.
In the case of EMC, which is a newer addition to our solutions portfolio, the partnership we established in August 2011 adds to the storage options we can offer customers to best fit their technology environments. It also gives us access to clustered storage and deduplication solutions offered by EMC divisions Isilon Systems and Data Domain. Our second quarter EMC revenues were up 66% over the previous quarter, and we expect continued growth in this area.
Guidance
Now let’s look at what we expect for the third quarter of 2012. I have already discussed the elongated sales cycles that we experienced in Q2. We believe this phenomenon will continue for the remainder of this fiscal year. On the other hand, as I have also discussed, we have a strong growing sales pipeline. These two factors, combined with our backlog, are shaping our guidance.
Looking out to the third quarter of 2012, based on our backlog, current sales pipeline, and current customer spending patterns, we expect reported revenues of $117.0 million to $122.0 million for the upcoming quarter. This represents a 30% to 35% increase over revenues of $90.2 million in the third quarter of 2011, and is comparable to our typical second to third quarter trends. We expect third quarter 2012 net earnings to be between $0.16 and $0.21 per share on a GAAP basis, and between $0.20 and $0.25 per share on a non-GAAP basis. We remain confident in our commitment to integrated data centers as the market continues to embrace the advanced capabilities of these new technologies.
With that, I’ll turn the call back to the operator so that we can take your questions.
Operator:
Operator conducts Q&A session.
Paul Lidsky:
Thank you again for joining us today. Have a great afternoon.
|
|
Second Quarter 2012 Investor Call July 26, 2012 Paul Lidsky, CEO Greg Barnum, CFO |
|
|
Safe Harbor Statement Under the Private Securities Litigation Reform Act of 1995 With the exception of historical information, the statements set forth in this presentation include forward-looking statements that involve risk and uncertainties. The Company wishes to caution that a number of important factors could cause actual results to differ materially from those in the forward-looking statements. These and other factors which could cause actual results to differ materially from those in the forward-looking statements are discussed in the Company’s filings with the Securities and Exchange Commission. Any forward-looking statement made by us in this presentation is based only on information currently available to us and speaks only as of the date on which it is made. We undertake no obligation to publicly update any forward-looking statement, whether written or oral, that may be made from time to time, whether as a result of new information, future developments or otherwise. |
|
|
|

|
|
Numbers |
|
|
GAAP Quarterly Results (dollars in millions, except per share data) Q2 2012 Q2 2011 Change Q1 2012 Revenue $ 120.0 $ 89.5 34% $119.1 Gross Margin $ 28.0 $ 21.7 29% $ 27.3 Gross Margin % 23.3% 24.2% 22.9% Operating Income $ 5.4 $ 4.4 24% $ 3.6 Operating Margin 4.5% 4.9% 3.0% Net Income $ 3.2 $ 2.7 19% $ 2.2 EPS $ 0.18 $ 0.16 $ 0.12 |
|
|
GAAP Six Month Results (dollars in millions, except per share data) Six Months 2012 Six Months 2011 Change Revenue $ 239.1 $ 175.2 36% Gross Margin $ 55.4 $ 42.4 30% Gross Margin % 23.2% 24.2% Operating Income $ 9.0 $ 7.4 22% Operating Margin 3.8% 4.2% Net Income $ 5.4 $ 4.4 21% EPS $ 0.31 $ 0.29 |
|
|
GAAP vs. Non-GAAP Adjustments (dollars in thousands) Q2 2012 Q2 2011 Six Months 2012 Six Months 2011 Non-GAAP Adjustments: Stock Based Comp $ 725 $ 500 $1,315 $ 925 Intangibles & Integration costs $ 627 $ 416 $ 1,278 $ 834 Income Tax Effect ($ 548) ($ 348) ($ 1,069) ($ 700) $ 804 $ 568 $ 1,524 $ 1,059 These non-GAAP measures are not in accordance with, or an alternative for measures prepared in accordance with, GAAP and may be different from non-GAAP measures used by other companies. In addition, these non-GAAP measures are not based on any comprehensive set of accounting rules or principles. We believe that non-GAAP measures have limitations in that they do not reflect all of the amounts associated with our results of operations as determined in accordance with GAAP and that these measures should only be used to evaluate our results of operations in conjunction with the corresponding GAAP measures. |
|
|
Revenue Mix (dollars in millions) Revenue: Q2 2012 Q2 2011 Change Six Months 2012 Six Months 2011 Change Product $ 77.3 $ 56.5 37% $ 157.5 $ 112.1 40% Service: Cust. Support 33.5 28.4 18% 64.4 54.9 17% Prof. Services 9.2 4.6 100% 17.2 8.2 110% $ 42.7 $ 33.0 29% $ 81.6 $ 63.1 29% Total $ 120.0 $ 89.5 34% $ 239.1 $ 175.2 36% |
|
|
Q2 Revenue Mix Revenue: Q2 2012 Q2 2011 Q1 2012 Storage 36% 39% 41% Networking & Servers 18% 14% 16% Software 8% 5% 7% Tape 2% 5% 3% Service 36% 37% 33% |
|
|
Q2 Gross Profit Mix Revenue: Q2 2012 Q2 2011 Q1 2012 Product 22.6% 24.0% 22.0% Service: Cust. Support 21.9% 23.6% 22.4% Prof. Services 34.9% 31.2% 34.9% 24.7% 24.7% 24.9% Total 23.4% 24.3% 23.0% |
|
|
GAAP vs. Non-GAAP Operating Income Q2 2012 Q2 2011 Six Months 2012 Six Months 2011 GAAP Operating Income $ 5,411 $ 4,379 $ 9,023 $ 7,379 GAAP Operating Margin 4.5% 4.9% 3.8% 4.2% Non-GAAP Adjustments $ 1,352 $ 916 $ 2,593 $ 1,759 Non-GAAP Operating Income $ 6,763 $ 5,295 $ 11,616 $ 9,138 Non-GAAP Operating Margin 5.6% 5.9% 4.9% 5.2% (dollars in thousands) |
|
|
GAAP vs. Non-GAAP Net Earnings Q2 2012 Q2 2011 Six Months 2012 Six Months 2011 GAAP Net Earnings $ 3,219 $ 2,697 $ 5,380 $ 4,445 GAAP Diluted EPS $ 0.18 $ 0.16 $ 0.31 $ 0.29 Non-GAAP Adjustment, net of tax $ 804 $ 568 $ 1,524 $ 1,059 Non-GAAP Net Earnings $ 4,023 $ 3,265 $ 6,904 $ 5,504 Non-GAAP Operating Margin $ 0.23 $ 0.19 $ 0.40 $ 0.36 (dollars in thousands, except per share data) |
|
|
Balance Sheet Highlights June 30, 2012 March 31, 2012 Cash & Investments $ 24.1 $ 26.7 Working Capital $ 45.8 $ 41.6 Debt $ - $ - Cash from Operations ($ 1.7) $ 5.7 Cash per Share $ 1.34 $ 1.48 (in millions, except per share data) |
|
|
Key Points |

|
|
Key Points Financials $0.40 Continuing improvement in non-GAAP operating margin 5.6% in Q2 2012 – up from 4.1% in Q1 2012 Sequential and year-over-year increases in earnings per share $0.23 per share in Q2 2012 – up from $0.17 in Q1 2012 $0.40 per share in first half of 2012 – up from $0.36 in the first half of 2011 ^1.5% |
|
|
Key Points Year-over-year revenue increases 34% increase in Q2 2012 compared to Q2 2011 36% increase in first half 2012 compared to first half 2011 Financials ^34% ^36% |
|
|
Key Points Continuing growth in services 36% of revenues in Q2 2012 – up from 33% in Q1 2012 Introduction of new managed monitoring and managed backup services in Q2 Record services revenues in customer support and professional services, 18% and 100% increases, respectively, comparing Q2 2012 to Q2 2011 Continuing increase in networking and server business 18% of revenues in Q2 2012 – up from 16% in Q1 2012 Financials (continued) 36% 18% |
|
|
Key Points Continuing increase in virtual data center (VDC) sales 24 VDC projects valued at $21.7 million closed in Q2 2012 – up from 17 deals worth $16.6 million in Q1 2012 Industry validation of VDC expertise FlexPod Premium Partner from Cisco and NetApp (first in North America) VSPEX certification from EMC (one of the first in the world) Strategy Execution $21.7M |
|
|
Third Quarter 2012 Guidance Mar. 31, 2012 Sept. 30, 2011 Change Revenue $ 90.2 30% - 35% GAAP EPS $ 0.16 Non-GAAP EPS 23.6% $ 0.21 in millions, except per share data $ 117.0 - $ 122.0 $0.16 - $ 0.21 $ 0.20 - $ 0.25 |
|
|
Questions |

|
|
Thank you |