Attached files
| file | filename |
|---|---|
| EX-32.1 - EX-32.1 - DATALINK CORP | a2227726zex-32_1.htm |
| EX-31.1 - EX-31.1 - DATALINK CORP | a2227726zex-31_1.htm |
| EX-10.22 - EX-10.22 - DATALINK CORP | a2227726zex-10_22.htm |
| EX-23.1 - EX-23.1 - DATALINK CORP | a2227726zex-23_1.htm |
QuickLinks -- Click here to rapidly navigate through this document
UNITED STATES
SECURITIES AND EXCHANGE COMMISSION
Washington, D. C. 20549
FORM 10-K
| (Mark one) | ||
ý |
ANNUAL REPORT PURSUANT TO SECTION 13 OR 15(D) OF THE SECURITIES EXCHANGE ACT OF 1934 |
|
FOR THE FISCAL YEAR ENDED DECEMBER 31, 2015 |
||
OR |
||
o |
TRANSITION REPORT PURSUANT TO SECTION 13 OR 15(D) OF THE SECURITIES EXCHANGE ACT OF 1934 |
|
For The Transition Period From To |
||
Commission file number: 000-29758
DATALINK CORPORATION
(Exact name of registrant as specified in its charter)
| MINNESOTA | 41-0856543 | |
| (State or other jurisdiction of incorporation) | (IRS Employer Identification Number) |
10050 Crosstown Circle, Suite 500
EDEN PRAIRIE, MINNESOTA 55344
(Address of Principal Executive Offices)
(952) 944-3462
(Registrant's Telephone Number, Including Area Code)
Securities registered pursuant to Section 12(b) of the Act: None.
Securities registered pursuant to Section 12(g) of the Act: Common Stock, $0.001 par value.
Name of exchange on which registered: NASDAQ Global Market
Indicate by check mark if the registrant is a well-known seasoned issuer as defined in Rule 405 of the Securities Act. Yes o No ý
Indicate by check mark if the registrant is not required to file reports pursuant to Section 13 or Section 15(d) of the Act. Yes o No ý
Indicate by check mark whether the registrant (1) has filed all reports required to be filed by Section 13 or 15(d) of the Securities Exchange Act of 1934 during the preceding 12 months (or for such shorter period that the registrant was required to file such reports), and (2) has been subject to such filing requirements for the past 90 days. Yes ý No o
Indicate by check mark whether the registrant has submitted electronically and posted on its corporate Web site, if any, every Interactive Data File required to be submitted and posted pursuant to Rule 405 of Regulations S-T (§232.405 of this chapter) during the preceding 12 months (or for such shorter period that the registrant was required to submit and post such files). Yes ý No o
Indicate by check mark if disclosure of delinquent filers pursuant to Item 405 of Regulation S-K (§229.405 of this chapter) is not contained herein, and will not be contained, to the best of registrant's knowledge, in definitive proxy or information statements incorporated by reference in Part III of this Form 10-K or any amendment to this Form 10-K. ý
Indicate by check mark whether the registrant is a large accelerated filer, an accelerated filer, a non-accelerated filer or a smaller reporting company.
| Large Accelerated Filer o | Accelerated Filer ý | Non-Accelerated Filer o (Do not check if a smaller reporting company) |
Smaller Reporting Company o |
Indicate by check mark whether the registrant is a shell company (as defined by Rule 12b-2 of the Exchange Act). Yes o No ý
Aggregate market value of the voting and non-voting common equity held by non-affiliates of the registrant at June 30, 2015: $181,843,990.
At March 7, 2016, the number of shares outstanding of the registrant's classes of common stock was 21,942,615.
DOCUMENTS INCORPORATED BY REFERENCE
Portions of the Registrant's Proxy Statement for its 2016 Annual Meeting of Shareholders are incorporated by reference to Part III of this Form 10-K.
NOTE REGARDING FORWARD-LOOKING STATEMENTS
The Private Securities Litigation Reform Act of 1995 provides a "safe harbor" for certain forward-looking statements. This Annual Report on Form 10-K (Annual Report) contains forward-looking statements. These forward-looking statements are subject to certain risks and uncertainties, including those identified below, which could cause actual results to differ materially from historical results or those anticipated. The words "aim," "believe," "expect," "anticipate," "intend," "estimate," "should" and other expressions which indicate future events and trends identify forward-looking statements. Actual future results and trends may differ materially from historical results or those anticipated depending upon a variety of factors, including, but not limited to: the level of continuing demand for data center solutions and services including the effects of current economic and credit conditions and the ability of organizations to outsource data center infrastructure-related services to service providers such as us; the migration of organizations to virtualized server environments, including using a private cloud computing infrastructure; the extent to which clients deploy disk-based backup recovery solutions; the realization of the expected trends identified for advanced network infrastructures; reliance by manufacturers on their data service partners to integrate their specialized products; clients switching to solid state storage solutions; continued preferred status with certain principal suppliers; competition and pricing pressures and timing of our installations that may adversely affect our revenues and profits; fixed employment costs that may impact profitability if we suffer revenue shortfalls; our ability to hire and retain key technical and sales personnel; continued productivity of our sales personnel; our dependence on key suppliers; our ability to adapt to rapid technological change; risks associated with integrating completed and future acquisitions (including a failure of anticipated synergies to materialize); the ability to execute our acquisition strategy; fluctuations in our quarterly operating results; future changes in applicable accounting rules; and volatility in our stock price. Furthermore, our revenues for any particular quarter are not necessarily reflected by our backlog of contracted orders, which also may fluctuate unpredictably. We cannot assure you that we can grow or maintain our revenue and backlog from current levels.
These statements reflect our current views with respect to future events and are based on assumptions subject to risks and uncertainties. We do not intend to update or revise any forward-looking statements whether as a result of new information, future events or otherwise. Additional factors that may cause actual results to differ from our assumptions and expectations include those set forth in our Form 10-K and Form 10-Qs that we file with the Securities and Exchange Commission. All forward-looking statements are quantified by, and should be considered in conjunction with, such cautionary statements. For additional discussion of the risks and uncertainties applicable to us, see the "Risk Factors" section of this Form 10-K.
Overview
Datalink Corporation was incorporated in Minnesota in 1987. We provide information technology (IT) services and solutions that help organizations transform technology, operations and service delivery to meet business challenges. Focused on midsize and large companies, we provide a full life cycle of services including consulting, strategy, design, deploy, manage, and support. We leverage technology from the industry's leading original equipment manufacturers (OEMs) as part of our IT solutions portfolio.
Clients rely on us to offer an unbiased evaluation of solution options, to provide a full life cycle of services, and to take a comprehensive approach to delivering positive business outcomes across cloud, IT transformation, next-generation technology, and security.
1
Our portfolio of services and solutions spans four areas:
- •
- Cloud
- •
- Data center transformation
- •
- Next-generation technology
- •
- Security
Our cloud services and solutions provide an innovation opportunity for organizations, while reacting to the business pressure to deliver flexible, scalable, on-demand environments. Our clients face resource constraints, the threat of shadow IT, and frustrations with service levels all of which combine to create a relevance risk for internal IT. We have extensive experience with public, private, and hybrid clouds, helping our clients increase business agility and improve operational efficiency. Our experience with converged architectures and implementation of public, private and hybrid cloud environments includes cloud strategy, build-out and execution (including automation and orchestration) and ongoing IT operational management. Our cloud services provide a foundation for evolving services delivery models like ITaaS. These services include assessment and readiness workshops, security and migration strategies, automation, orchestration, application re-platforming, Datalink Cloud Complete, DR Testing and XaaS.
We help organizations transform technology, operations, and service delivery to meet business challenges. We provide expert guidance on IT investment, working with clients to deliver comprehensive IT transformations that enhance service levels, support growth, increase operational efficiency, and reduce risk. This transformation can include implementing next-generation technology, converged infrastructures, ITaaS, application migrations, and determining whether to move infrastructure to the cloud. We do this while considering the impact of the data center on compliance, security and business continuity. We combine deep technical knowledge and a portfolio of services to help clients define, build and run their data centers. Our portfolio includes technical infrastructure strategy and roadmaps, cloud strategies, IT process and management, migration strategy and planning, IT operational outsourcing and managed services strategies.
We work with clients to transform their technology, operations and service delivery. A critical piece of this is utilizing innovative technology to support future organizational goals. We commit significant resources to deliver deep technical expertise to solve our clients' needs. We are continually focused on evaluating technologies that can be valuable to our clients as we transform their IT environments and process. Our expertise includes cloud, flash, applications and XaaS.
Our security expertise, abilities, and portfolio deliver both strategic and tactical approaches to security effectiveness. Our security is crafted around helping clients deal with balancing the mitigation of advanced threats while delivering efficiency and compliance back to the business. Every project or initiative a company undertakes has a security component that is critical to its success. We help clients align business objectives with their security objectives in order to boost operational efficiency, ensure regulatory compliance, provide cost management and improve client experience. We focus on addressing those needs, ensuring that clients are prepared to handle today's cyber security threats in a systematic and intelligent way to achieve intended business outcomes. Our solutions range from testing and analysis of current state, to process improvement and tools rationalization, technology selection and managed security services.
We offer a full suite of practice-specific consulting, analysis, design, implementation, management, and support services. We deliver these services through our experienced team. As of December 31, 2015, our team consisted of approximately 312 engineering professional and support services members based throughout the United States.
2
We have a robust physical laboratory in Minneapolis that clients can utilize. This lab enables clients to participate in onsite and virtual demonstrations of a wide variety of technologies, including: site-to-site replication, data recovery, WAN optimization, de-duplication, and virtual data center architectures.
Our lab is also a fully functional cloud demonstration environment to validate predefined cloud use cases, include private cloud IaaS and PaaS, and generic IaaS hybrid cloud services (i.e., virtual machine configurations, virtual networking, and virtual storage). It can also be used as a cloud proof of concept to validate specific use cases, determine infrastructure readiness, identify integration requirements, and establish success criteria in a non-production, private cloud environment.
In addition to demonstrations and pre-build testing, we leverage this lab to test, validate and compare technologies from leading manufacturers and software developers, perform configuration services, troubleshoot support issues and train our professional and support services teams.
Industry Highlights
Midsize and large companies, which are typically greater than 500 employees, are increasingly focused on transforming their IT environment to align with and support business results, including those that improve the client experience, boost operation efficiency, manage costs, and mitigate risk via improvements in IT security and compliance. These clients continue to invest in their data centers while at the same time taking advantage of cloud computing, including private, hybrid and public clouds. IT departments are faced with the daunting challenge of managing rapidly expanding amounts of data. In addition, IT departments face increasing demands for availability of this data for day-to-day business and to meet regulatory requirements. At the same time, organizations are seeking greater operational efficiency and to manage costs. As a result, we expect that clients will continue to look for alternatives to simplify management of storage, network, and server infrastructures and increase productivity of existing IT teams. Transformational technologies and approaches, like converged infrastructure, cloud computing, and XaaS, help achieve each of these objectives. These approaches enable organizations to more quickly adapt to changing business requirements, improve service levels via simplified management, and better manage costs through higher utilization rates.
We anticipate that the move to unified virtual data center architectures—leveraging cloud technologies, expanding XaaS and focusing on service-led IT—will primarily occur in stages, with a focus on building a foundation to expand the capabilities for on-demand IT. We expect this will result in continued demand for consulting and operational services in addition to next-generation technology. We also expect that the increased bandwidth requirements will drive demand for high bandwidth integrated converged networks.
Employees, clients and suppliers demand flexible, service-driven IT environments, with uninterrupted access to mission-critical data 24 hours a day, 7 days a week. As a result, organizations continue to require flexible, scalable and highly available IT solutions.
We believe that capital investment priorities of the clients in our industry will include:
- •
- Data center transformation
To stay relevant and help the business succeed, IT organizations must evolve their service model. This will require a change of mindset, roles, processes, and technologies. Many are struggling to determine how to successfully change course and help the company leverage IT to maximize business value. This transformation, and the ability to enable business through IT, is the key to IT remaining relevant to the business and delivering expected outcomes back to the business to address reliability, speed to market, speed to revenue, security, etc.
3
- •
- Expansion of cloud capabilities
- •
- Enhanced security capabilities
- •
- Emerging technology landscape
Converged infrastructure and cloud technologies will play a key role in data center transformation strategies. Converged infrastructure, along with private and hybrid cloud computing, enable organizations to manage costs, increase agility, and improve management and utilization. Our clients need a comprehensive strategy for both the creation and IT operational running of their transformed data centers in order to fully realize the benefits of this transformation. We expect organizations will continue to seek the consulting services of providers, like us, to assess their environment, conduct a gap analysis, and develop migration paths that will enable them to protect and leverage each investment as they migrate to a private-cloud computing infrastructure. We expect that organizations will continue to seek the services of a provider that has unified data center expertise (server, storage, networks) and provides a full life cycle of services from consulting and design to deployment and ongoing management and support.
Increased need for high throughput performance, greater growth in data production, quick restoration of data and stringent data availability requirements combined with data center security are key drivers in data center decision-making. Every project or initiative a company undertakes has a security component that is critical to its success. IT organizations will struggle to find the balance between security controls to protect business information while also allowing employees to be productive, share information, and capitalize on opportunities that data provides. We expect these requirements to drive the need for service providers like us to provide both the strategic and tactical approaches to improve security effectiveness. This will allow clients to rationalize the appropriate balance between the protection and availability of information that supports the business.
We expect that the disruptive and evolving technology landscape will continue to impact business and IT leaders. This will drive the continued evolution of the data center. Cloud technologies as well as flash storage have changed user expectations and the way that IT organizations are expected to deliver services. We expect that applications, object storage, software-defined data centers and XaaS will have a similar impact on the data center. We expect IT organizations to increasingly outsource data center infrastructure-related services, including consulting, implementation, management and support, to a company who can provide a holistic solution. An increased focus on technologies that provide greater efficiency and business value, the growing complexity of networked environments and flat IT department headcount growth in light of current economic conditions should accelerate this trend.
The Datalink Opportunity
To stay relevant and help their business succeed, IT organizations must evolve to have a more service delivery-oriented model. Many are struggling to determine how to successfully change course, align with their business, and help their company leverage IT to maximize business value. This drives demand for IT services providers, such as us. Potential clients as well as data center infrastructure manufacturers are looking to providers, such as us, primarily for the following reasons:
Pressures on Clients. Migrating IT to be more service-driven requires changes in mindset, roles, processes and technologies. The move from outdated data centers and service models to those that are more efficient, scalable, and flexible is complex. Private cloud computing is transformational in nature. It impacts the relationship between the business and IT, as well as how IT organizations are structured and operate. As a result, we believe clients are looking for solution providers to sort through their options, define migration plans, and execute accordingly. In addition, we believe organizations will increasingly look beyond their in-house technical staff to leverage the expertise of companies, for
4
strategy definition and execution. In light of evolving expectations, and more outside provider options, IT has become a service provider with different capabilities. This transformation, and the ability to enable business through IT, is the key to IT remaining relevant to the business and delivering expected outcomes back to the business that address reliability, speed to market, speed to revenue, security and other business priorities.
Pressures on Manufacturers. We believe manufacturers increasingly rely on channel partners such as us for two principal reasons:
- •
- Sophisticated, converged and cloud based solutions require the integration of highly specialized products made by a variety of
manufacturers. A virtual data center, for instance, can utilize components such as software, disk systems, routers, switches, and servers, each from a different manufacturer. Manufacturers generally
focus on only a portion of the overall data center, leaving companies like us to integrate comprehensive solutions from the best available products and technologies.
- •
- Gross profit margins have been under pressure for many manufacturers. Because of the high cost of maintaining a large national sales and marketing organization, we believe manufacturers have found value in leveraging the sales and marketing functions of channel partners, such as us.
We believe we are uniquely positioned to capitalize on this significant opportunity for the following reasons:
Expertise. We have implemented data center solutions for over 25 years. This experience has given us significant expertise in understanding and leveraging converged and cloud technologies as well as the processes and operational management and support of these environments. We continually invest in training to adapt to the ever-changing needs of our clients and capitalize on opportunities.
Not Tied to One Manufacturer. Unlike many of our competitors, we are not tied to one or a limited number of manufacturers or particular technologies. This gives us the flexibility to be consultative in our approach. Our clients rely on us to choose the best available hardware and software and tailor it to their individual needs.
The Datalink Solution
We combine our expertise and comprehensive services portfolio with quality products from leading manufacturers to meet each client's specific needs. Our services include:
Consulting Services
Our consultants deliver highly customized analysis, advice, and actionable recommendations to help clients transform, optimize and manage their IT environment and associated processes. Our independent recommendations help clients respond to challenges in the following areas: data center transformation, private and hybrid cloud service management, IT security, software solutions, and IT resiliency.
Analysis
At the beginning of an engagement, we place considerable emphasis on formulating a needs analysis based on each client's business initiatives, operating environment and current and anticipated business requirements. While our focus is on each client's unique situation, we bring to each engagement our extensive technology knowledge and the experience we have gained from providing data center solutions for over 25 years to clients in numerous industries.
5
Our assessment services provide clients with objective guidance on developing cloud, backup and recovery, advanced network infrastructures that optimize their resources, leverage their existing environments and facilitate cost-effective growth for the future. These services provide an independent viewpoint to align people, processes and technologies with business objectives. They also help organizations maximize current investments, outline recommendations for future purchases and provide assurance that infrastructures are efficient, reliable and scalable.
Design
Once we have completed our initial analysis, we begin the design phase of the project. Our professional services teams work together to design a system that meets the client's server, storage and networking needs and budget. Our clients are able to choose from a wide range of technologies in order to fuse together the appropriate hardware, software and services for each project.
We design IT solutions based on each client's detailed business requirements. The engagement begins with a definition of the project's objectives, scope and key milestones. Our team then prepares an outline of the schedule and deliverables. Following a thorough analysis, the team prepares a comprehensive blueprint of the infrastructure, including a detailed design schematic, key implementation milestones and recommendations for handling potential configuration issues to ensure a smooth transition to new server, storage and networking environments.
Implementation
Once we design a solution, we formulate a detailed project implementation plan with our client to meet their financial and operating objectives and minimize disruption to their operations. We oversee the timely delivery of hardware and software products to the client's location. We then coordinate the installation with our professional services teams, or personnel from equipment manufacturers, and complete the installation at the client's site using industry best practices.
Support
We provide our clients advanced around the clock technical support from a team of client support and field engineers. Our extensive experience with data center solutions enables our staff to deliver expert configuration and usage assistance, technical advice and prompt incident detection and resolution. The support team also acts as our primary interface with manufacturers' technical support organizations.
Our support services offer additional flexible levels of service to help organizations maximize the return on their technology investments. We believe that our client support program is one of very few client service plans that provide support across multiple storage product lines and manufacturers.
We provide our analysis, design, implementation, management and support services to clients through either a stand-alone services engagement or as a part of an overall project that includes IT solutions and services.
Managed Services
We deliver IT operational services with a growing portfolio of managed services. Our services enhance the productivity of our client's IT teams, as well as drive greater operational efficiency. Our monitoring and reporting services provide real-time data and historical analysis of the performance of unified data center infrastructures spanning storage, servers, and networks. We also offer data management services that enhance data protection capabilities. Finally, we offer a suite of managed infrastructure services which includes around the clock monitoring, management, and reporting.
6
Managed services, such as these, can be coupled with our OneCall support services, thereby providing the opportunity for proactive monitor and alert service by our team of experts.
Our Strategy
Our strategy is to improve upon our position as an IT services and solutions provider and to continue to develop a client-focused, high performance company with sustainable profitable growth. To achieve these objectives, we intend to build upon our record of successfully addressing the evolving needs of our clients. Key elements of our strategy include:
Increase Sales Team Productivity
Although we believe that our sales productivity is high, we believe it can be improved. We continue to accelerate the learning and productivity curve of our newer sales professionals and enhance the skills of seasoned executives through implementation of techniques and best practices learned from our top producers.
Scale Existing Locations and Expand into New Locations via Acquisitions
We continue to scale our existing geographic locations to increase market share, leverage fixed expenses and provide higher quality service levels. We expect to drive this growth by hiring experienced, quality account executives and field engineers to gain sales productivity and field engineering utilization. In the past we have made acquisitions to grow our business including our acquisitions of Strategic Technologies, Inc. in 2012 and Bear Data Solutions, Inc. in 2014 (each discussed in more detail below). We intend to continue to grow our business via select acquisitions. We seek acquisition targets that align closely with our data center portfolio offerings.
Expand Client Support Revenues
We significantly increased our client support capabilities and performance over the last several years and will continue to make this a focus. We believe that our clients appreciate our quality support services, which we believe will continue to be a key differentiator and growth driver for us.
Enhance and Expand Our Consulting and Professional Services Business
Consulting services represent a sizable opportunity to drive additional professional services and follow-on hardware and software revenues in both existing and new accounts. Consulting services enable us to differentiate ourselves from our competition, as well as build executive-level relationships within the accounts we serve. Our Consulting Services team offers a comprehensive portfolio of services that are aligned with business needs in the following areas:
- •
- Data center transformation, including data center relocation, data migrations, infrastructure architecture, facilities strategy, and
IT project management;
- •
- Cloud service management, including IT as a service strategy, IT infrastructure library processes, services catalogs, and automation
and orchestration;
- •
- IT resiliency, including business impact analysis, business continuity and disaster recovery plans, data protection strategy and
security;
- •
- Residency services, including strategic planning, architectural design and expert implementation; and
- •
- Data security, including data encryption applications, investigation of alternative service delivery models, and incorporation of data security strategies into a client's disaster recovery business continuity strategy.
7
In 2015, 2014 and 2013, we made a significant investment in building out our Consulting Services organization and its services portfolio. We hired a leadership team who is very experienced in building a consulting practice within a data center infrastructure and integration company. We also added several consulting services offerings and enhanced other offerings. These new offerings along with others previously built, represent a services catalog that provides a revenue and profit stream that is not dependent on product sales or fulfillment. By expanding our consulting methodologies and offerings, building additional sales tools and cross-training our infrastructure organization, we will be able to expand our solution selling capabilities. We believe hiring experienced data center consultants, and providing our sales teams with the tools they need to uncover consulting opportunities, will accelerate consulting services revenues and often times result in additional hardware and software revenues.
Expand Managed Services Portfolio
Providing our clients with value-driven, recurring services represents a significant opportunity for differentiation and growth for us along with increasing reoccurring revenue. We will focus efforts around our expanded suite of managed services designed to free up the IT teams of our clients so that they can focus on high-impact projects, while at the same time helping them to drive greater data center efficiencies and services levels. Our managed services will initially span backup, archiving, server, storage and network operations.
Segment and Geographic Information
We do not have any separate reportable segments. In addition, we do not have any material long-lived assets located outside of the United States.
Suppliers and Products
We do not manufacture server, storage, or networking products. Instead, we continually evaluate and test new and emerging technologies from leading manufacturers to ensure that our solutions incorporate state-of-the-art, high performance, cost-effective technologies. This enables us to maintain our technological leadership, identify new and innovative products and applications and objectively help our clients align their data center solutions with their business needs.
We have strong, established relationships with the major storage, server, and networking hardware and software suppliers. Our expertise in open system environments includes UNIX, Microsoft Windows, Linux, Solaris, and in-depth knowledge of all major hardware and software technologies manufactured by industry leaders. This expertise has earned us preferred status with many of our principal suppliers. Preferred status often enables us to participate in our suppliers' new product development, evaluation, introduction and marketing programs. These collaborations enable us to identify and market innovative new hardware and software products and exchange critical information in order to maximize client satisfaction.
8
Some of our major suppliers and the products they provide are listed below:
Products
|
Suppliers | |
|---|---|---|
Disk Storage and Flash Storage |
Hitachi Data Systems Corporation NetApp Inc. Nimble Storage, Inc. Oracle Systems Pure Storage, Inc. Quantum Corporation |
|
Tape Automation |
Oracle Systems |
|
Software |
Commvault Systems Inc. |
|
Servers |
Cisco Systems, Inc. |
|
Switches/Directors/Storage Networking |
Cisco Systems, Inc. |
We have not had difficulty in obtaining products that we use in our business from our current suppliers. In addition, we do not rely on one or a few suppliers for the products we use in our business.
Clients
Client engagements range from specialized professional consulting, assessment and design services, to complex, migrations and implementations. We also provide hardware and software to our clients on an as-needed basis in order to enable one of our designs or to increase the capacity of their current infrastructures. We serve clients throughout the United States and internationally in a diverse group of data intensive industries. Our broad industry experience enables us to understand application and business issues specific to each client and to design and implement appropriate IT solutions.
In 2015, 2014, and 2013, we had no clients that accounted for 10% or more of our revenues. However, our top five clients collectively accounted for 13%, 7%, and 10% of our 2015, 2014, and 2013 revenues, respectively. See "Management's Discussion and Analysis of Financial Condition and Results of Operations" for the historical revenue generated by our services.
Sales and Marketing
We market and sell our products and services throughout the United States and internationally through a direct sales force. In addition to our Minneapolis headquarters, as of December 31, 2015, we had 38 field sales offices, including home offices, in order to efficiently serve our client's needs.
Our field account executives and account associates work closely with our technical services team in evaluating the IT infrastructure project needs of existing and prospective clients and in designing
9
high quality, cost effective solutions. To ensure quality service, we assign each client a specific field account executive and account associate. Our sales and technical teams generated a total of 510 new clients in 2015 through a combination of acquisitions and organic growth and sold product and services to over 2,150 current clients. Our sales and technical teams generated a total of 315 new clients in 2014 and 440 new clients in 2013.
In addition to the efforts of our field account executives, account associates, and technical services team we engage in a variety of other marketing activities designed to attract new business and retain client loyalty. We regularly execute integrated, demand generation campaigns, gain exposure through online and print trade publications, hold information seminars, and use social media channels to share information about topics, such as converged infrastructure, cloud computing, security, client outcomes, trends and best practices.
Competition
Competition for the solutions we provide is fragmented, and we compete with numerous large and small competitors. For IT solutions we compete with other technology infrastructure solution providers and system integrators, and technology value added resellers that focus on providing IT solutions. Our competitors are primarily either resellers that provide solutions using many of the same products from the manufacturers that we represent such as Cisco, Hitachi, NetApp, Palo Alto, Pure, Veritas, VMware or they also may provide solutions using other competing manufacturer's products such as IBM, HP and others. We may also compete directly against some of these manufacturers when they are involved in selling to the client directly.
We believe that the principal competitive factor when marketing our solutions is our overall business model where we are focused on making IT environments more efficient, manageable and responsive to our client's business needs. Other important factors include total cost, technical competence, the strength of our relationship with the client, the quality of our support services, and the quality of our relationship with the manufacturer of the products being supplied as part of an IT solution.
Employees
As of December 31, 2015, we had a total of 633 employees, all of which are full-time employees. We have no employment agreements with any of our employees, except for Mr. Lidsky, our President and Chief Executive Officer, Mr. Barnum, our Vice President, Finance and Chief Financial Officer and Secretary, Mr. O'Grady, our Chief Operating Officer, and Ms. Hamm, our Executive Vice President, Human Resources. None of our employees are unionized or subject to a collective bargaining agreement. We have experienced no work stoppages.
Backlog
We recognize product revenues upon shipment and configure products to client specifications which generally ship shortly after we receive our client's purchase order. Clients may change their orders with little or no penalty. However, we do receive some orders late in the quarter that cannot be shipped until the next quarter. In addition, we defer revenues resulting from sales of service contracts and amortize them into operations over the term of the contracts, which are generally twelve months. To a lesser extent, client constraints, including client readiness, and the availability of engineering resources may impact when we can complete our installation and configuration services, which represent approximately 6% of our revenues. Therefore, we do experience a backlog of orders. Our backlog, which represents firm orders we expect to recognize as revenue within the next 90 days, was $90.6 million and $96.1 million at December 31, 2015 and 2014, respectively.
10
Acquisitions
Bear Data Solutions, Inc. On October 18, 2014, we entered into an Agreement and Plan of Merger (the "Merger Agreement") with Bear Data. Bear Data is primarily an IT services firm, serving California-based and international clients from offices in San Francisco, San Jose, Irvine and San Diego. A significant portion of its revenues is derived from networking products including Cisco wireless, routing and core switches. The aggregate purchase price for the overall transaction was approximately $13.4 million, including a cash payment of $12.7 million, net of cash acquired, in connection with the merger (the "Preliminary Purchase Price"), which was partially offset by a net working capital receivable from the sellers of $741,000 resulting from the preliminary estimated net tangible asset adjustment as defined by the Merger Agreement. The Preliminary Purchase Price was subject to certain adjustments to reflect the difference, if any, between the net working capital at closing and target net working capital. An aggregate amount of $2.4 million of the Preliminary Purchase Price was placed into escrow to cover any post-closing adjustment to the Preliminary Purchase Price and indemnification obligations of the securityholders. Pursuant to the Merger Agreement, the sellers of Bear Data were obligated to pay us an amount equal to the difference between the actual net tangible assets on the closing date and the sellers' good faith estimate of net tangible assets as set forth in the Merger Agreement. In January 2016, we served a notice of claim for indemnification to recover approximately $798,000 in losses for accounts receivable, accounts payable and taxes against the indemnity escrow fund. Resolution between us and the sellers of Bear Data is ongoing.
We entered into a Common Stock Purchase Agreement (the "Common Stock Purchase Agreement"), also dated as of October 18, 2014, by and among Datalink Corporation, Merger Sub, and three executive securityholders of Bear Data. Under the Common Stock Purchase Agreement, we issued 156,360 shares of our common stock with a value of approximately $1.5 million, net of illiquidity adjustments, to the three Bear Data executives. The $13.4 million aggregate purchase price for the overall transaction discussed above includes the $1.5 million issuance of shares to the executive securityholders of Bear Data. For this purpose, our common stock was valued at the volume-weighted average of the per share trading prices of its common stock as reported through Bloomberg (based on all trades in our common stock and not an average of daily averages) for the 20 consecutive full trading days ending one business day prior to closing. These shares had an aggregate value of $1.7 million, offset by a $192,000 illiquidity adjustment. 75% of the shares issued under the Common Stock Purchase Agreement were not transferable until the first anniversary of closing.
Under the acquisition method of accounting, we estimated the fair value of the assets acquired and liabilities assumed of Bear Data primarily using a discounted cash flow approach with respect to identified intangible assets and goodwill. We based this approach upon its estimates of future cash flows from the acquired assets and liabilities and utilized a discount rate consistent with the inherent risk associated with the acquired assets and liabilities assumed. As of December 31, 2014, the fair value of the acquired assets was provisional as we had not yet finalized net working capital adjustments. The total purchase price was allocated to Bear Data's net tangible and identifiable assets based on their estimated fair values as of October 18, 2014. Adjustments to provisional amounts during the measurement period that were the result of information that existed as of the acquisition date require the revision of comparative prior period financial information when reissued in subsequent financial statements. Accordingly, our 2014 consolidated balance sheet has been retroactively adjusted to account for those changes.
Bear Data filed its final stub period federal and state income tax returns for 2014 during the three months ended September 30, 2015. The final stub period returns reported taxable losses, which have been carried back to the full extent possible. As a result, we recorded a $916,000 reduction in goodwill and increase in net deferred tax assets. The changes did not impact our consolidated statements of operations.
11
The acquisition of San Francisco-based Bear Data significantly increased our West Coast revenue base, expanded our Cisco expertise into strategically important new areas, and added more than 1,000 new midmarket and enterprise clients to whom we can market our comprehensive portfolio of data center offerings. It also increased our international sales. Our international sales comprised 5.7%, 1.4% and 1.0% of our total net sales for the years ended December 31, 2015, 2014, and 2013, respectively. Our results for 2014 and 2015 reflect the addition of Bear Data for the fourth quarter of 2014 and the full year for 2015. Please see Note 2 to our financial statements for further information.
Strategic Technologies, Inc. On October 4, 2012, we purchased substantially all of the assets and liabilities of Strategic Technologies, Inc. ("StraTech") from StraTech and Midas Medici Group Holdings, Inc. StraTech is an IT services and solutions firm that shares our focus on optimizing enterprise data centers and IT infrastructure through a common product and services portfolio designed to help clients increase business agility.
This acquisition expanded our market share and physical presence across the Eastern seaboard of the United States. The acquisition also allows us to diversify our product offerings from certain manufacturers and expand our high-margin professional and managed services business lines. We have experienced operational synergies and efficiencies through combined general and administrative corporate functions. Please see Note 2 to our financial statements for further information.
Available Information
Our website address is www.datalink.com. The material on our website is not part of this report. We make available at our website, free of charge, our Annual Reports on Form 10-K, Quarterly Reports on Form 10-Q, Current Reports on Form 8-K, and amendments to those reports filed or furnished pursuant to Section 13(a) or 15(d) of the Exchange Act as soon as reasonably practicable after we electronically file such material with, or furnish it to, the SEC.
The public may also read and copy any materials we file with the SEC at the SEC's Public Reference Room at 100 F Street NE, Washington, DC 20549. The public may obtain information on the operation of the Public Reference Room by calling the SEC at 1-800-SEC-0330. All SEC filings are also available at the SEC's website at www.sec.gov.
Executive Officers of the Registrant
Set forth below are the names, ages and titles of the persons serving as our current executive officers:
Name
|
Age | Position | ||
|---|---|---|---|---|
| Paul F. Lidsky | 62 | President and Chief Executive Officer | ||
Gregory T. Barnum |
61 |
Vice President, Finance and Chief Financial Officer and Secretary |
||
M. Shawn O'Grady |
53 |
Chief Operating Officer |
||
Patricia A. Hamm |
61 |
Executive Vice President, Human Resources |
||
Denise M. Westenfield |
52 |
Vice President, Controller and Chief Accounting Officer and Assistant Secretary |
None of our executive officers have any family relationships with any of the other executive officers or any of our directors.
Paul F. Lidsky was elected as a director in June 1998 and became our President and Chief Executive Officer in July 2009. Mr. Lidsky was the President and Chief Executive Officer of
12
Calabrio, Inc. from October 2007 until July 2009. From December 2005 until September 2007, Mr. Lidsky served as Chief Operating Officer for Spanlink Communications, Inc. Between 2003 and 2004, Mr. Lidsky was President and Chief Executive Officer of Computer Telephony Solutions. From 2002 to 2003, Mr. Lidsky was President and Chief Executive Officer of VigiLanz Corporation. From 1997 until 2002, Mr. Lidsky was the President and Chief Executive Officer of OneLink Communications, Inc. Between 1985 and 1997, Mr. Lidsky was employed by Norstan, Inc., most recently as Executive Vice President of Strategy and Business Development.
Gregory T. Barnum became our Vice President, Finance and Chief Financial Officer in March 2006 and our Secretary in February 2013. From January 2006 until the time he became our executive officer, he was a member of our Board of Directors. Prior to joining us, he served as Vice President of Finance, Chief Financial Officer and Corporate Secretary of Computer Network Technology Corporation from 1997 until the company's acquisition by McData Corporation in 2005. Between 1992 and 1997, Mr. Barnum served as Senior Vice President of Finance and Administration, Chief Financial Officer and Corporate Secretary of Tricord Systems, Inc., an enterprise server manufacturer. Between 1988 and 1992, he was Executive Vice President, Finance, Chief Financial Officer, Treasurer and Corporate Secretary of Cray Computer Corporation, a development stage company engaged in the design of supercomputers. Prior to that time, Mr. Barnum served in various accounting and financial management capacities for Cray Research, Inc., a manufacturer of supercomputers.
M. Shawn O'Grady became our Executive Vice President, Field Operations in December 2009 and was appointed as our Chief Operating Officer in November 2013. Prior to joining us, he served Incentra and its affiliates since 2005 in various executive positions, most recently, as its President and Chief Executive Officer. Prior to his employment with Incentra, Mr. O'Grady was employed by Siemens Business Services, the information technology services division of Siemens AG, since 2000 in various capacities including its Senior Vice President and Business Unit General Manager, Consulting and Integration.
Patricia A. Hamm joined us as Executive Vice President, Human Resources in September 2014. With more than 30 years of leadership experience, Patricia aligns organizational strategies, operations, and employee engagement efforts with the company's growth and market differentiation initiatives. Prior to joining Datalink, Patricia was Vice President of Global Human Resources at Imation Corporation, where she aligned the company's new strategic vision to organizational programs. Her other experience includes senior human resources positions with Petters Group Worldwide, Polaroid Corporation, Fingerhut, Inc., Net Perceptions, Nellcor Puritan Bennett and First Bank Systems (now U.S. Bancorp). Patricia is chair of the Twin Cities Human Resources Executive Forum, a member of the Society for Human Resource Professionals, serves on the non-profit board for Tubman, and is a past member of the Carlson School International Management Advisory Board.
Denise M. Westenfield became our Vice President, Controller, Chief Accounting Officer and Assistant Secretary in February 2013. She joined Datalink in May 2000 as our Corporate Controller and has served us in that capacity since that time. From 1991 to 2000, Ms. Westenfield was employed by Cummins Inc., in its power generation division, most recently as its business controller. Between 1986 and 1991, Ms. Westenfield served in various accounting and financial management capacities for Honeywell Inc. in its Military Avionics Division.
As indicated in this Annual Report under the caption "Note Regarding Forward-Looking Statements," certain information contained in this Annual Report consists of forward-looking
13
statements. Important factors that could cause actual results to differ materially from the forward-looking statements made in this Annual Report include the following:
Worldwide adverse economic conditions negatively impact our business.
Over the past few years, financial markets in the United States, Europe and Asia have experienced extreme disruption, including, among other things, extreme volatility in security prices, severely diminished liquidity and credit availability, rating downgrades of certain investments and declining valuations of others. We have been impacted by these economic developments in that they continue to adversely affect the ability of our clients and suppliers to obtain financing for significant purchases and operations, and have reduced orders for our products and services. These economic conditions will continue to negatively impact us to the extent our clients defer purchasing decisions, thereby lengthening our sales cycles. In addition, our clients' may have constrained budgets affecting their ability to purchase our products at the same level. Our clients' ability to pay for our products and services may also be impaired, which may lead to an increase in our allowance for doubtful accounts and write-offs of accounts receivable. We are unable to predict the likely duration and severity of the current disruption in financial markets and adverse economic conditions in the U.S. Should these economic conditions result in us not meeting our revenue objectives, our operating results, financial condition and stock price could be adversely affected.
Competition could prevent us from increasing or sustaining our revenues or profitability.
The enterprise-class IT services and solutions market is rapidly evolving and is highly competitive. As technologies change rapidly, we expect that competition will increase in the future. Current economic conditions also place pressure on our competitors to lower their prices and seek opportunities of size and scale different than in the past. We compete with independent IT services and solutions suppliers in the mid to large enterprise market and numerous value-added resellers, distributors and consultants. We also compete in the IT services and solutions market with computer platform suppliers. Many of our current and potential competitors have significantly greater financial, technical, marketing, purchasing and other resources than we do. As a result, they may respond more quickly to changes in economic conditions and client requirements and to new or emerging technologies, devote greater resources to the development, promotion and sale of products and deliver competitive products at lower end-user prices.
Our suppliers are often our competitors. We are not the exclusive reseller of any IT solutions product we offer. Instead, our suppliers market their products through other independent IT solution providers, OEMs, and through their own internal sales forces. We believe direct competition from our suppliers is likely to increase if, as expected, the IT solutions and services industries continue to consolidate and also converge with providers of IT services and solutions technologies. This consolidation would likely result in fewer suppliers with greater resources to devote to internal sales and marketing efforts. In addition, our suppliers have established and will probably continue to establish cooperative relationships with other suppliers and other IT solutions and services providers. These cooperative relationships are often intended to enable our suppliers to offer comprehensive IT solutions and services, which compete with those we offer. If our relationships with our suppliers become adversarial, we could lose the preferred provider status we maintain with certain suppliers. If that were to occur, it would be more difficult for us to stay ahead of industry developments and provide our clients with the type of service and wide range of technology choices they expect from us.
Most of our clients already employ in-house technical staffs. To the extent a client's in-house technical staff develops sophisticated server, storage and networking systems expertise, the client may be less likely to seek our services. Further, we compete with IT service providers who manage, store and backup their clients' data at off-site, networked data storage locations.
14
Mergers or other strategic transactions involving our competitors could weaken our competitive position, which could harm our operating results.
Our industry is highly fragmented, and we believe it is likely that our existing competitors will continue to consolidate or will be acquired. In addition, some of our competitors may enter into new alliances with each other or may establish or strengthen cooperative relationships with systems integrators, third-party consulting firms or other parties. Any such consolidation, acquisition, alliance or cooperative relationship could lead to pricing pressure and our loss of market share and could result in a competitor with greater financial, technical, marketing, service and other resources, all of which could have a material adverse effect on our business, operating results and financial condition.
Our business is dependent on the trend toward outsourcing data center infrastructure-related services.
Our business and growth depend in large part on the industry trend toward outsourced data center infrastructure-related services. Outsourcing means that an entity contracts with a third party, such as us, to provide IT infrastructure-related services such as consulting, implementation, management and support. There can be no assurance that this trend will continue, as organizations may elect to perform such services themselves. A significant change in this trend could have a material adverse effect on our business, financial condition and results of operations. Additionally, there can be no assurance that our cross-selling efforts will cause clients to purchase additional services from us or adopt a single-source outsourcing approach.
Our financial results would suffer if the market for IT services and solutions does not continue to grow.
Our services and solutions are designed to address the growing markets for data center consolidation and virtualization services (including private cloud computing), data center implementation services (including storage and data protection services and the implementation of virtualization solutions), and managed services (including operational support and client support). These markets are still evolving. A reduction in the demand for our services and solutions could be caused by, among other things, lack of client acceptance, weakening economic conditions, competing technologies and services or reductions in corporate spending. Our future financial results would suffer if the market for our IT services and solutions does not continue to grow.
With continued market demand for greater IT efficiency, scalability, and flexibility, we have been increasingly developing and marketing virtual data center and private cloud computing infrastructures and services. If businesses do not find our virtual data center and private cloud computing solutions compelling, our revenue growth and operating margins may decline.
Our IT optimization portfolio is based on the virtualization of storage, computing, and network platforms within on-premises data centers. Our success depends on organizations and clients perceiving technological and operational benefits and cost savings associated with services-oriented, virtual data center and private cloud computing-based infrastructures. Although the use of virtualization technologies on servers has become broadly accepted for enterprise-level applications, the extent to which organizations will adopt virtualization across the data center and migrate to private cloud computing remains uncertain. Accordingly, as the market for our virtual data center and private cloud computing infrastructures matures and the scale of our business increases, the rate of growth in our infrastructure and services sales could be lower than those we have experienced in earlier periods. In addition, to the extent that our newer private cloud computing infrastructure solutions and services are adopted more slowly or less comprehensively than we expect, our revenue growth rates may slow materially or our revenue may decline substantially.
15
If we cannot successfully execute on our strategy to market and deliver new services and solutions, our revenue and gross margin may suffer.
Our long-term strategy is focused on meeting increased client demand for integrated IT solutions and services by leveraging the portfolio of products we offer from leading manufacturers with our own highly customized and innovative services. Our product margins are subject to pricing pressure from our suppliers. In recent years, competition for market share has resulted in increased pricing pressure from these suppliers, reducing the overall profitability of the products we sell. In addition, changes in our product mix, such as the increase in lower-margin networking sales that we have seen in recent years versus higher-margin storage sales, put further pressure on our margins. To offset this decline in product margins, we added or enhanced many of our consulting services offerings in a major investment designed to provide a revenue and profit stream that is not affected by product sales or fulfillment. To successfully execute on this strategy, we need to continue to invest, sell, deliver and expand our services portfolio. Any failure to successfully execute this strategy, including any failure to invest sufficiently in strategic growth areas, could adversely affect our business, results of operation and financial results.
Our acquisition strategy poses substantial risks.
As part of our growth strategy, we made two acquisitions in 2009, one acquisition in October 2011, one acquisition in October 2012, one acquisition in October 2014 and plan to continue to pursue acquisitions in the future. We may not be able to identify suitable acquisition candidates or, if suitable candidates are identified, we may not be able to complete the acquisition on commercially acceptable terms. We may need to raise additional equity to consummate future acquisitions, which may not be feasible, may be on terms we do not consider favorable, would cause dilution to existing investors and could adversely affect our stock price. We also could incur substantial indebtedness in connection with an acquisition, which could decrease the value of our equity. The process of exploring and pursuing acquisition opportunities requires significant management and financial resources, which diverts attention from our core operations.
Integration of acquisitions is very challenging and we cannot assure you that any acquisition will increase our revenues, earnings or stock price. Even if we are able to consummate an acquisition, such as our recent acquisitions, the transaction may present many risks. These risks include, among others: failing to achieve anticipated synergies and revenue increases; difficulty incorporating and integrating the acquired technologies or products with our existing product lines; coordinating, establishing or expanding sales, distribution and marketing functions, as necessary; disruption of our ongoing business and diversion of management's attention to transition or integration issues; unanticipated and unknown liabilities; the loss of key employees, clients, partners and channel partners of our company or of the acquired company; and difficulties implementing and maintaining sufficient controls, policies and procedures over the systems, products and processes of the acquired company. If we do not achieve the anticipated benefits of our acquisitions as rapidly or to the extent anticipated by our management and financial or industry analysts or if others do not perceive the same benefits of the acquisition as we do, there could be a material, adverse effect on our business, financial condition, results of operations or stock price.
Our continued growth could strain our personnel and financial resources and infrastructure, and if we are unable to implement appropriate controls and procedures to manage our growth, we will not be able to implement our business plan successfully.
Due to our recent acquisitions and continued organic growth, we have experienced a period of rapid growth in our headcount and operations. To the extent that we are unable to sustain such growth, it will place a significant strain on our management, administrative, operational and financial infrastructure. Our success will depend in part upon the ability of our senior management to manage
16
this growth effectively. To do so, we must continue to hire, train and manage new employees as needed. If our new hires perform poorly or do not achieve expected or forecasted utilization rates, or if we are unsuccessful in hiring, training, managing and integrating these new employees, or if we are not successful in retaining our existing employees, our future profitability and our business would be harmed. To manage the expected growth of our operations and personnel, we will need to continue to improve our operational, financial and management controls and our reporting systems and procedures. The headcount we are adding will increase our cost base, which will make it more difficult for us to offset any future revenue shortfalls by reducing expenses in the short term. If we fail to successfully manage our growth, we will be unable to execute our business plan.
Our ability to recognize revenue can be adversely affected by product availability.
We sell complex enterprise-class IT solutions and services, which include installation and configuration services. We generally recognize revenues from our sale of hardware and software products when shipment has been completed. We rely on our vendors to supply the hardware and software products we sell. We cannot control the availability and shipment of these products. Delays due to component availability, natural disasters and other unforeseen events can prevent us from recognizing revenue on products we ship and may adversely affect our quarterly reported revenues. As a result, our stock price may decline.
Our key vendors could change or discontinue their incentive programs, which could adversely affect our business.
Several of our key vendors have offered incentive programs to us over the past several years based on our achievement of particular sales levels of their products and early pay discounts. In addition, they have offered margin enhancement programs which provide enhanced discounts for particular products or new client orders. These programs contributed to our profitability in 2015, 2014, and 2013. We cannot assure that these programs will continue or that the sales quotas for our participation will not increase, adversely affecting our ability to take advantage of the incentives. If for any reason, we cannot obtain the same benefits from incentive programs as in the past, it may significantly impact our profitability in the future.
Our data center services and web site may be subject to intentional disruption.
We may be affected by software viruses or similar technology in the future, which could compromise our operations. Further, the systems that we interface with, including the Internet and related systems, may be vulnerable to physical break-ins, hackers, improper employee or contractor access, programming errors, attacks by third parties or similar disruptive problems, resulting in the potential misappropriation of our proprietary information or interruptions of our services. Any compromise of our security, whether as a result of our own systems or systems that they interface with, could substantially disrupt our operations, harm our reputation and reduce demand for our services.
Our failure to protect the integrity and security of our clients' information and access to our clients' information systems could expose us to litigation, materially damage our reputation and harm our business, and the costs of preventing such a failure could adversely affect our results of operations.
Our business involves the collection, processing and storage of our clients' confidential information. This sometimes requires us to receive direct access to our clients' information systems. We cannot be certain that our efforts to protect this confidential information and access will be successful. If any compromise of this information security were to occur, or if we fail to detect and appropriately respond to a significant data security breach, we could be subject to legal claims and government action, experience an adverse effect on our reputation and need to incur significant additional costs to protect against similar information security breaches in the future, each of which could adversely
17
impact our financial condition, results of operations and growth prospects. In addition, because of the critical nature of data security, any perceived breach of our security measures could cause existing or potential clients not to use our solutions and could harm our reputation.
We derive a significant percentage of our revenues from large projects.
We intend to continue to seek out large projects, which means that we expect that a material percentage of our revenues will come from a small number of clients, with the composition of our key clients likely to change from year to year. Failure to sign a sufficient number of large projects in a period can impact our revenues and profitability for that period. Current economic conditions likely will continue to adversely affect the number of and size of large projects available for us. If we fail to obtain a growing number of large projects each year, our revenues and profitability will likely be adversely affected. In addition, our reliance on large projects makes it more likely that our revenues and profits will fluctuate unpredictably from quarter to quarter and year to year. Unpredictable revenue and profit fluctuations may make our stock price more volatile and lead to a decline in our stock price.
Our business depends on our ability to hire and retain technical personnel and highly qualified sales people.
Our future operating results depend upon our ability to attract, retain and motivate qualified engineers and sales people with enterprise-class data storage, server and networking solutions experience. If we fail to recruit and retain additional engineering and sales personnel, or if losses require us in the future to terminate employment of some of these personnel, we will experience greater difficulty realizing our business strategy, which could negatively affect our business, financial condition and stock price.
We generally do not have employment agreements with our employees.
Our future operating results depend in significant part upon the continued contributions of our executive officers, managers, salespeople, engineers and other technical personnel, many of whom have substantial experience in our industry and would be difficult to replace. Except for our President and Chief Executive Officer, Vice President, Finance and Chief Financial Officer and Secretary, Chief Operating Officer, and Executive Vice President, Human Resources, we do not have employment agreements with our employees. Accordingly, our employees may voluntarily leave us at any time and work for our competitors. Our growth strategy depends in part on our ability to retain our current employees and hire new employees. Any failure to retain our key employees will make it much more difficult for us to maintain our operations and attain our growth objectives and could therefore be expected to adversely affect our operating results, financial condition and stock price.
Our long sales cycle may cause fluctuating operating results, which may adversely affect our stock price.
Our sales cycle is typically long and unpredictable, making it difficult to plan our business. Current economic conditions increase this uncertainty. Our long sales cycle requires us to invest resources in potential projects that may not occur. In addition, our long and unpredictable sales cycle may cause us to experience significant fluctuations in our future annual and quarterly operating results. It can also result in delayed revenues, difficulty in matching revenues with expenses and increased expenditures. Our business, operating results or financial condition and stock price may suffer as a result of any of these factors.
18
Our failure to raise additional capital or generate cash flows necessary to expand our operations and invest in new technologies could reduce our ability to compete successfully and adversely affect our results of operations.
We may need to raise additional funds, and we may not be able to obtain additional debt or equity financing on favorable terms, if at all. If we raise additional equity financing, our security holders may experience significant dilution of their ownership interests and the value of shares of our common stock could decline. If we engage in debt financing, we may be required to accept terms that restrict our ability to incur additional indebtedness, force us to maintain specified liquidity or other ratios or restrict our ability to pay dividends or make acquisitions. If we need additional capital and cannot raise it on acceptable terms, we may not be able to, among other things:
- •
- continue to expand our technology development, sales and marketing organizations;
- •
- hire, train and retain employees; or
- •
- respond to competitive pressures or unanticipated working capital requirements.
Our inability to do any of the foregoing could reduce our ability to compete successfully and adversely affect our results of operations.
If the IT solutions industries fail to develop compelling new technologies, our business may suffer.
Rapid and complex technological change, frequent new product introductions and evolving industry standards increase demand for our services. Because of this, our future success depends in part on the IT solutions industry's ability to continue to develop leading-edge IT solutions. Our clients utilize our services in part because they know that newer technologies offer them significant benefits over the older technologies they are using. If the IT solutions industry ceases to develop compelling IT solutions, or if a single IT solutions standard becomes widely accepted and implemented, it will be more difficult to sell new IT solutions to our clients. The continued tightened budgets among established IT solutions manufacturers and the difficulty of raising new capital for innovative start-up companies under current economic conditions may also stifle development of new IT solutions technologies.
We operate a global business that exposes us to additional risks.
As a result of our acquisition of Bear Data in October 2014, we now have operations in Australia, Hong Kong, Singapore and the United Kingdom in addition to the United States and we are seeking to further expand our international operations. As of December 31, 2015, we had sold products into 55 countries. Our international revenues comprised 5.7%, 1.4% and 1.0% of our total net sales for the years ended December 31, 2015, 2014, and 2013, respectively. The future growth and profitability of our international business is subject to a variety of risks and uncertainties. Many of the following factors have adversely affected our international operations and sales to clients located outside of the United States and may again in the future:
- •
- difficulties in staffing and managing foreign operations, particularly in new geographic locations;
- •
- challenges in providing solutions across a significant distance, in different languages and among different cultures;
- •
- rapid changes in government, economic and political policies and conditions, political or civil unrest or instability, terrorism or
epidemics, and other similar outbreaks or events;
- •
- fluctuations in foreign currency exchange rates;
- •
- compliance with and changes in foreign laws and regulations, as well as U.S. laws affecting the activities of U.S. companies abroad, including those associated with export controls, tariffs and embargoes, other trade restrictions and antitrust and data privacy concerns;
19
- •
- seasonal reductions in business activity in certain parts of the world, particularly during the summer months in Europe;
- •
- higher costs of doing business internationally;
- •
- protectionist laws and business practices that favor local producers and service providers;
- •
- taxation;
- •
- restrictions imposed by local labor practices and laws on our business and operations;
- •
- workforce uncertainty in countries where labor unrest is more common than in the United States;
- •
- transportation delays; and
- •
- increased payment risk and higher levels of payment fraud.
A deterioration of global, regional or local political, economic or social conditions could affect potential clients in ways that reduce demand for our solutions and services, disrupt our sales plans and efforts or otherwise negatively impact our business. Acts of terrorism, wars, public health issues and increased energy costs could disrupt commerce in ways that could impair our ability to provide solutions and services to our clients and increase the cost of doing business. We have not undertaken hedging transactions to cover our foreign currency exposure, and changes in foreign currency exchange rates may negatively impact reported revenue and expenses. In addition, a deterioration of political, economic or social conditions in a given country or region could reduce or eliminate our ability to collect accounts receivable in that country or region. In any of these events, our results of operations could be materially and adversely affected.
Conditions in foreign countries and changes in foreign currency exchange rates may significantly reduce our reported results of operations.
We have operations globally. In 2015, approximately 6% of our sales were generated by entities operating outside of the United States. Fluctuations in currencies can cause transaction and translation losses, which can materially and adversely impact our results of operations, as well as our revenue and net income expressed on a U.S. dollar basis. The volatility of exchange rates depends on many factors that we cannot forecast with reliable accuracy and we currently engage in very limited foreign currency translation hedging and risk management activities. If we continue to engage in these efforts in the future, there is no assurance we would be effective at properly mitigating risk at a reasonable cost.
Control by our existing shareholders could discourage the potential acquisition of our business.
Currently, our executive officers and directors beneficially own approximately 11.4% of our outstanding common stock. Acting together, these insiders may be able to significantly impact the election of our Board of Directors and may have a significant impact on the outcome of all other matters requiring shareholder approval. This voting concentration may also have the effect of delaying or preventing a change in our management or otherwise discourage potential acquirers from attempting to gain control of us. If potential acquirers are deterred, you may lose an opportunity to profit from a possible acquisition premium in our stock price.
Our stock price is volatile.
The market price of our common stock fluctuates significantly, and, especially in light of current stock market and worldwide economic conditions, may continue to be volatile. We cannot assure you
20
that our stock price will increase, or even that it will not decline significantly from the price you pay. Our stock price may be adversely affected by many factors, including, but not limited to:
- •
- actual or anticipated fluctuations in our operating results, including those resulting from changes in accounting rules;
- •
- general market conditions, including the effects of current economic conditions;
- •
- announcements of technical innovations;
- •
- new products or services offered by us, our suppliers or our competitors;
- •
- changes in estimates by securities analysts of our future financial performance;
- •
- our compliance with SEC and NASDAQ rules and regulations, including the Sarbanes-Oxley Act of 2002;
- •
- the timing of stock sales under 10b5-1 plans or otherwise; and
- •
- war and terrorism threats.
Our quarterly results of operations may fluctuate in the future, which could result in volatility in our stock price.
Our quarterly revenues and results of operations have varied in the past and may fluctuate as a result of a variety of factors, including the success of our new offerings. If our quarterly revenues or results of operations fluctuate, the price of our common stock could decline substantially. Fluctuations in our results of operations may be due to a number of factors, including, but not limited to, those listed below and identified throughout this "Risk Factors" section:
- •
- our ability to retain and increase sales to clients and attract new clients;
- •
- the timing and success of introductions of new solutions or upgrades by us or our competitors;
- •
- the strength of the economy;
- •
- changes in our pricing policies or those of our competitors;
- •
- competition, including entry into the industry by new competitors and new offerings by existing competitors;
- •
- the amount and timing of our expenses, including stock-based compensation and expenditures related to expanding our operations,
supporting new clients or introducing new solutions; and
- •
- changes in the payment terms for our solutions.
We do not intend to declare dividends on our stock in the foreseeable future.
We currently intend to retain all future earnings for the operation and expansion of our business and, therefore, do not anticipate declaring or paying cash dividends on our common stock in the foreseeable future. Any payment of cash dividends on our common stock will be at the discretion of our board of directors and will depend upon our results of operations, earnings, capital requirements, financial condition, future prospects, contractual restrictions and other factors deemed relevant by our board of directors. Therefore, you should not expect to receive dividend income from shares of our common stock.
Our governing documents and Minnesota law may discourage the potential acquisitions of our business.
Our Board of Directors may issue additional shares of capital stock and establish their rights, preferences and classes, in some cases without shareholder approval. In addition, we are subject to
21
anti-takeover provisions of Minnesota law. These provisions may deter or discourage takeover attempts and other changes in control of us without approval from our Board of Directors. If potential acquirers are deterred, you may lose an opportunity to profit from a possible acquisition premium in our stock price.
If our goodwill or amortizable intangible assets become impaired, we may be required to record a significant charge to earnings.
We have recorded a significant amount of goodwill and other intangible assets related to our acquisitions to date, and a significant portion of the purchase price of any companies we acquire in the future may be allocated to acquired goodwill and other intangible assets. We may not realize all the economic benefit from those acquisitions, which could cause an impairment of goodwill or intangibles. We review our amortizable intangible assets for impairment when events or changes in circumstances indicate that the carrying value may not be recoverable. We test goodwill for impairment at least annually. Factors that may constitute a change in circumstances, indicating that the carrying value of our goodwill or amortizable intangible assets may not be recoverable, include a decline in our stock price and market capitalization, reduced future cash flow estimates, and slower growth rates in industry segments in which we participate. We may be required to record a significant charge in our consolidated financial statements during the period in which any impairment of our goodwill or amortizable intangible assets is determined, which would negatively affect our results of operations.
Item 1B. Unresolved Staff Comments.
None.
Our corporate headquarters consist of approximately 54,000 square feet of office space. The terms of our lease extend through August 31, 2019 and we have the option to extend the lease for an additional five-year term as long as certain conditions are met.
As a result of our acquisition of StraTech in October 2012, we were the successor in interest to six leases where StraTech was the tenant. These facilities provided us with approximately 27,000 additional square feet of office space available for our operations in Georgia, Alabama, Florida, Maryland, North Carolina, and Tennessee.
As a result of our acquisition of Bear Data in October 2014, we were the successor in interest to seven leases where Bear Data was the tenant, with terms extending through December 2018. These facilities provided us with approximately 20,000 additional square feet of office space available for our operations in California and Nevada. As of December 31, 2015, we are still successor to five of these seven leases with terms extending through December 2018.
As of December 31, 2015, our other 30 leased locations (which house sales and technical staffs) were small to medium-sized offices throughout the United States with terms ending through 2023. Based on our present plans, we believe our current facilities will be adequate to meet our anticipated needs for at least the remaining terms of our respective leases.
From time to time, we have been named as a defendant in legal actions arising from our normal business activities, none of which has had a material effect on our business, results of operations or financial condition. We believe that we have obtained adequate insurance coverage or rights to indemnification in connection with potential legal proceedings that may arise.
Item 4. Mine Safety Disclosures.
Not applicable.
22
Item 5. Market for Registrant's Common Equity, Related Stockholder Matters and Issuer Purchases of Equity Securities.
Our common stock is quoted on the NASDAQ Global Market under the symbol "DTLK". The table below sets forth, for the calendar quarters indicated, the high and low per share closing sale prices of our common stock as reported by the NASDAQ Global Market.
| |
High | Low | |||||
|---|---|---|---|---|---|---|---|
Year Ended December 31, 2015 |
|||||||
First Quarter |
$ | 12.97 | $ | 11.36 | |||
Second Quarter |
12.39 | 8.94 | |||||
Third Quarter |
8.48 | 5.34 | |||||
Fourth Quarter |
7.86 | 5.70 | |||||
Year Ended December 31, 2014 |
|||||||
First Quarter |
$ | 15.64 | $ | 10.62 | |||
Second Quarter |
13.93 | 8.80 | |||||
Third Quarter |
12.44 | 9.36 | |||||
Fourth Quarter |
13.60 | 10.03 | |||||
On March 7, 2016, the closing price per share of our common stock was $7.86. We urge potential investors to obtain current market quotations before making any decision to invest in our common stock. On March 7, 2016, there were approximately 180 holders of common stock, including record holders. However, we estimate that our shares are held by over 4,000 beneficial owners.
We have paid no dividends on our common stock since our initial public offering in 1999. We intend to retain future earnings for use in our business, and we do not anticipate paying any cash dividends on our common stock in the foreseeable future.
On September 14, 2015, our board of directors approved a new stock repurchase program authorizing the repurchase of shares of our common stock in the open market or in privately negotiated purchases, or both, at an aggregate purchase price of up to $10 million. The timing and amount of any share repurchases will be determined by our management based on market conditions and other factors. The share repurchase program is expected to be completed by December 31, 2016. Under this program, we may from time to time purchase our outstanding common stock in the open market at management's discretion, subject to share price, market conditions and other factors. The common stock repurchase program does not obligate us to repurchase any dollar amount or number of shares. Common stock repurchase activity during the three and twelve months ended December 31, 2015 was as follows:
Period
|
Total Number of Shares Purchased |
Average Price Paid Per Share |
Total Number of Shares Purchased as Part of Publicly Announced Plans or Programs |
Maximum Dollar Value of Shares That May Yet Be Purchased Under the Plans or Programs |
|||||||||
|---|---|---|---|---|---|---|---|---|---|---|---|---|---|
September 1-September 30, 2015 |
29,000 | $ | 6.00 | 29,000 | $ | 9,825,948 | |||||||
October 1-October 31, 2015 |
141,350 | $ | 7.44 | 141,350 | $ | 8,774,291 | |||||||
November 1-November 30, 2015 |
458,650 | $ | 7.83 | 458,650 | $ | 5,182,833 | |||||||
December 1-December 31, 2015 |
— | — | — | — | |||||||||
You can find additional information about our equity compensation plans in Part III, Item 11 of this Annual Report.
23
Stock Performance Graph
The graph below shows a comparison for the period commencing on December 31, 2010 and ending on December 31, 2015 of the annual percentage change in the cumulative total shareholder return for our common stock, assuming the investment of $100.00 on December 31, 2010, with the cumulative total shareholder returns for the NASDAQ Composite Index and the Russell 2000 Index, assuming the investment of $100.00 on December 31, 2010. The shareholder returns over the indicated periods below are weighted based on market capitalization at the beginning of each measurement point and are not indicative of, or intended to forecast, future performance of our common stock. Data for the NASDAQ Composite Index and the Russell 2000 Index assumes reinvestment of dividends. We have never declared or paid dividends on our common stock and have no present plans to do so.
COMPARISON OF 5 YEAR CUMULATIVE TOTAL RETURN
Datalink Corporation, The NASDAQ Composite Index
And The Russell 2000 Index
COMPARISON OF 5 YEAR CUMULATIVE TOTAL RETURN*
Among Datalink Corporation, the NASDAQ Composite lndex, and the Russell 2000 lndex
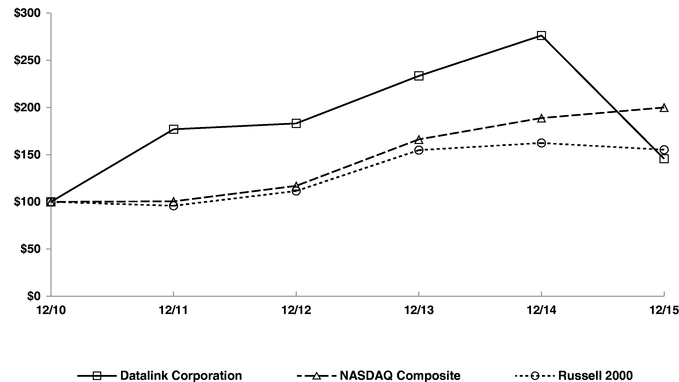
- *
- $100
invested on 12/31/10 in stock or index, including reinvestment of dividends.
Fiscal year ending December 31.
Copyright© 2016 Russell lnvestment Group. All rights reserved.
| |
12/31/10 | 12/31/11 | 12/31/12 | 12/31/13 | 12/31/14 | 12/31/15 | |||||||||||||
|---|---|---|---|---|---|---|---|---|---|---|---|---|---|---|---|---|---|---|---|
Datalink Corporation |
100.00 | 176.87 | 183.08 | 233.40 | 276.23 | 145.61 | |||||||||||||
NASDAQ Composite |
100.00 | 100.53 | 116.92 | 166.19 | 188.78 | 199.95 | |||||||||||||
Russell 2000 Index |
100.00 | 95.82 | 111.49 | 154.78 | 162.35 | 155.18 | |||||||||||||
24
Item 6. Selected Financial Data.
You should read the information below with our "Management's Discussion and Analysis of Financial Condition and Results of Operations" and our financial statements. The statement of operations data for the years ended December 31, 2015, 2014, and 2013 and the balance sheet data as of December 31, 2015 and 2014 are derived from our audited financial statements included in this Annual Report. The statement of operations data for the years ended December 31, 2012 and 2011 and the balance sheet data as of December 31, 2013, 2012, and 2011 are derived from our audited financial statements not included in this Annual Report. We acquired Bear Data in October 2014, StraTech in October 2012, and Midwave in October 2011. They are included in our financial statements beginning on those dates.
| |
Year ended December 31, | |||||||||||||||
|---|---|---|---|---|---|---|---|---|---|---|---|---|---|---|---|---|
| |
2015 | 2014 | 2013 | 2012 | 2011 | |||||||||||
| |
(in thousands, except per share data) |
|||||||||||||||
Statement of Operations Data: |
||||||||||||||||
Net sales: |
||||||||||||||||
Product sales |
$ | 469,111 | $ | 380,631 | $ | 373,008 | $ | 319,041 | $ | 245,743 | ||||||
Service sales |
295,654 | 249,605 | 221,176 | 172,161 | 134,284 | |||||||||||
| | | | | | | | | | | | | | | | | |
Total net sales |
764,765 | 630,236 | 594,184 | 491,202 | 380,027 | |||||||||||
| | | | | | | | | | | | | | | | | |
Cost of sales: |
||||||||||||||||
Cost of product sales |
385,624 | 300,852 | 291,671 | 248,286 | 188,384 | |||||||||||
Cost of services |
235,711 | 192,557 | 168,655 | 130,890 | 100,978 | |||||||||||
Amortization of intangibles |
— | — | — | — | 1,053 | |||||||||||
| | | | | | | | | | | | | | | | | |
Total cost of sales |
621,335 | 493,409 | 460,326 | 379,176 | 290,415 | |||||||||||
| | | | | | | | | | | | | | | | | |
Gross profit |
143,430 | 136,827 | 133,858 | 112,026 | 89,612 | |||||||||||
| | | | | | | | | | | | | | | | | |
Operating expenses: |
||||||||||||||||
Sales and marketing |
69,141 | 61,877 | 60,842 | 48,553 | 38,723 | |||||||||||
General and administrative |
25,784 | 22,271 | 20,729 | 18,227 | 15,468 | |||||||||||
Engineering |
31,104 | 29,128 | 27,536 | 22,974 | 17,535 | |||||||||||
Other income(3) |
— | — | — | — | (1,127 | ) | ||||||||||
Integration and transaction costs(1)(2) |
1,000 | 626 | 95 | 359 | 454 | |||||||||||
Amortization of finite-lived intangibles(1)(2) |
7,347 | 6,428 | 7,251 | 4,195 | 1,766 | |||||||||||
| | | | | | | | | | | | | | | | | |
Total operating expenses |
134,376 | 120,330 | 116,453 | 94,308 | 72,819 | |||||||||||
| | | | | | | | | | | | | | | | | |
Earnings from operations |
9,054 | 16,497 | 17,405 | 17,718 | 16,793 | |||||||||||
Gain (loss) on settlement related to StraTech acquisition |
— | 877 | (611 | ) | — | — | ||||||||||
Interest income |
434 | 90 | 264 | 59 | 50 | |||||||||||
Interest expense |
(263 | ) | (270 | ) | (175 | ) | (56 | ) | (40 | ) | ||||||
Other income (expense), net |
(242 | ) | 184 | (196 | ) | — | — | |||||||||
| | | | | | | | | | | | | | | | | |
Earnings before income taxes |
8,983 | 17,378 | 16,687 | 17,721 | 16,803 | |||||||||||
Income tax expense |
4,284 | 6,297 | 6,642 | 7,186 | 6,958 | |||||||||||
| | | | | | | | | | | | | | | | | |
Net earnings |
$ | 4,699 | $ | 11,081 | $ | 10,045 | $ | 10,535 | $ | 9,845 | ||||||
| | | | | | | | | | | | | | | | | |
| | | | | | | | | | | | | | | | | |
| | | | | | | | | | | | | | | | | |
Net earnings per common share: |
||||||||||||||||
Basic |
$ | 0.21 | $ | 0.51 | $ | 0.53 | $ | 0.62 | $ | 0.62 | ||||||
Diluted |
$ | 0.21 | $ | 0.50 | $ | 0.52 | $ | 0.60 | $ | 0.61 | ||||||
Weighted average shares outstanding: |
||||||||||||||||
Basic |
21,941 | 21,598 | 19,078 | 17,114 | 15,803 | |||||||||||
Diluted |
22,364 | 22,039 | 19,493 | 17,595 | 16,213 | |||||||||||
25
| |
As of December 31, | |||||||||||||||
|---|---|---|---|---|---|---|---|---|---|---|---|---|---|---|---|---|
| |
2015 | 2014 | 2013 | 2012 | 2011 | |||||||||||
| |
(In thousands) |
|||||||||||||||
Selected Balance Sheet Data: |
||||||||||||||||
Cash and investments |
$ | 59,976 | $ | 50,719 | $ | 76,085 | $ | 10,315 | $ | 22,433 | ||||||
Working capital |
102,372 | 94,673 | 91,720 | 34,059 | 37,881 | |||||||||||
Total assets |
521,797 | 504,009 | 433,108 | 370,393 | 277,951 | |||||||||||
Stockholders' equity |
164,768 | 160,686 | 145,796 | 95,383 | 80,185 | |||||||||||
- (1)
- In
October 2012, we acquired StraTech. Therefore its results of operations are only included from the acquisition date forward. We recorded finite-lived
intangibles consisting of $15.9 million of customer relationships, which is amortized over its estimated life of five years. In 2013 and 2012, we incurred integration costs of $95,000 and
$359,000, respectively, in conjunction with the acquisition of StraTech.
- (2)
- In
October 2014, we acquired Bear Data. Therefore its results of operations are only included from the acquisition date forward. The finite-lived intangible
assets we acquired in the Bear Data acquisition consisted of $370,000 of covenants not to compete, $890,000 of trademarks, $7.8 million of customer relationships and $452,200 of order backlog
having estimated lives of three years, three years, six years and three months, respectively. In 2014 and 2015, we incurred integration costs of $626,000 and $1.0 million, respectively, in
conjunction with the acquisition of Bear Data.
- (3)
- In conjunction with our Cross acquisition, we entered into a reverse earn-out agreement, which required Cross to purchase at least $1.8 million of networking products and services from us over three years. Cross agreed to pay any shortfall between customer purchases and the guaranteed annual purchase amount. In September 2011, the second year of the three year reverse earn-out agreement came to an end and there was a shortfall paid by Cross of $574,000 which was recorded as other income since we had assumed that the revenue targets would be met and the reverse earn-out had no fair value. In October 2011, we entered into an agreement with Cross to allow for an early buyout of the third year reverse earn-out agreement for which Cross paid $553,000.
26
Item 7. Management's Discussion and Analysis of Financial Condition and Results of Operations.
You should read the following discussion in conjunction with our financial statements and the related notes included in Item 8 of this Annual Report. The following information includes forward-looking statements, the realization of which may be affected by certain important factors discussed under "Risk Factors."
Overview
We provide IT solutions and services that help organizations transform technology, operations and service delivery to meet business challenges. Focused on midsize and large companies, we provide a full life cycle of services including consulting, strategy, design, deploy, manage, and support. We leverage technology from the industry's leading OEMs as part of our IT solutions portfolio. Our portfolio of solutions and services spans four areas: cloud, data center transformation, next-generation technology and security. We offer a full suite of practice-specific consulting, analysis, design, implementation, management, and support services.
Our solutions can include hardware products, such as servers, disk arrays, tape systems, networking and interconnection components and software products. Our data center strategy is supported through multiple trends in the market and involves supporting the market and our clients with a single vendor to provide their data center infrastructure needs. As of December 31, 2015, we had 39 locations, including both leased facilities and home offices, throughout the United States. Our sales are to our clients in the United States. Some of these clients have global operations to which we provide IT solutions. In 2015, 2014 and 2013, respectively, 5.7%, 1.4% and 1.0% of our sales were to international locations.
We sell support service contracts to most of our clients. In about half of the support service contracts that we sell, our clients purchase support services through us, resulting in clients receiving the benefit of integrated system-wide support. We have a qualified, independent support desk that takes calls from clients, diagnoses the issues they are facing and either solves the problem or coordinates with our and/or vendor technical staff to meet the client's needs. Our support service agreements with our clients include an underlying agreement with the product manufacturer. The manufacturer provides on-site support assistance if necessary. The other half of the support service contracts that we sell to our clients are direct with the product manufacturers. For all support service contracts we sell, we defer revenues and direct costs resulting from these contracts, and amortize these revenues and expenses into operations, over the term of the contracts, which are generally one to three years.
The IT solutions and services market is rapidly evolving and highly competitive. Our competition includes other independent storage, server and networking system integrators, high-end value-added resellers, distributors, consultants and the internal sales force of our suppliers. Our ability to hire and retain qualified outside sales representatives and engineers with enterprise-class information storage, server and networking experience is critical to effectively competing in the marketplace and achieving our growth strategies.
In the past, we have experienced fluctuations in the timing of orders from our clients, and we expect to continue to experience these fluctuations in the future. These fluctuations have resulted from, among other things, the time required to design, test and evaluate our data center infrastructure solutions before clients deploy them, the size of client orders, the complexity of our clients' network environments, necessary system configuration to deploy our solutions and new product introductions by suppliers. Current economic conditions and competition also affect our clients' decisions and timing to place orders with us and the size of those orders. As a result, our net sales may fluctuate from quarter to quarter.
27
We view the IT solutions and services market as providing significant opportunity for growth. Currently, our market share is a small part of the overall market. However, the providers of the IT technologies are increasing their utilization of indirect sales approaches to broaden their reach and optimize their margins. Increasingly, they are turning to companies such as us to sell their products. While these trends provide opportunity for us, we must improve our business model to generate sustainable, profitable growth. Our model requires highly skilled sales and technical staff which results in substantial fixed costs for us. We believe the best way to improve our company and create long-term shareholder value is to focus on building scalable capabilities and a leverageable cost structure. Our current strategies are focused on:
- •
- Increasing our sales team productivity.
- •
- Scaling our existing geographic locations and expanding into new locations.
- •
- Expanding our customer support revenues.
- •
- Expanding our consulting and professional services business.
- •
- Expanding our managed services portfolios.
To pursue these strategies, we are:
- •
- Improving our training, tools and recruiting efforts for sales and technical teams to increase productivity.
- •
- Investing in client-facing teams to acquire top tier sales and technical talent which we believe will increase our market share in key
locations.
- •
- Deepening our presence in existing enterprise accounts and penetrating new enterprise accounts.
- •
- Exploring potential acquisitions that we believe can strengthen our resources and capabilities in key geographic locations.
- •
- Targeting high growth market segments and deploying new technologies which focus on cost saving technologies for our clients.
- •
- Driving high levels of efficiency by streamlining our supply chain and expanding our professional services tools.
- •
- Expanding our client support capabilities and tools-based professional services offerings that we believe will provide more value to
our clients.
- •
- Making significant investments in our Consulting Services portfolio and building a team to deliver those services to create a high-margin, product-independent revenue stream for the future.
All of these plans have various challenges and risks associated with them, including those described under "Risk Factors" in this Annual Report.
Acquisitions
We have completed acquisitions to grow our business in the past and we intend to continue to grow our business by select acquisitions. Our recent acquisitions are described below.
Bear Data Solutions, Inc. On October 18, 2014, we entered into an Agreement and Plan of Merger (the "Merger Agreement") with Bear Data. Bear Data is primarily an IT services firm, serving California-based and international clients from offices in San Francisco, San Jose, Irvine and San Diego. A significant portion of its revenues is derived from networking products including Cisco wireless, routing and core switches. The aggregate purchase price for the overall transaction was
28
approximately $13.4 million, including a cash payment of $12.7 million, net of cash acquired, in connection with the merger (the "Preliminary Purchase Price"), which was partially offset by a net working capital receivable from the sellers of $741,000 resulting from the preliminary estimated net tangible asset adjustment as defined by the Merger Agreement. The Preliminary Purchase Price was subject to certain adjustments to reflect the difference, if any, between the net working capital at closing and target net working capital. An aggregate amount of $2.4 million of the Preliminary Purchase Price was placed into escrow to cover any post-closing adjustment to the Preliminary Purchase Price and indemnification obligations of the securityholders. Pursuant to the Merger Agreement, the sellers of Bear Data were obligated to pay us an amount equal to the difference between the actual net tangible assets on the closing date and the sellers' good faith estimate of net tangible assets as set forth in the Merger Agreement. In January 2016, we served a notice of claim for indemnification to recover approximately $798,000 in losses for accounts receivable, accounts payable and taxes against the indemnity escrow fund. Resolution between us and the sellers of Bear Data is ongoing.
We entered into a Common Stock Purchase Agreement (the "Common Stock Purchase Agreement"), also dated as of October 18, 2014, by and among Datalink Corporation, Merger Sub, and three executive securityholders of Bear Data. Under the Common Stock Purchase Agreement, we issued 156,360 shares of our common stock with a value of approximately $1.5 million, net of illiquidity adjustments, to the three Bear Data executives. The $13.4 million aggregate purchase price for the overall transaction discussed above includes the $1.5 million issuance of shares to the executive securityholders of Bear Data. For this purpose, our common stock was valued at the volume-weighted average of the per share trading prices of its common stock as reported through Bloomberg (based on all trades in our common stock and not an average of daily averages) for the 20 consecutive full trading days ending one business day prior to closing. These shares had an aggregate value of $1.7 million, offset by a $192,000 illiquidity adjustment. 75% of the shares issued under the Common Stock Purchase Agreement were not transferable until the first anniversary of closing.
Under the acquisition method of accounting, we estimated the fair value of the assets acquired and liabilities assumed of Bear Data primarily using a discounted cash flow approach with respect to identified intangible assets and goodwill. We based this approach upon its estimates of future cash flows from the acquired assets and liabilities and utilized a discount rate consistent with the inherent risk associated with the acquired assets and liabilities assumed. As of December 31, 2014, the fair value of the acquired assets was provisional as we had not yet finalized net working capital adjustments. The total purchase price was allocated to Bear Data's net tangible and identifiable assets based on their estimated fair values as of October 18, 2014. Adjustments to provisional amounts during the measurement period that were the result of information that existed as of the acquisition date require the revision of comparative prior period financial information when reissued in subsequent financial statements. Accordingly, our 2014 consolidated balance sheet has been retroactively adjusted to account for those changes.
Bear Data filed its final stub period federal and state income tax returns for 2014 during the three months ended September 30, 2015. The final stub period returns reported taxable losses, which have been carried back to the full extent possible. As a result, we recorded a $916,000 reduction in goodwill and increase in net deferred tax assets. The changes did not impact our consolidated statements of operations.
The acquisition of San Francisco-based Bear Data significantly increased our West Coast revenue base, expanded our Cisco expertise into strategically important new areas, and added more than 1,000 new midmarket and enterprise clients to whom we can market our comprehensive portfolio of data center offerings. It also increased our international sales. Our international sales comprised 5.7%, 1.4% and 1.0% of our total net sales for the years ended December 31, 2015, 2014, and 2013, respectively. Our results for 2014 and 2015 reflect the addition of Bear Data for the fourth quarter of 2014. Please see Note 2 to our financial statements for further information.
29
Strategic Technologies, Inc. On October 4, 2012, we purchased substantially all of the assets and liabilities of Strategic Technologies, Inc. ("StraTech") from StraTech and Midas Medici Group Holdings, Inc. StraTech is an IT services and solutions firm that shares our focus on optimizing enterprise data centers and IT infrastructure through a common product and services portfolio designed to help clients increase business agility.
This acquisition expanded our market share and physical presence across the Eastern seaboard of the United States. It also allowed us to diversify our product offerings from certain manufacturers and expand our high-margin professional and managed services business lines. We have experienced operational synergies and efficiencies through combined general and administrative corporate functions. Our results for 2015, 2014 and 2013 reflect the addition of StraTech for the fourth quarter of 2012. Please see Note 2 to our financial statements for further information.
Critical Accounting Policies and Estimates
The preparation of financial statements requires us to make estimates and assumptions that affect reported earnings. We evaluate these estimates and assumptions on an on-going basis based on historical experience and on other factors that we believe are reasonable. Estimates and assumptions include, but are not limited to, the areas of customer receivables, inventories, investments, income taxes, self-insurance reserves and commitments and contingencies. We believe that the following represent the areas where we use more critical estimates and assumptions in the preparation of our financial statements:
Revenue Recognition. We generally recognize software and hardware revenue upon shipment, installation and configuration services upon completion and customer support contracts ratably over the term of the contract. In late 2013, we began recognizing revenue on certain new professional service contracts that include milestones using a proportional performance method of revenue recognition. Revenues from these fixed price professional service contracts are recognized as services are performed based on the achievement of specified milestones within the contracts and when the client acknowledges that such criteria have been satisfied. We invoice our client on these projects as agreed-upon project milestones are achieved and accepted by the client. Please see Note 1 to our financial statements in Part II, Item 8 of this Annual Report for a more detailed description of our revenue recognition policy.
Business Combinations. We have acquired a number of businesses during the last several years, and we expect to acquire additional businesses in the future. In a business combination, we determine the fair value of all acquired assets, including identifiable intangible assets, and all assumed liabilities. We allocate the fair value of the purchase price to the acquired assets and assumed liabilities in amounts equal to the fair value of each asset and liability. We classify any remaining fair value of the acquisition as goodwill. This allocation process requires extensive use of estimates and assumptions, including estimates of future cash flows we expect to generate with the acquired assets. We amortize certain identifiable, finite-lived intangible assets, such as service agreements, certifications, trademarks, and order backlog, on a straight-line basis over the intangible asset's estimated useful life. We amortize customer relationships using an accelerated amortization method, to match the pattern in which the economic benefits of that asset are expected to be consumed. The estimated useful life of amortizable identifiable intangible assets ranges from three months to eight years. We do not amortize goodwill or other intangible assets we determine to have indefinite lives. Accordingly, the accounting for acquisitions has had, and will continue to have, a significant impact on our operating results.
During 2014 and 2012, we applied business combination accounting to our acquisitions of Bear Data and StraTech. See Note 2 to our financial statements in Part II, Item 8 of this Annual Report for more information about the application of business combination accounting to these acquisitions.
30
Valuation of Goodwill. In accordance with Financial Accounting Standards Board Accounting Standards Codification (FASB ASC) Topic 350, Intangibles—Goodwill and Other, we assess the carrying amount of our goodwill for potential impairment annually or more frequently if events or a change in circumstances indicate that impairment may have occurred. We have only one operating and reporting unit that earns revenues, incurs expenses and makes available discrete financial information for review by our chief operating decision-maker. Accordingly, we complete our goodwill impairment testing on this single reporting unit.
Testing for goodwill impairment is a two-step process. The first step screens for potential impairment. If there is an indication of possible impairment, we must complete the second step to measure the amount of impairment loss, if any. The first step of the goodwill impairment test, used to identify potential impairment, compares the fair value of our reporting unit (our company as a whole) with the carrying value of our net assets. If fair value is below the carrying value of our net assets, we perform the second step of the goodwill impairment test to measure the amount of impairment loss we record, if any. For the second step of the goodwill impairment test we look at factors including market consideration and control premiums (which is the difference between the fair value determined based on market capitalization plus an appropriate control premium at the impairment testing date). We consider goodwill impairment test estimates critical due to the amount of goodwill recorded on our balance sheets and the judgment required in determining fair value amounts.
Valuation of Long-Lived Assets, Including Finite-Lived Intangibles. In accordance with FASB ASC Topic 360, Property, Plant, and Equipment, we perform an impairment test for finite-lived intangible assets and other long-lived assets, such as property and equipment, whenever events or changes in circumstances indicate that we may not recover the carrying value of such assets.
Stock-Based Compensation. We utilize the fair value method of accounting to account for share-based compensation awards. This requires us to measure and recognize in our statements of operations the expense associated with all share-based payment awards made to employees and directors based on estimated fair values. We use the Black-Scholes model to determine the fair value of share-based payment awards. Our stock price, as well as assumptions regarding a number of highly complex and subjective variables, will affect our determination of fair value. We determine the fair value of restricted stock grants based upon the closing price of our stock on the grant date. We base recognition of compensation expense for our performance-based, non-vested shares on management's estimate of the probable outcome of the performance condition. Management reassesses the probability of meeting these performance conditions on a quarterly basis. Changes in management's estimate of meeting these performance conditions may result in significant fluctuations in compensation expense from period to period.
Recent Accounting Pronouncements
In February 2016, the FASB issued Accounting Standards Update 2016-02, Leases (Topic 842), which is the final standard on the accounting for leases. ASU 2016-02 was issued in three parts: (a) Section A, "Leases: Amendments to the FASB Accounting Standards Codification®," Section B, "Conforming Amendments Related to Leases: Amendments to the FASB Accounting Standards Codification®," and Section C, "Background Information and Basis for Conclusions." While both lessees and lessors are affected by the new guidance, the effects on lessees are much more significant. The most significant change for lessees is the requirement under the new guidance to recognize right-of-use assets and lease liabilities for all leases not considered short-term leases. By definition, a short-term lease is one in which: (a) the lease term is 12 months or less and (b) there is not an option to purchase the underlying asset that the lessee is reasonably certain to exercise. For short-term leases, lessees may elect an accounting policy by class of underlying asset under which right-of-use assets and lease liabilities are not recognized and lease payments are generally recognized as expense over the lease term on a straight-line basis. This change will result in lessees recognizing right-of-use assets and lease
31
liabilities for most leases currently accounted for as operating leases under the legacy lease accounting guidance. For many entities, this could significantly affect the financial ratios they use for external reporting and other purposes, such as debt covenant compliance. The ASU is not effective until 2019 for calendar year public business entities and 2020 for all other calendar year entities. We are currently determining our implementation approach for this standard and assessing the impact it may have on our consolidated financial statements.
In January 2016, the FASB issued Accounting Standards Update 2016-01, Financial Instruments—Overall (Subtopic 825-10): Recognition and Measurement of Financial Assets and Financial Liabilities, which is the final standard on the recognition and measurement of financial instruments. The ASU applies to all entities that hold financial assets or owe financial liabilities and represents the finalization of just one component of the FASB's broader financial instruments project. The most far-reaching ramification of the ASU is the elimination of the available-for-sale classification for equity securities and a new requirement to carry those equity securities with readily determinable fair values at fair value through net income. Other notable changes brought about by the ASU involve: (a) applying a practicability exception from fair value accounting to equity securities that do not have a readily determinable fair value, (b) assessing the need for a valuation allowance for a deferred tax asset related to an available-for-sale debt security, (c) applying the fair value option to liabilities and the treatment of changes in fair value attributable to instrument-specific credit risk and (d) adding disclosures and eliminating certain disclosures. The ASU is not effective until 2018 for calendar year public business entities, certain provisions can be early adopted by public business entities in financial statements that have not been issued, and by other entities, in financial statements that have not been made available for issuance. We are currently determining our implementation approach for this standard and assessing the impact it may have on our consolidated financial statements.
In November 2015, the FASB issued Accounting Standards Update 2015-17, Balance Sheet Classification of Deferred Taxes, which simplifies the presentation of deferred tax assets. The updated guidance requires that deferred tax assets and liabilities be classified as noncurrent in a classified balance sheet. The effective date for the standard is for fiscal year and interim periods within those years beginning after December 15, 2016. Early adoption is permitted and the ASU allows for either retrospective or prospective application. We early adopted the ASU in the fourth quarter of 2015 with retrospective application and prior period amounts were reclassified. For 2014, our long term deferred tax asset of $6.9 million has been netted with our current deferred tax liability of $2.3 million for a net deferred tax asset of $4.6 million.
In September 2015, the FASB issued Accounting Standards Update 2015-16, Accounting for Measurement Period Adjustments in a Business Combination ("ASU 2015-16"), which requires that an acquirer recognize adjustments to provisional amounts that are identified during the measurement period in the reporting period in which the adjustment amounts are determined. ASU 2015-16 will be effective for annual and interim reporting periods beginning after December 15, 2015, although early adoption is permitted. We do not expect that the adoption of ASU 2015-16 will have a significant impact on our consolidated financial statements.
In July 2015, the FASB issued Accounting Standards Update 2015-11, Simplifying the Measurement of Inventory, which simplifies the subsequent measurement of inventory by replacing the lower of cost or market test with a lower of cost or net realizable value (NRV) test. NRV is calculated as the estimated selling price less reasonably predictable costs of completion, disposal and transportation. This pronouncement is effective for fiscal years and for interim periods within those fiscal years beginning after December 15, 2016, and prospective adoption is required. We currently do not anticipate the adoption of this standard will have a material impact on our consolidated financial statements.
In July 2015, the FASB deferred the effective date of guidance that was originally issued in May 2014 in Accounting Standards Update 2014-09, Revenue from Contracts with Customers
32
("ASU 2014-09"). The standard outlines a single comprehensive model for entities to use in accounting for revenue arising from contracts with customers and supersedes most current revenue recognition guidance. ASU 2014-09 is intended to provide a more robust framework for addressing revenue issues; improve comparability of revenue recognition practices across entities, industries, jurisdictions and capital markets; and provide more useful information to users of financial statements through improved revenue disclosure requirements. The provisions of ASU 2014-09 will now be effective for interim and annual periods beginning after December 15, 2017. We are currently determining our implementation approach for this standard and assessing the impact it may have on our consolidated financial statements.
In June 2015, the FASB issued Accounting Standards Update 2015-10, "Technical Corrections and Improvements," which makes minor amendments to the FASB Accounting Standards Codification. The technical corrections are divided into four main categories: amendments to align codification wording with that in the pre-codification standards; corrections to references and clarification of guidance to avoid misapplication and misinterpretation; minor edits to simplify the codification and thereby improve its usefulness; and minor enhancements to codification guidance that are not expected to have a significant effect on current practice. The provisions of ASU 2015-10 are effective for fiscal years beginning after December 15, 2015. We do not expect that the adoption of ASU 2015-10 will have significant impact on our consolidated financial statements.
In April 2015, the FASB issued Accounting Standards Update 2015-05, Customer's Accounting for Fees in a Cloud Computing Arrangement ("ASU 2015-05"), related to cloud computing arrangements. ASU 2015-05 sets forth guidance on accounting for fees paid in a cloud computing arrangement and specifically outlines how to determine whether a cloud computing arrangement contains a software license or is solely a service contract. ASU 2015-05 will be effective for annual and interim reporting periods beginning after December 15, 2015 and permits early adoption. We currently do not anticipate that the adoption of this standard will have a material impact on our consolidated financial statements.
In January 2015, the FASB issued Accounting Standards Update 2015-01, Simplifying Income Statement Presentation by Eliminating the Concept of Extraordinary Items, an update to ASC Topic 225—Income Statement ("ASU 2015-01"), which eliminates from accounting principles generally accepted in the United States the concept of extraordinary items. Subtopic 225-20, Income Statement—Extraordinary and Unusual Items, required that an entity separately classify, present, and disclose extraordinary events and transactions. Presently, an event or transaction is presumed to be an ordinary and usual activity of the reporting entity unless evidence clearly supports its classification as an extraordinary item. ASU 2015-01 is effective for annual periods beginning after December 15, 2015. An entity has the option to adopt the changes earlier provided that the guidance is applied from the beginning of the fiscal year of adoption. We currently do not anticipate the adoption of this standard will have a material impact on our consolidated financial statements.
In June 2014, the FASB issued Accounting Standards Update 2014-12, Compensation—Stock Compensation (Topic 718): Accounting for Share-Based Payments When the Terms of an Award Provide that a Performance Target Could be Achieved after the Requisite Service Period ("ASU 2014-12"), which requires that a performance target that affects vesting, and that could be achieved after the requisite service period, be treated as a performance condition. Thus, the performance target should not be reflected in estimating the grant date fair value of the award. This update further clarifies that compensation cost should be recognized in the period in which it becomes probable that the performance target will be achieved and should represent the compensation cost attributable to the period(s) for which the requisite service has already been rendered. The provisions of this ASU are effective for interim and annual periods beginning after December 15, 2015. Entities can apply the amendment either a) prospectively to all awards granted or modified after the effective date or b) retrospectively to all awards with performance targets that are outstanding as of the beginning of the earliest annual period presented in the financial statements and to all new or modified awards thereafter. We currently do not anticipate the adoption of this standard will have a material impact on our consolidated financial statements.
33
Results of Operations
Our sales increased $134.5 million, or 21.3%, to $764.8 million for 2015 as compared to 2014. Our gross profit increased $6.6 million, or 4.8%, to $143.4 million for 2015 as compared to 2014. Our earnings from operations decreased $7.4 million, or 45.1%, to $9.1 million for 2015 as compared to 2014. The following table shows, for the periods indicated, certain selected financial data expressed as a percentage of net sales.
| |
Year Ended December 31, | |||||||||
|---|---|---|---|---|---|---|---|---|---|---|
| |
2015 | 2014 | 2013 | |||||||
Net sales |
100.0 | % | 100.0 | % | 100.0 | % | ||||
Cost of sales |
82.1 | 78.3 | 77.5 | |||||||
| | | | | | | | | | | |
Gross profit |
18.8 | 21.7 | 22.5 | |||||||
| | | | | | | | | | | |
Operating expenses: |
||||||||||
Sales and marketing |
9.0 | 9.8 | 10.2 | |||||||
General and administrative |
3.4 | 3.5 | 3.5 | |||||||
Engineering |
4.1 | 4.6 | 4.6 | |||||||
Integration and transaction costs |
0.1 | 0.1 | 0.0 | |||||||
Amortization of intangibles |
1.0 | 1.1 | 1.3 | |||||||
| | | | | | | | | | | |
Total operating expenses |
17.6 | 19.1 | 19.6 | |||||||
| | | | | | | | | | | |
Operating earnings |
1.2 | % | 2.6 | % | 2.9 | % | ||||
| | | | | | | | | | | |
| | | | | | | | | | | |
| | | | | | | | | | | |
Comparison of 2015, 2014 and 2013
Sales, Gross Profit and Gross Profit Percentage:
The following table shows, for the periods indicated, sales and gross profit information for our product and service sales.
| |
Year Ended December 31, | |||||||||
|---|---|---|---|---|---|---|---|---|---|---|
| |
2015 | 2014 | 2013 | |||||||
| |
(in thousands) |
|||||||||
Product sales |
$ | 469,111 | $ | 380,631 | $ | 373,008 | ||||
Service sales |
295,654 | 249,605 | 221,176 | |||||||
Product gross profit |
83,487 | 79,779 | 81,337 | |||||||
Service gross profit |
59,943 | 57,048 | 52,521 | |||||||
Product gross profit as a percentage of product sales |
17.8 | % | 21.0 | % | 21.8 | % | ||||
Service gross profit as a percentage of service sales |
20.3 | % | 22.9 | % | 23.7 | % | ||||
The following table shows, for the periods indicated, revenues by revenue mix component expressed as a percentage of net sales.
| |
Year Ended December 31, | |||||||||
|---|---|---|---|---|---|---|---|---|---|---|
| |
2015 | 2014 | 2013 | |||||||
Service |
38.7 | % | 39.7 | % | 37.4 | % | ||||
Storage |
22.9 | 27.2 | 33.5 | |||||||
Networking and servers |
30.4 | 22.0 | 20.4 | |||||||
Software |
7.3 | 10.3 | 7.6 | |||||||
Tape |
0.7 | 0.8 | 1.1 | |||||||
| | | | | | | | | | | |
Net sales |
100.0 | % | 100.0 | % | 100.0 | % | ||||
| | | | | | | | | | | |
| | | | | | | | | | | |
| | | | | | | | | | | |
34
On October 18, 2014, we entered into a Merger Agreement with Bear Data. Our results for December 31, 2015 and 2014 include the results of operations from the acquisition of Bear Data from that date.
Sales. Our product sales continue to reflect a diversification in the mix of our offerings. Product sales increased 23.2% in 2015 from 2014 up to $469.1 million and increased 2.0% in 2014 from 2013 up to $380.6 million. Our service sales, which include customer support, consulting and installation services, increased 18.4% in 2015 over 2014 to $295.7 million and increased 12.9% in 2014 over 2013 to $249.6 million. Our 2015 results for both product sales and service sales include a full year of revenue from the Bear Data acquisition in October 2014.
The increase in our product sales in 2015 as compared to 2014 reflects the impact of our Bear Data acquisition in October 2014 and continued growth in our client base including growth in clients with multi-million dollar accounts with us, partially offset by a decline in our total storage revenues as clients continue to evaluate new technologies such as solid state memory and hyper-converged offerings. The increase in our product sales in 2014 as compared to 2013, respectively, reflects the continued growth in our client base including growth in clients with multi-million dollar accounts with us, and market acceptance of our ongoing strategy to service the complete data center, as evidenced by increases in our storage and networking product sales. Our storage, server and network sales have increased as part of our strategy to deliver data center hardware, software and services. Our more recent product sales continue to reflect our clients' closer scrutiny of expenditures as they focus more attention on the actual or anticipated impact that current economic conditions may have on the growth and profitability of their businesses. We cannot assure that changes in client spending or economic conditions will positively impact our future product revenues in 2016.
The increase in our service sales in 2015 over 2014 included an increase in customer support contract sales of $31.2 million, or 15.8%, over 2014 and an increase in consulting services, managed services and installation and configuration services of $14.7 million, or 28.1%, over 2014. The increase in our service sales in 2014 over 2013 included an increase in customer support contract sales of $21.4 million, or 12.2%, over 2013 and an increase in consulting services, managed services and installation and configuration services of $7.0 million, or 15.5%, over 2013.The increase in our service sales in 2015 as compared to 2014 and 2014 as compared to 2013, respectively, reflects additional sales as a result of our Bear Data acquisition during the fourth quarter of 2014 and the impact of accelerating momentum for our virtualized data center solutions and services offerings, including unified monitoring, managed infrastructure services for the entire multi-vendor virtualized data center, and managed services offerings for backup, monitoring, archiving, cloud backup and cloud enablement services, which help companies analyze the impact of cloud deployments on their business. In addition, we are expanding into markets like security and software-defined data centers, which we believe will increase our relevance to clients and maximize client retention by providing a single trusted source for all of their data center needs. We continue to successfully sell our installation and configuration services and customer support contracts. Without continued sustainable growth in our product sales going forward, we would expect our customer support contract sales to suffer and we cannot assure that our future customer support contract sales will not decline.
We had no single client account for 10% or greater of either our product or service sales for the years 2015, 2014 or 2013. However, our top five clients collectively accounted for 13%, 7%, and 10% of our 2015, 2014, and 2013 revenues, respectively.
Gross Profit. Our product gross profit as a percentage of product sales is impacted by the mix and type of projects we complete for our clients. Total gross profit as a percentage of net sales was 18.8% in 2015, decreasing from 21.7% in 2014 and 22.5% in 2013.
Product gross profit as a percentage of product sales was 17.8% in 2015 as compared to 21.0% in 2014 and 21.8% in 2013. Our product gross profit as a percentage of product sales is impacted by the
35
mix and type of projects we complete for our clients. Our product gross profit as a percentage of product sales for 2015 over 2014 decreased primarily due to an ongoing shift in our business from higher-margin storage product sales to lower-margin networking and server product sales. The decrease in our product gross profit as a percentage of product sales in 2014 was due in part to lower gross margins across all of our hardware vendors and to a decrease in our storage revenues as a percentage of total revenues, which historically has carried higher gross margins. In addition, our clients are scrutinizing large storage purchases more than they have in the recent past, and we experienced reluctance from some of our vendors to assist with additional discounts in 2015. We expect that as we continue implementing our strategy to sell comprehensive data center solutions with servers and networking products that our product gross margins for 2016 will be between 15% and 18%.
Our product gross profit is also impacted by various vendor incentive programs that provide economic incentives for achieving various sales performance targets. Achieving these targets contributed favorably to our product gross profit by $9.4 million (2% of product cost of sales), $9.2 million (3% of product cost of sales), and $7.2 million (2% of product cost of sales) in 2015, 2014, and 2013, respectively. These vendor programs constantly change and we negotiate them separately with each vendor. While we expect the incentive and early pay programs to continue, the vendors could modify or discontinue them, particularly in light of current economic conditions, which would unfavorably impact our product gross profit margins.
Service gross profit as a percentage of service sales was 20.3% in 2015 as compared to 22.9% in 2014 and 23.7% in 2013. In 2015, 2014, and 2013 the decrease in our service gross profit is driven by a combination of reduction in the gross margin percentage on professional services provided by us as a result of adding new collaboration, security, wireless, and networking products and services and a reduction in the gross margin percentage for our customer support contracts on which we were not able to sell first call support, which carry lower gross margins. We estimate that our service gross margins for 2016 will continue to be between 20% and 25%.
Operating Expenses:
| |
Year Ended December 31, | |||||||||
|---|---|---|---|---|---|---|---|---|---|---|
| |
2015 | 2014 | 2013 | |||||||
| |
(in thousands) |
|||||||||
Sales and marketing |
$ | 69,141 | $ | 61,877 | $ | 60,842 | ||||
General and administrative |
25,784 | 22,271 | 20,729 | |||||||
Engineering |
31,104 | 29,128 | 27,536 | |||||||
Integration and transaction costs |
1,000 | 626 | 95 | |||||||
Amortization of intangibles |
7,347 | 6,428 | 7,251 | |||||||
| | | | | | | | | | | |
Total operating expenses |
$ | 134,376 | $ | 120,330 | $ | 116,453 | ||||
| | | | | | | | | | | |
| | | | | | | | | | | |
| | | | | | | | | | | |
Sales and Marketing. Sales and marketing expenses include wages and commissions paid to sales and marketing personnel, travel costs and advertising, promotion and hiring expenses. We expense advertising costs as incurred. Sales and marketing expenses totaled $69.1 million, or 9.0% of net sales for 2015 as compared to $61.9 million, or 9.8% of net sales for 2014 and $60.8 million, or 10.2% of net sales for 2013. The decrease in sales and marketing expenses as a percentage of sales from 2015 to 2014 and 2014 to 2013 reflects the improvement in revenues per employee we have realized as part of our growth strategy. The increase in sales and marketing expenses in absolute dollars for 2015 over 2014 reflects an increase in salaries and benefits, commensurate with the increase in the number of salespeople for the 2015 period as a result of our acquisition of Bear Data during the fourth quarter of 2014. The increase in sales and marketing expenses in absolute dollars for 2014 over 2013 reflects an increase in our sales and marketing headcount for the 2014 period, due in part to the Bear Data acquisition, partially offset by a decrease in variable compensation. As we continue to selectively hire
36
additional outside sales representatives, our sales and marketing expenses may increase without a commensurate increase in sales.
General and Administrative. General and administrative expenses include wages for administrative personnel, professional fees, depreciation, communication expenses and rent and related facility expenses. General and administrative expenses increased to $25.8 million, or 3.4% of net sales for 2015 as compared to $22.3 million, or 3.5% of net sales for 2014 and $20.7 million, or 3.5% of net sales, for 2013. Our general and administrative expense increased $3.5 million in 2015 compared to 2014, but remained constant as a percentage of sales at 3.4% as compared to 3.5% over the same periods. Our general and administrative expense increased $1.6 million in 2014 compared to 2013, but remained relatively constant as a percentage of sales. The increase in general and administrative expenses for 2015 was primarily due to an increase of $1.5 million in facilities and depreciation expenses and an increase of $795,000 in salaries and benefits, and an increase in office telephone expense of $402,000. The increases in facilities, telephone and headcount are primarily due to the integration of the Bear Data acquisition. The increase in general and administrative expenses for 2014 was primarily due to an increase of $861,000 in expenses for software as a service, an increase of $565,000 in depreciation expenses commensurate with the increase in fixed assets resulting from our acquisitions of Bear Data in October 2014, and increase of $429,000 in telephone and internet expenses related to the increase in headcount during 2014, and an increase of $201,000 in salary and benefit expenses and an increase of $185,000 in employee training expenses commensurate with an increase in headcount, partially offset by a decrease of $858,000 in consulting and outside services. The constant rate of general and administrative expenses as a percentage of sales from 2015 to 2014 and 2014 to 2013 reflect the operational synergies and efficiencies we have realized through combined general and administrative corporate functions in 2015, 2014 and 2013.
Engineering. Engineering expenses include employee wages, bonuses and travel, hiring and training expenses for our field and customer support engineers and technicians. We allocate engineering costs associated with installation and configuration services and with consulting services to our cost of service sales. Engineering expenses increased to $31.1 million, or 4.1% of net sales in 2015 compared to $29.1 million, or 4.6% of net sales in 2014 and $27.5 million, or 4.6% of net sales in 2013. Our engineering expense increased $2.0 million in 2015 but decreased as a percentage of sales to 4.1% for 2015 as compared to 4.6% in 2014. The increase in engineering expenses in absolute dollars for 2015 over 2014 is primarily due to an increase in travel and entertainment of $1.3 million and an increase in stock-based compensation expenses of $1.4 million, both commensurate with the increase in engineering headcount during the 2015 period that was a result of the Bear Data acquisition and of adding new products and services to address rising market acceptance of unified data centers. This was partially offset by a reduction in our allocation of management expenses of approximately $541,000. Our engineering expense increased $1.6 million in 2014 but remained constant as a percentage of sales at 4.6% for both periods. The increase in engineering expenses in absolute dollars for 2014 over 2013 is primarily due to an increase in salaries, wages and benefits of $3.7 million commensurate with the increase in engineering headcount from our Bear Data acquisition and the growth of our legacy service lines, partially offset by a decrease of $985,000 in variable compensation and an increase of $2.5 million in engineering costs allocated to our cost of service sales, commensurate with the increase in our professional services sales.
Integration and Transaction Costs. Integration and transaction expenses include audit, legal and other outside consulting fees related to our Bear Data and StraTech acquisitions in 2014 and 2012, respectively. They also include expenses for transition services agreements with former employees of those companies. We had integration expenses of $1.0 million, $626,000, and $95,000 in 2015, 2014, and 2013, respectively. Integration expenses we incurred in 2015 and 2014 were related to the acquisition of Bear Data in October 2014. Integration expenses we incurred in 2013 were related to the acquisition of StraTech in October 2012.
37
Intangible Amortization. We had expenses related to the amortization of finite-lived intangible assets of $7.3 million, $6.4 million, and $7.3 million in 2015, 2014, and 2013, respectively. Amortization expense in 2015 and 2014 was related to the acquisitions of Bear Data in 2014, StraTech in October 2012 and Midwave in October 2011. The finite-lived intangible assets we acquired in the Bear Data acquisition consisted of covenants not to compete, trademarks, customer relationships and order backlog having estimated lives of three years, three years, six years and three months, respectively. We are amortizing the customer relationships acquired in the Bear Data acquisition using an accelerated amortization method, to match the pattern in which the economic benefits are expected to be consumed. We are amortizing the covenants not to compete, trademarks, and order backlog using the straight-line method. The finite-lived intangible asset we acquired in our acquisition of StraTech consisted of customer relationships having an estimated life of five years that we are amortizing using an accelerated amortization method, to match the pattern in which the economic benefits of that asset are expected to be consumed. The increase in amortization of intangibles expenses in 2015 as compared to 2014 is primarily due to the acquisition of Bear Data in October 2014. The decrease in amortization of intangibles expenses in 2014 as compared to 2013 is primarily due to our use of an accelerated amortization method in amortizing the customer relationships acquired in the StraTech acquisition. This decrease was partially offset by amortization of intangibles associated with our acquisition of Bear Data. We expect amortization expense to be approximately $5.2 million in 2016.
We perform an impairment test for finite-lived intangible assets, goodwill and other long-lived assets, such as fixed assets, annually or whenever events or changes in circumstances indicate that we may not recover the carrying value of such assets. We recognize impairment based on the difference between the fair value of the asset and our carrying value.
The assessment to determine if a potential impairment of goodwill exists involves comparing our market capitalization to the carrying value of its net assets.
Historically, our market capitalization has been well above the carrying value of our net assets and there has been no indication of potential impairment. However, during the third and fourth quarters of 2015, the price of our common stock was significantly impacted by the volatility in the U.S. equity markets. The price of our common stock reached a low of $5.34 during the third quarter and $5.70 during the fourth quarter of 2015, respectively, and closed at $6.80 on December 31, 2015. These lows in the price of our common stock coincided with fluctuations in the equity markets for the second half of 2015. As of December 31, 2015, our market capitalization was approximately $153.9 million as compared to our stockholders' equity at December 31, 2015 of $164.8 million.
We believe that our fair value exceeds our market capitalization because our fair value should include a control premium. A control premium is the amount that a buyer is willing to pay over the current market price of a company as indicated by the traded price per share (i.e. market capitalization), in order to acquire a controlling interest. The premium is justified by the expected synergies, such as the expected increase in cash flow resulting from cost savings and revenue enhancements. We utilized data from Capital IQ for all transactions involving U.S. companies with the same industry classification as us during the past 12 months. The data indicated a wide range of control premiums and we selected 30 percent as an appropriate control premium in determining fair value. Applying a control premium of 30 percent resulted in a controlling basis value of $200 million, which is in excess of our stockholders' equity at December 31, 2015 of $164.8 million and indicates there is not an impairment of goodwill as of December 31, 2015.
For 2015, 2014, and 2013, we identified no triggering events that required us to evaluate the impairment of our long-lived assets.
38
Operating Earnings:
| |
Years Ended December 31, | |||||||||
|---|---|---|---|---|---|---|---|---|---|---|
| |
2015 | 2014 | 2013 | |||||||
| |
(in thousands) |
|||||||||
Earnings from operations |
$ | 9,054 | $ | 16,497 | $ | 17,405 | ||||
We realized earnings from operations of $9.1 million, $16.5 million, and $17.4 million in 2015, 2014, and 2013, respectively. The decrease in our earnings from operations in 2015 compared to 2014 was due primarily to an increase in our networking revenue stream, which has historically carried lower margins than our storage revenue stream, a reduction in the gross margin percentage for our customer support contracts on which we were not able to sell first call support, and an increase in salaries and benefits, facilities, and depreciation expenses largely due to additional facilities and headcount that were a result of our Bear Data acquisition. Our decrease earnings from operations in 2014 compared to 2013 are a result of lower-margin fulfillment business during the fourth quarter and a decline in higher margin storage revenues as a percentage of total revenues, coupled with an increase in sales and marketing, engineering, and general and administrative expenses that are primarily the result of increased headcount during 2014.
Income Taxes:
We had income tax expense of $4.3 million in 2015 which resulted in our estimated effective tax rate of 47.7%. We had income tax expense of $6.3 million in 2014 which resulted in our estimated effective tax rate of 36.2%. We had income tax expense of $6.6 million in 2013 which resulted in our estimated effective tax rate of 39.8%. Income tax expense for 2015, 2014, and 2013 consists of the following:
| |
Year Ended December 31, | |||||||||
|---|---|---|---|---|---|---|---|---|---|---|
| |
2015 | 2014 | 2013 | |||||||
| |
(in thousands) |
|||||||||
Current income tax expense: |
||||||||||
United States federal |
$ | 7,243 | $ | 6,591 | $ | 14,142 | ||||
State and local |
1,625 | 984 | 2,485 | |||||||
| | | | | | | | | | | |
Current income tax expense |
$ | 8,868 | $ | 7,575 | $ | 16,627 | ||||
| | | | | | | | | | | |
Deferred income tax benefit: |
||||||||||
United States federal |
$ | (3,828 | ) | $ | (1,200 | ) | $ | (8,886 | ) | |
State and local |
(756 | ) | (78 | ) | (1,099 | ) | ||||
| | | | | | | | | | | |
Deferred income tax benefit |
(4,584 | ) | (1,278 | ) | (9,985 | ) | ||||
| | | | | | | | | | | |
Income tax expense |
$ | 4,284 | $ | 6,297 | $ | 6,642 | ||||
| | | | | | | | | | | |
| | | | | | | | | | | |
| | | | | | | | | | | |
In future periods of taxable earnings, we expect to report an income tax provision using an effective tax rate of approximately 40% to 42%.
Quarterly Results
The following table sets forth our unaudited quarterly financial data for each quarter of 2015 and 2014. We have prepared this unaudited information on the same basis as our audited information. In our opinion, we have made all adjustments (including all normal recurring adjustments) necessary to
39
present fairly the information set forth below. The operating results for any quarter are not necessarily indicative of results for any future period.
| |
Quarter Ended | ||||||||||||||||||||||||
|---|---|---|---|---|---|---|---|---|---|---|---|---|---|---|---|---|---|---|---|---|---|---|---|---|---|
| |
2015 | 2014 | |||||||||||||||||||||||
| |
Mar. 31 | Jun. 30 | Sep. 30 | Dec. 31 | Mar. 31 | Jun. 30 | Sep. 30 | Dec. 31 | |||||||||||||||||
| |
(in thousands) |
||||||||||||||||||||||||
Net sales |
$ | 175,352 | $ | 182,631 | $ | 198,032 | $ | 208,750 | $ | 139,535 | $ | 159,380 | $ | 144,947 | $ | 186,374 | |||||||||
Gross profit |
35,168 | 36,472 | 34,881 | 36,909 | 29,482 | 35,483 | 32,333 | 39,529 | |||||||||||||||||
Operating earnings (loss) |
(8 | ) | 1,179 | 2,476 | 5,427 | (413 | ) | 5,974 | 4,564 | 6,372 | |||||||||||||||
Net earnings |
(14 | ) | 661 | 1,314 | 2,738 | 301 | 3,563 | 3,546 | 3,671 | ||||||||||||||||
We have experienced, and expect to continue to experience, quarterly variations in our net sales as a result of a number of factors, including the length of the sales cycle with clients for large data center evaluations and purchases, delays in data center installations or configurations, new product introductions by suppliers and their market acceptance, delays in product shipments or other quality control difficulties, and trends in the data center industry in general or the geographic and industry specific markets in which we operate now or in the future. In addition, current economic conditions and competition also affect our clients' decisions to place or delay orders with us, and the size and scale of their orders. Further, our success in integrating any acquired business or in opening any new field offices could impact our operating results.
Liquidity and Capital Resources
| |
Year ended December 31, | |||||||||
|---|---|---|---|---|---|---|---|---|---|---|
| |
2015 | 2014 | 2013 | |||||||
| |
(in thousands) |
|||||||||
Total cash provided by (used in): |
||||||||||
Operating activities |
$ | 21,401 | $ | (18,208 | ) | $ | 15,075 | |||
Investing activities |
(1,630 | ) | 13,294 | (53,769 | ) | |||||
Financing activities |
(8,099 | ) | 7,768 | 53,250 | ||||||
| | | | | | | | | | | |
Increase in cash and cash equivalents |
$ | 11,672 | $ | 2,854 | $ | 14,556 | ||||
| | | | | | | | | | | |
| | | | | | | | | | | |
| | | | | | | | | | | |
We finance our operations and capital requirements primarily through cash flows generated from operations. Our working capital was $102.4 million at December 31, 2015 as compared to $94.7 million at December 31, 2014. At December 31, 2015, our cash and cash equivalents balance was $39.4 million as compared to cash and cash equivalents of $27.7 million at December 31, 2014.
Cash provided by operating activities for 2015 was $21.4 million. Cash provided by operating activities for 2015 was primarily impacted by:
- •
- Our net earnings for the year of $4.7 million.
- •
- Non-cash charges of $7.3 million, $5.4 million and $3.2 million for amortization of intangibles, stock
compensation expense and depreciation, respectively.
- •
- $3.1 million of cash used for certain working capital items, including a net increase of $3.9 million in accounts receivable, $869,000 in inventories, and $8.7 million in income tax payable offset by a net decrease of $2.7 million in accrued expenses and $8.4 million in accounts payable.
40
- •
- A net $3.3 million increase in deferred customer support contracts. While we amortize the revenues from these contracts over the life of the contract, the client typically pays for the contracts at the beginning of the contract period which favorably impacts our cash flows.
Cash used in operating activities for 2014 was $18.2 million. Cash used in operating activities for 2014 was primarily impacted by:
- •
- Our net earnings for the year of $11.1 million.
- •
- Non-cash charges of $6.4 million, $4.0 million and $2.7 million for amortization of intangibles, stock
compensation expense and depreciation, respectively.
- •
- $41.3 million of cash used for certain working capital items, including a net increase of $30.5 million in accounts
receivable, $4.6 million in inventories, and $15.8 million in income tax receivable and a net decrease of $3.6 million in accrued expenses, partially offset by a net increase of
$13.2 million in accounts payable.
- •
- A net $4.0 million increase in deferred customer support contracts. While we amortize the revenues from these contracts over the life of the contract, the client typically pays for the contracts at the beginning of the contract period which favorably impacts our cash flows.
Cash provided by operating activities for 2013 was $15.1 million. Cash provided by operating activities for 2013 was primarily impacted by:
- •
- Our net earnings for the year of $10.0 million.
- •
- A net $14.0 million increase in income taxes payable, partially offset by a $10.0 million decrease in deferred tax
assets.
- •
- Non-cash charges of $7.3 million, $4.0 million and $2.1 million for amortization of intangibles, stock
compensation expense and depreciation, respectively.
- •
- A net decrease of $12.9 million in accounts receivable, offset by increases in inventories, accounts payable and accrued
expenses.
- •
- A net $7.6 million increase in deferred customer support contracts. While we amortize the revenues from these contracts over the life of the contract, the client typically pays for the contracts at the beginning of the contract period which favorably impacts our cash flows.
Cash used in investing activities was $1.6 million in 2015. This amount was comprised of $38.0 million of sales and maturities of trading securities, offset by $35.7 million of purchases of trading securities and $3.9 million of purchases of property and equipment. Cash provided by investing activities was $13.3 million in 2014. This amount was comprised of $108.3 million of sales and maturities of trading securities, partially offset by $80.1 million of purchases of trading securities, $12.7 million paid in cash for the acquisition of Bear Data, net of cash acquired, and $2.2 million of purchases of property and equipment. Cash used in investing activities was $53.8 million in 2013. In 2013, our primary use of cash for investing activities was for the purchase of $51.0 million of trading securities and the purchase of $2.7 million of property and equipment.
We are planning for approximately $3.0 million of capital expenditures during 2016 primarily related to enhancements to our management information systems, upgraded computer equipment and leasehold improvements.
Cash used in financing activities was $8.1 million in 2015, primarily due to $3.3 million of net payments under our line of credit and $4.8 million for our common stock repurchase plan in 2015. Cash provided by financing activities was $7.8 million in 2014, primarily due to $7.7 million of proceeds from our line of credit in 2014. Cash provided by financing activities was $53.3 million in 2013. This was primarily attributable to $39.0 million of proceeds from our August 2013 stock offering and
41
proceeds of $20.0 million under our floor plan line of credit, partially offset by $6.0 million of net payments under our Prior Credit Agreement. On August 8, 2013, we entered into an underwriting agreement relating to the public offering of 3,300,000 shares of our common stock at a price to the public of $11.00 per share, less underwriting discounts. In addition, we granted the underwriters a 30-day option to purchase up to an additional 495,000 shares at $11.00 per share to cover over-allotments, if any. On August 14, 2013, we completed the offering of 3,795,000 shares of common stock at a price to the public of $11.00 per share. The number of shares sold in the offering includes the underwriters' full exercise of their over-allotment option.
On July 17, 2013, we entered into a Credit Agreement ("Credit Agreement") with Castle Pines Capital LLC ("CPC"), an affiliate of Wells Fargo Bank, National Association ("Wells Fargo"). The Credit Agreement provided for a channel finance facility ("Channel Finance Facility") and a revolving facility ("Revolving Facility" and, together with the Channel Finance Facility, "Combined Facility") in a maximum combined aggregate amount of $40 million. On May 21, 2015, we entered into the Second Amendment to Credit Agreement (the "Amended Agreement"), which provides an increase to the Combined Facility for a maximum combined aggregate borrowing amount of $75 million. Under the Amended Agreement, borrowing under the Revolving Facility cannot exceed the lesser of (i) $75 million minus the amount outstanding under the Floor Plan Line of Credit or (ii) a borrowing base consisting of 85% of certain eligible accounts and 100% of channel financed inventory, subject to CPC's ability to impose reserves in the future. The Floor Plan Line of Credit will finance certain purchases of inventory by us from vendors approved by CPC and the Revolving Facility may be used for working capital purposes and permitted acquisitions.
The amounts outstanding under the Revolving Facility bear interest at a per annum rate of 2.0% above Wells Fargo's one-month LIBOR rate (approximately 0.43% at December 31, 2015). Advances under the Floor Plan Line of Credit will not bear interest so long as they are paid by the applicable payment due date and advances that remain outstanding after the applicable payment due date will bear interest at a per annum rate of LIBOR plus 4%. Under the Credit Agreement, we were obligated to pay quarterly to CPC an unused commitment fee equal to 0.50% per annum on the average daily unused amount of the Combined Facility, with usage including the sum of any advances under either the Floor Plan Line of Credit or the Revolving Facility. The Amended Agreement eliminates the unused commitment fee. The Combined Facility and certain bank product obligations owed to Wells Fargo or its affiliates are secured by substantially all of our personal property. The Amended Agreement terminates on January 9, 2018 and we will be obligated to pay certain prepayment fees if the Credit Agreement is terminated prior to that date.
The Amended Agreement contains customary representations, warranties, covenants and events of default, including but not limited to, covenants restricting our ability to (i) grant liens on our assets, (ii) make certain fundamental changes, including merging or consolidating with another entity or making any material change in the nature of our business, (iii) make certain dividends or distributions, (iv) make certain loans or investments, (v) guarantee or become liable in any way on certain liabilities or obligations of any other person or entity, or (vi) incur certain indebtedness.
The Amended Agreement contains certain covenants regarding our financial performance, including (i) a minimum tangible net worth of at least $30 million, and (ii) a minimum quarterly free cash flow requirement, which requires us to have free cash flow of at least $5 million at the end of each fiscal quarter for the trailing twelve-month period then ended, commencing December 31, 2014 and continuing at the end of each fiscal quarter thereafter.
Of the $75 million maximum borrowing amount available at December 31, 2015 under the combined Channel Finance Facility and Revolving Facility, we had outstanding advances of $24.3 million and $27.7 million on the Channel Finance Facility at December 31, 2015 and 2014, respectively, related to the purchase of inventory from a vendor.
42
Our future capital requirements may vary materially from those now planned and will depend on many factors, including our strategy to continue to grow our business by select acquisitions. Historically, we have experienced an increase in our expenditures consistent with the growth of our operations and we anticipate our expenditures will continue to increase as we grow our business by acquisitions or organically. We believe that funds generated from our operations and available from our borrowing facilities will be sufficient to fund current business operations and anticipated growth.
Off-Balance Sheet Arrangements
We do not have any special purpose entities or off-balance sheet financing.
Contractual Obligations and Commitments
As of December 31, 2015, our contractual cash obligations consisted of future minimum lease payments due by period under non-cancelable operating leases, amounts due under non-cancelable capital leases, and amounts due under our line of credit agreement as follows:
| |
Total | Less than 1 year |
1-3 years | 3-5 years | More than 5 years |
|||||||||||
|---|---|---|---|---|---|---|---|---|---|---|---|---|---|---|---|---|
| |
(in thousands) |
|||||||||||||||
Operating lease obligations |
$ | 12,670 | $ | 3,287 | $ | 7,059 | $ | 2,191 | $ | 133 | ||||||
Capital lease obligations |
9,500 | 3,643 | 5,716 | 141 | — | |||||||||||
Amount due under line of credit agreement |
24,340 | 24,340 | — | — | — | |||||||||||
| | | | | | | | | | | | | | | | | |
Total |
$ | 46,510 | $ | 31,270 | $ | 12,775 | $ | 2,332 | $ | 133 | ||||||
Our operating lease obligations are for facilities throughout the country that expire at various dates through August 2023.
We have classified the amount due under our line of credit agreement as a current liability within the balance sheet as we intend to pay off the balance within the next 12 months.
We periodically enter into purchase commitments with our suppliers under customary purchase order terms. We would recognize any significant losses implicit in these contracts in accordance with generally accepted accounting principles. At December 31, 2015, we were not obligated to purchase any goods or services from our suppliers and no such losses existed.
Inflation
We do not believe that inflation has had a material effect on our results of operations in recent years. We cannot assure you that inflation will not adversely affect our business in the future.
Item 7A. Quantitative and Qualitative Disclosures about Market Risk.
Our interest income is sensitive to changes in the general level of U.S. interest rates, particularly since the majority of our investments are in short term instruments. We do not undertake any specific actions to cover our exposure to interest rate risk and we are not party to any interest rate risk management transactions.
The following discusses our exposure to market risk related to changes in interest rates, foreign exchange rates and equity prices.
Interest rate risk. As of December 31, 2015, we had $20.6 million in short term investments and $24.3 million in short term debt. The impact on the income before income taxes of a 1% change in
43
short term interest rates would be unfavorable by approximately $37,000 based on our short term investments and short term debt balances as of December 31, 2015.
Foreign currency exchange rate risk. We have foreign currency risk related to our revenues and operating expenses denominated in currencies other than the U.S. dollar, primarily the Euro, the British Pound, the Hong Kong Dollar, the Singapore Dollar, the Australian Dollar and the Canadian Dollar. Accordingly, changes in exchange rates may negatively affect our revenue and net income as expressed in U.S. dollars. We have experienced and will continue to experience fluctuations in our net income as a result of gains (losses) on these foreign currency transactions. For the twelve months ended December 31, 2015, 2014 and 2013, respectively we had $242,000, $4,200 and $0 of foreign currency exchange losses. The volatility of exchange rates depends on many factors that we cannot forecast with reliable accuracy.
Equity price risk. We do not own any equity investments. Therefore, we are not currently exposed to any direct equity price risk.
44
Item 8. Financial Statements and Supplementary Data.
Report of Independent Registered Public Accounting Firm
To
the Board of Directors and Shareholders
Datalink Corporation
We have audited the accompanying consolidated balance sheets of Datalink Corporation as of December 31, 2015 and 2015, and the related consolidated statements of operations, stockholders' equity, and cash flows for each of the three years in the period ended December 31, 2015. Our audits also included the financial statement schedule of the Company listed in Item 15(a). These consolidated financial statements and financial statement schedule are the responsibility of the Company's management. Our responsibility is to express an opinion on these financial statements and schedule based on our audits.
We conducted our audits in accordance with the standards of the Public Company Accounting Oversight Board (United States). Those standards require that we plan and perform the audit to obtain reasonable assurance about whether the financial statements are free of material misstatement. An audit includes examining, on a test basis, evidence supporting the amounts and disclosures in the financial statements. An audit also includes assessing the accounting principles used and significant estimates made by management, as well as evaluating the overall financial statement presentation. We believe that our audits provide a reasonable basis for our opinion.
In our opinion, the consolidated financial statements referred to above present fairly, in all material respects, the financial position of Datalink Corporation as of December 31, 2015 and 2014, and the results of their operations and their cash flows for each of the three years in the period ended December 31, 2015, in conformity with U.S. generally accepted accounting principles. Also, in our opinion, the related financial statement schedule, when considered in relation to the basic consolidated financial statements taken as a whole, presents fairly in all material respects the information set forth therein.
We have also audited, in accordance with the standards of the Public Company Accounting Oversight Board (United States), Datalink Corporation's internal control over financial reporting as of December 31, 2015, based on criteria established in Internal Control—Integrated Framework issued by the Committee of Sponsoring Organizations of the Treadway Commission in 2013, and our report dated March 14, 2016 expressed an unqualified opinion on the effectiveness of the Company's internal control over financial reporting.
/s/ RSM US LLP
Minneapolis,
Minnesota
March 14, 2016
45
DATALINK CORPORATION
CONSOLIDATED BALANCE SHEETS
(in thousands, except share data)
| |
December 31, | ||||||
|---|---|---|---|---|---|---|---|
| |
2015 | 2014 | |||||
Assets |
|||||||
Current assets: |
|||||||
Cash and cash equivalents |
$ | 39,397 | $ | 27,725 | |||
Short term investments |
20,579 | 22,994 | |||||
Accounts receivable, net |
163,900 | 171,531 | |||||
Net working capital receivable from acquisition |
— | 741 | |||||
Lease receivable |
3,895 | 2,482 | |||||
Inventories, net |
7,997 | 5,447 | |||||
Current deferred customer support contract costs |
124,705 | 106,497 | |||||
Inventories shipped but not installed |
16,616 | 20,035 | |||||
Income tax receivable |
— | 4,194 | |||||
Other current assets |
3,251 | 3,563 | |||||
| | | | | | | | |
Total current assets |
380,340 | 365,209 | |||||
Property and equipment, net |
7,963 | 7,244 | |||||
Goodwill |
47,101 | 47,101 | |||||
Finite-lived intangibles, net |
9,256 | 16,603 | |||||
Deferred customer support contract costs non-current |
60,240 | 58,484 | |||||
Deferred taxes |
9,177 | 4,593 | |||||
Long-term lease receivable |
7,017 | 4,016 | |||||
Other assets |
703 | 759 | |||||
| | | | | | | | |
Total assets |
$ | 521,797 | $ | 504,009 | |||
| | | | | | | | |
| | | | | | | | |
| | | | | | | | |
Liabilities and Stockholders' Equity |
|||||||
Current liabilities: |
|||||||
Floor plan line of credit |
$ | 24,340 | $ | 27,656 | |||
Accounts payable |
73,959 | 86,266 | |||||
Lease payable |
3,643 | 2,319 | |||||
Accrued commissions |
3,687 | 5,334 | |||||
Accrued sales and use taxes |
3,782 | 4,117 | |||||
Accrued expenses, other |
6,998 | 7,730 | |||||
Income tax payable |
4,492 | — | |||||
Customer deposits |
4,398 | 3,325 | |||||
Current deferred revenue from customer support contracts |
151,619 | 131,061 | |||||
Other current liabilities |
1,050 | 746 | |||||
| | | | | | | | |
Total current liabilities |
277,968 | 268,554 | |||||
Deferred revenue from customer support contracts non-current |
72,262 | 70,663 | |||||
Long-term lease payable |
5,857 | 3,278 | |||||
Other liabilities non-current |
942 | 828 | |||||
| | | | | | | | |
Total liabilities |
357,029 | 343,323 | |||||
| | | | | | | | |
Commitments and contingencies (Notes 6, 7, 8, 10 and 11) |
|||||||
Stockholders' equity: |
|||||||
Common stock, $0.001 par value, 50,000,000 shares authorized, 22,627,322 and 22,876,753 shares issued and outstanding as of December 31, 2015 and 2014, respectively |
23 | 23 | |||||
Additional paid-in capital |
114,431 | 115,048 | |||||
Retained earnings |
50,314 | 45,615 | |||||
| | | | | | | | |
Total stockholders' equity |
164,768 | 160,686 | |||||
| | | | | | | | |
Total liabilities and stockholders' equity |
$ | 521,797 | $ | 504,009 | |||
| | | | | | | | |
| | | | | | | | |
| | | | | | | | |
The accompanying notes are an integral part of these financial statements.
46
DATALINK CORPORATION
CONSOLIDATED STATEMENTS OF OPERATIONS
(in thousands, except per share data)
| |
Year Ended December 31, | |||||||||
|---|---|---|---|---|---|---|---|---|---|---|
| |
2015 | 2014 | 2013 | |||||||
Net sales: |
||||||||||
Product sales |
$ | 469,111 | $ | 380,631 | $ | 373,008 | ||||
Service sales |
295,654 | 249,605 | 221,176 | |||||||
| | | | | | | | | | | |
Total net sales |
764,765 | 630,236 | 594,184 | |||||||
Cost of sales: |
||||||||||
Cost of product sales |
385,624 | 300,852 | 291,671 | |||||||
Cost of services |
235,711 | 192,557 | 168,655 | |||||||
| | | | | | | | | | | |
Total cost of sales |
621,335 | 493,409 | 460,326 | |||||||
| | | | | | | | | | | |
Gross profit |
143,430 | 136,827 | 133,858 | |||||||
Operating expenses: |
||||||||||
Sales and marketing |
69,141 | 61,877 | 60,842 | |||||||
General and administrative |
25,784 | 22,271 | 20,729 | |||||||
Engineering |
31,104 | 29,128 | 27,536 | |||||||
Integration and transaction costs |
1,000 | 626 | 95 | |||||||
Amortization of intangibles |
7,347 | 6,428 | 7,251 | |||||||
| | | | | | | | | | | |
Total operating expenses |
134,376 | 120,330 | 116,453 | |||||||
| | | | | | | | | | | |
Earnings from operations |
9,054 | 16,497 | 17,405 | |||||||
Other income (expense): |
||||||||||
Gain (loss) on settlement related to StraTech acquisition |
— | 877 | (611 | ) | ||||||
Interest income |
434 | 90 | 264 | |||||||
Interest expense |
(263 | ) | (270 | ) | (175 | ) | ||||
Other, net |
(242 | ) | 184 | (196 | ) | |||||
| | | | | | | | | | | |
Net earnings before income taxes |
8,983 | 17,378 | 16,687 | |||||||
Income tax expense |
4,284 | 6,297 | 6,642 | |||||||
| | | | | | | | | | | |
Net earnings |
$ | 4,699 | $ | 11,081 | $ | 10,045 | ||||
| | | | | | | | | | | |
| | | | | | | | | | | |
| | | | | | | | | | | |
Net earnings per common share: |
||||||||||
Basic |
$ | 0.21 | $ | 0.51 | $ | 0.53 | ||||
Diluted |
$ | 0.21 | $ | 0.50 | $ | 0.52 | ||||
Weighted average common shares outstanding: |
||||||||||
Basic |
21,941 | 21,598 | 19,078 | |||||||
Diluted |
22,364 | 22,039 | 19,493 | |||||||
The accompanying notes are an integral part of these financial statements.
47
DATALINK CORPORATION
CONSOLIDATED STATEMENTS OF STOCKHOLDERS' EQUITY
(in thousands)
| |
Common Stock | |
|
|
||||||||||||
|---|---|---|---|---|---|---|---|---|---|---|---|---|---|---|---|---|
| |
Additional Paid-in Capital |
Retained Earnings |
|
|||||||||||||
| |
Shares | Amount | Total | |||||||||||||
Balances, December 31, 2012 |
18,727 | $ | 19 | $ | 70,875 | $ | 24,489 | $ | 95,383 | |||||||
Net earnings |
— | — | — | 10,045 | 10,045 | |||||||||||
Stock option and restricted stock expense |
333 | — | 4,049 | — | 4,049 | |||||||||||
Excess tax benefit from stock compensation |
— | — | 885 | — | 885 | |||||||||||
Tax withholding payments reimbursed by restricted stock |
(100 | ) | — | (1,080 | ) | — | (1,080 | ) | ||||||||
Common shares issued under exercise of stock options |
30 | — | 252 | — | 252 | |||||||||||
Issuance of common stock for secondary offering, net of offering costs |
3,795 | 4 | 39,017 | — | 39,021 | |||||||||||
Stock receivable from settlement of StraTech acquisition |
— | — | (2,647 | ) | — | (2,647 | ) | |||||||||
Measurement period adjustments for StraTech acquisition |
— | — | (112 | ) | — | (112 | ) | |||||||||
| | | | | | | | | | | | | | | | | |
Balances, December 31, 2013 |
22,785 | 23 | 111,239 | 34,534 | 145,796 | |||||||||||
Net earnings |
— | — | — | 11,081 | 11,081 | |||||||||||
Stock option and restricted stock expense |
302 | — | 4,041 | — | 4,041 | |||||||||||
Excess tax benefit from stock compensation |
— | — | 817 | — | 817 | |||||||||||
Tax withholding payments reimbursed by restricted stock |
(146 | ) | — | (1,735 | ) | — | (1,735 | ) | ||||||||
Common shares issued under exercise of stock options |
23 | — | 89 | — | 89 | |||||||||||
Issuance of common stock for Bear Data acquisition |
156 | — | 1,474 | — | 1,474 | |||||||||||
Forfeiture of common stock related to StraTech acquisition |
(243 | ) | — | (877 | ) | — | (877 | ) | ||||||||
| | | | | | | | | | | | | | | | | |
Balances, December 31, 2014 |
22,877 | 23 | 115,048 | 45,615 | 160,686 | |||||||||||
Net earnings |
— | — | — | 4,699 | 4,699 | |||||||||||
Restricted stock expense |
406 | — | 5,351 | — | 5,351 | |||||||||||
Excess tax expense from stock compensation |
— | — | (3 | ) | — | (3 | ) | |||||||||
Tax withholding payments reimbursed by restricted stock |
(126 | ) | — | (1,182 | ) | — | (1,182 | ) | ||||||||
Common shares issued under exercise of stock options |
8 | — | 34 | — | 34 | |||||||||||
Repurchase of common stock |
(629 | ) | — | (4,817 | ) | — | (4,817 | ) | ||||||||
| | | | | | | | | | | | | | | | | |
Balances, December 31, 2015 |
22,536 | $ | 23 | $ | 114,431 | $ | 50,314 | $ | 164,768 | |||||||
| | | | | | | | | | | | | | | | | |
| | | | | | | | | | | | | | | | | |
| | | | | | | | | | | | | | | | | |
The accompanying notes are an integral part of these financial statements.
48
DATALINK CORPORATION
CONSOLIDATED STATEMENTS OF CASH FLOWS
(In thousands)
| |
Year Ended December 31, | |||||||||
|---|---|---|---|---|---|---|---|---|---|---|
| |
2015 | 2014 | 2013 | |||||||
Cash flows from operating activities: |
||||||||||
Net earnings |
$ | 4,699 | $ | 11,081 | $ | 10,045 | ||||
Adjustments to reconcile net earnings to net cash provided by (used in) operating activities: |
||||||||||
Change in fair value of short term investments |
104 | 5 | (187 | ) | ||||||
Provision (benefit) for bad debts |
38 | (152 | ) | 115 | ||||||
Depreciation |
3,222 | 2,667 | 2,102 | |||||||
Amortization of finite-lived intangibles |
7,347 | 6,428 | 7,251 | |||||||
(Gain) loss on settlement related to StraTech acquisition |
— | (877 | ) | 611 | ||||||
Deferred income taxes |
(4,584 | ) | (1,278 | ) | (9,985 | ) | ||||
Stock based compensation expense |
5,351 | 4,041 | 4,049 | |||||||
Excess tax (expense) benefit from stock compensation |
(3 | ) | 817 | 885 | ||||||
Tax withholding payments reimbursed by restricted stock |
(1,182 | ) | (1,735 | ) | (1,080 | ) | ||||
Changes in operating assets and liabilities, net of effects of acquisitions: |
||||||||||
Accounts receivable and leases receivable, net |
3,920 | (30,471 | ) | 12,909 | ||||||
Inventories |
869 | (4,587 | ) | (8,782 | ) | |||||
Deferred customer support contract costs/revenues, net |
3,267 | 4,033 | 7,630 | |||||||
Accounts payable and leases payable |
(8,404 | ) | 13,150 | (23,420 | ) | |||||
Accrued expenses |
(2,714 | ) | (3,588 | ) | (814 | ) | ||||
Income tax payable (receivable), net |
8,686 | (15,780 | ) | 14,016 | ||||||
Other |
785 | (1,962 | ) | (270 | ) | |||||
| | | | | | | | | | | |
Net cash provided by (used in) operating activities |
21,401 | (18,208 | ) | 15,075 | ||||||
| | | | | | | | | | | |
Cash flows from investing activities: |
||||||||||
Sales and maturities of trading securities |
37,981 | 108,292 | — | |||||||
Purchases of trading securities |
(35,670 | ) | (80,077 | ) | (51,027 | ) | ||||
Purchases of property and equipment |
(3,941 | ) | (2,214 | ) | (2,742 | ) | ||||
Payment for acquisitions, net of cash acquired |
— | (12,707 | ) | — | ||||||
| | | | | | | | | | | |
Net cash provided by (used in) investing activities |
(1,630 | ) | 13,294 | (53,769 | ) | |||||
| | | | | | | | | | | |
Cash flows from financing activities: |
||||||||||
Net payments under line of credit |
— | — | (6,000 | ) | ||||||
Net proceeds (payments) from floor plan line of credit |
(3,316 | ) | 7,679 | 19,977 | ||||||
Repurchase of common stock |
(4,817 | ) | — | — | ||||||
Proceeds from stock offering, net of offering costs |
— | — | 39,021 | |||||||
Proceeds from issuance of common stock from stock option exercise |
34 | 89 | 252 | |||||||
| | | | | | | | | | | |
Net cash provided by (used in) financing activities |
(8,099 | ) | 7,768 | 53,250 | ||||||
| | | | | | | | | | | |
Increase in cash and cash equivalents |
11,672 | 2,854 | 14,556 | |||||||
Cash and cash equivalents, beginning of period |
27,725 | 24,871 | 10,315 | |||||||
| | | | | | | | | | | |
Cash and cash equivalents, end of period |
$ | 39,397 | $ | 27,725 | $ | 24,871 | ||||
| | | | | | | | | | | |
| | | | | | | | | | | |
| | | | | | | | | | | |
Supplementary cash flow information: |
||||||||||
Cash paid for income taxes |
$ | 343 | $ | 22,579 | $ | 1,738 | ||||
Cash received for income tax refunds |
$ | 95 | $ | 99 | $ | 11 | ||||
Cash paid for interest expense |
$ | 242 | $ | 278 | $ | 154 | ||||
Supplementary non-cash investing and financing activities: |
||||||||||
Stock issued as consideration for acquisition |
$ | — | $ | 1,474 | $ | — | ||||
Stock receivable for settlement of StraTech acquisition |
$ | — | $ | — | $ | 2,647 | ||||
Receivable due from seller of Bear Data |
$ | — | $ | 741 | $ | — | ||||
See Note 2 for non-cash information on the Company's acquisitions |
||||||||||
The accompanying notes are an integral part of these financial statements.
49
DATALINK CORPORATION
NOTES TO CONSOLIDATED FINANCIAL STATEMENTS
1. Summary of Significant Accounting Policies:
Description of Business:
Datalink Corporation provides solutions and services that help make data centers more efficient, manageable and responsive to changing business needs. Focused on midsize and large companies, we help companies migrate from physical to virtual data centers, ensure data protection and optimize enterprise networks. We derive our revenues principally from designing, installing and supporting data center solutions. Our solutions and services span four areas: cloud; data center transformation; next-generation technology; and security. We are frequently engaged to consult and provide assistance in the installation of data center solutions and to provide support services subsequent to the installation.
Recently Issued and Adopted Accounting Standard:
In February 2016, the FASB issued Accounting Standards Update 2016-02, Leases (Topic 842), which is the final standard on the accounting for leases. ASU 2016-02 was issued in three parts: (a) Section A, "Leases: Amendments to the FASB Accounting Standards Codification®," Section B, "Conforming Amendments Related to Leases: Amendments to the FASB Accounting Standards Codification®," and Section C, "Background Information and Basis for Conclusions." While both lessees and lessors are affected by the new guidance, the effects on lessees are much more significant. The most significant change for lessees is the requirement under the new guidance to recognize right-of-use assets and lease liabilities for all leases not considered short-term leases. By definition, a short-term lease is one in which: (a) the lease term is 12 months or less and (b) there is not an option to purchase the underlying asset that the lessee is reasonably certain to exercise. For short-term leases, lessees may elect an accounting policy by class of underlying asset under which right-of-use assets and lease liabilities are not recognized and lease payments are generally recognized as expense over the lease term on a straight-line basis. This change will result in lessees recognizing right-of-use assets and lease liabilities for most leases currently accounted for as operating leases under the legacy lease accounting guidance. For many entities, this could significantly affect the financial ratios they use for external reporting and other purposes, such as debt covenant compliance. The ASU is not effective until 2019 for calendar year public business entities and 2020 for all other calendar year entities. We are currently determining our implementation approach for this standard and assessing the impact it may have on our consolidated financial statements.
In January 2016, the FASB issued Accounting Standards Update 2016-01, Financial Instruments—Overall (Subtopic 825-10): Recognition and Measurement of Financial Assets and Financial Liabilities, which is the final standard on the recognition and measurement of financial instruments. The ASU applies to all entities that hold financial assets or owe financial liabilities and represents the finalization of just one component of the FASB's broader financial instruments project. The most far-reaching ramification of the ASU is the elimination of the available-for-sale classification for equity securities and a new requirement to carry those equity securities with readily determinable fair values at fair value through net income. Other notable changes brought about by the ASU involve: (a) applying a practicability exception from fair value accounting to equity securities that do not have a readily determinable fair value, (b) assessing the need for a valuation allowance for a deferred tax asset related to an available-for-sale debt security, (c) applying the fair value option to liabilities and the treatment of changes in fair value attributable to instrument-specific credit risk and (d) adding disclosures and eliminating certain disclosures. The ASU is not effective until 2018 for calendar year public business entities, certain provisions can be early adopted by public business entities in financial statements that have not been issued, and by other entities, in financial statements that have not been made available
50
for issuance. We are currently determining our implementation approach for this standard and assessing the impact it may have on our consolidated financial statements.
In November 2015, the FASB issued Accounting Standards Update 2015-17, Balance Sheet Classification of Deferred Taxes, which simplifies the presentation of deferred tax assets. The updated guidance requires that deferred tax assets and liabilities be classified as noncurrent in a classified balance sheet. The effective date for the standard is for fiscal year and interim periods within those years beginning after December 15, 2016. Early adoption is permitted and the ASU allows for either retrospective or prospective application. We early adopted the ASU in the fourth quarter of 2015 with retrospective application and prior period amounts were reclassified. For 2014, our long term deferred tax asset of $6.9 million has been netted with our current deferred tax liability of $2.3 million for a net deferred tax asset of $4.6 million.
In September 2015, the FASB issued Accounting Standards Update 2015-16, Accounting for Measurement Period Adjustments in a Business Combination ("ASU 2015-16"), which requires that an acquirer recognize adjustments to provisional amounts that are identified during the measurement period in the reporting period in which the adjustment amounts are determined. ASU 2015-16 will be effective for annual and interim reporting periods beginning after December 15, 2015, although early adoption is permitted. We do not expect that the adoption of ASU 2015-16 will have a significant impact on our consolidated financial statements.
In July 2015, the FASB issued Accounting Standards Update 2015-11, Simplifying the Measurement of Inventory, which simplifies the subsequent measurement of inventory by replacing the lower of cost or market test with a lower of cost or net realizable value (NRV) test. NRV is calculated as the estimated selling price less reasonably predictable costs of completion, disposal and transportation. This pronouncement is effective for fiscal years and for interim periods within those fiscal years beginning after December 15, 2016, and prospective adoption is required. We currently do not anticipate the adoption of this standard will have a material impact on our consolidated financial statements.
In July 2015, the FASB deferred the effective date of guidance that was originally issued in May 2014 in Accounting Standards Update 2014-09, Revenue from Contracts with Customers ("ASU 2014-09"). The standard outlines a single comprehensive model for entities to use in accounting for revenue arising from contracts with customers and supersedes most current revenue recognition guidance. ASU 2014-09 is intended to provide a more robust framework for addressing revenue issues; improve comparability of revenue recognition practices across entities, industries, jurisdictions and capital markets; and provide more useful information to users of financial statements through improved revenue disclosure requirements. The provisions of ASU 2014-09 will now be effective for interim and annual periods beginning after December 15, 2017. We are currently determining our implementation approach for this standard and assessing the impact it may have on our consolidated financial statements.
In June 2015, the FASB issued Accounting Standards Update 2015-10, "Technical Corrections and Improvements," which makes minor amendments to the FASB Accounting Standards Codification. The technical corrections are divided into four main categories: amendments to align codification wording with that in the pre-codification standards; corrections to references and clarification of guidance to avoid misapplication and misinterpretation; minor edits to simplify the codification and thereby improve its usefulness; and minor enhancements to codification guidance that are not expected to have a significant effect on current practice. The provisions of ASU 2015-10 are effective for fiscal years beginning after December 15, 2015. We do not expect that the adoption of ASU 2015-10 will have significant impact on our consolidated financial statements.
In April 2015, the FASB issued Accounting Standards Update 2015-05, Customer's Accounting for Fees in a Cloud Computing Arrangement ("ASU 2015-05"), related to cloud computing arrangements. ASU 2015-05 sets forth guidance on accounting for fees paid in a cloud computing arrangement and
51
specifically outlines how to determine whether a cloud computing arrangement contains a software license or is solely a service contract. ASU 2015-05 will be effective for annual and interim reporting periods beginning after December 15, 2015 and permits early adoption. We currently do not anticipate that the adoption of this standard will have a material impact on our consolidated financial statements.
In January 2015, the FASB issued Accounting Standards Update 2015-01, Simplifying Income Statement Presentation by Eliminating the Concept of Extraordinary Items, an update to ASC Topic 225—Income Statement ("ASU 2015-01"), which eliminates from accounting principles generally accepted in the United States the concept of extraordinary items. Subtopic 225-20, Income Statement—Extraordinary and Unusual Items, required that an entity separately classify, present, and disclose extraordinary events and transactions. Presently, an event or transaction is presumed to be an ordinary and usual activity of the reporting entity unless evidence clearly supports its classification as an extraordinary item. ASU 2015-01 is effective for annual periods beginning after December 15, 2015. An entity has the option to adopt the changes earlier provided that the guidance is applied from the beginning of the fiscal year of adoption. We currently do not anticipate the adoption of this standard will have a material impact on our consolidated financial statements.
In June 2014, the FASB issued Accounting Standards Update 2014-12, Compensation—Stock Compensation (Topic 718): Accounting for Share-Based Payments When the Terms of an Award Provide that a Performance Target Could be Achieved after the Requisite Service Period ("ASU 2014-12"), which requires that a performance target that affects vesting, and that could be achieved after the requisite service period, be treated as a performance condition. Thus, the performance target should not be reflected in estimating the grant date fair value of the award. This update further clarifies that compensation cost should be recognized in the period in which it becomes probable that the performance target will be achieved and should represent the compensation cost attributable to the period(s) for which the requisite service has already been rendered. The provisions of this ASU are effective for interim and annual periods beginning after December 15, 2015. Entities can apply the amendment either a) prospectively to all awards granted or modified after the effective date or b) retrospectively to all awards with performance targets that are outstanding as of the beginning of the earliest annual period presented in the financial statements and to all new or modified awards thereafter. We currently do not anticipate the adoption of this standard will have a material impact on our consolidated financial statements.
Use of Estimates:
The preparation of financial statements in conformity with accounting principles generally accepted in the United States of America requires our management to make estimates and assumptions that affect the reported amounts of assets and liabilities and disclosure of contingent assets and liabilities at the date of the financial statements and the reported amounts of revenues and expenses during the reporting period. Significant items subject to estimates and assumptions include the reserve for doubtful accounts, reserve for obsolete and slow moving (excess) inventory and impairment analysis of goodwill and long-lived assets and fair value of assets and liabilities acquired in business combinations. Actual results could differ from those estimates.
Cash and Cash Equivalents:
Cash equivalents consist principally of money market funds with original maturities of three months or less, are readily convertible to cash and are stated at cost, which approximates fair value. We maintain our cash in bank deposit and money market accounts which, at times, may exceed federally insured limits. In addition, we have cash in foreign bank accounts of approximately $7.4 million and $64,000, respectively, at December 31, 2015 and 2014. We have not experienced any losses in such accounts.
52
Short term Investments:
Our short term investments consist principally of commercial paper, corporate bonds and interest-bearing CDs. We categorize these investments as trading securities and record them at fair value. We classify investments with maturities of 90 days or less from the date of purchase as cash equivalents; investments with maturities of greater than 90 days from the date of purchase but less than one year generally as short term investments; and investments with maturities of greater than one year from the date of purchase generally as long term investments.
Accounts Receivable:
We carry accounts receivable at original invoice amount less an estimate made for doubtful receivables based on a review of all outstanding amounts on a monthly basis. Management determines the allowance for doubtful accounts by regularly evaluating individual client receivables and considering a client's financial condition and credit history and current economic conditions. We write off accounts receivable when deemed uncollectible, which is generally in excess of a year past due provided it has no additional information to suggest we should continue to expect client payment. We record recoveries of accounts receivable previously written off when received.
We recorded accounts receivable net of the reserve for doubtful accounts of $422,000 and $460,000 at December 31, 2015 and 2014, respectively.
Concentration of Credit Risk:
We have no clients that comprised more than 10% of our net sales in 2015, 2014, or 2013. However, our top five clients collectively accounted for 13%, 7%, and 10% of its 2015, 2014, and 2013 revenues, respectively.
Inventories:
Inventories, including inventories shipped but not installed, principally consist of data storage products and components, valued at the lower of cost or market with cost determined on a first-in, first-out (FIFO) method. We reduced inventories for obsolete and slow moving reserves by $102,000 and $87,000 at December 31, 2015 and 2014, respectively.
Property and Equipment:
We state property and equipment, including purchased software, at cost. We provide for depreciation and amortization by charges to operations using the straight-line method over the estimated useful lives of the assets (ranging from 2 to 10 years). We amortize leasehold improvements on a straight-line basis over the shorter of their estimated useful lives or the underlying lease term. We remove the costs and related accumulated depreciation and amortization on asset disposals from the
53
accounts and include any gain or loss in operating expenses. We capitalize major renewals and betterments, but charge maintenance and repairs to current operations when incurred.
| |
December 31, | ||||||
|---|---|---|---|---|---|---|---|
| |
2015 | 2014 | |||||
| |
(in thousands) |
||||||
Property and equipment: |
|||||||
Construction in process |
$ | 411 | $ | 445 | |||
Leasehold improvements |
2,454 | 2,479 | |||||
Furniture and fixtures |
1,122 | 2,725 | |||||
Equipment |
7,774 | 9,041 | |||||
Computers and software |
4,943 | 6,601 | |||||
| | | | | | | | |
|
16,704 | 21,291 | |||||
Less accumulated depreciation and amortization |
(8,741 | ) | (14,047 | ) | |||
| | | | | | | | |
|
$ | 7,963 | $ | 7,244 | |||
| | | | | | | | |
| | | | | | | | |
| | | | | | | | |
Goodwill:
We assess the carrying amount of our goodwill for potential impairment annually or more frequently if events or a change in circumstances indicate that impairment may have occurred. We have only one operating segment and reporting unit, as we have only one component that earns revenues and incurs expenses for which discrete financial information is available and reviewed by our chief operating decision maker for purposes of allocating resources and assessing performance. Our measurement date is December 31st of each year.
Testing for goodwill impairment is a two-step process. The first step screens for potential impairment. If there is an indication of possible impairment, we must complete the second step to measure the amount of impairment loss, if any. The first step of the goodwill impairment test, used to identify potential impairment, compares the fair value of our reporting unit (our company as a whole) with the carrying value of our net assets. If fair value is below the carrying value of our net assets, we perform the second step of the goodwill impairment test to measure the amount of impairment loss we record, if any. We consider goodwill impairment test estimates critical due to the amount of goodwill recorded on our balance sheet and the judgment required in determining fair value amounts. At each of December 31, 2015 and 2014, we determined that our goodwill was not impaired.
Historically, our market capitalization has been well above the carrying value of our net assets and there has been no indication of potential impairment. However, during the third and fourth quarters of 2015, the price of our common stock was significantly impacted by the volatility in the U.S. equity markets. The price of our common stock reached a low of $5.34 during the third quarter and $5.70 during the fourth quarter of 2015, respectively, and closed at $6.80 on December 31, 2015. These lows in the price of our common stock coincided with fluctuations in the equity markets for the second half of 2015. As of December 31, 2015, our market capitalization was approximately $153.9 million as compared to our stockholders' equity at December 31, 2015 of $164.8 million.
We believe that our fair value exceeds our market capitalization because our fair value should include a control premium. A control premium is the amount that a buyer is willing to pay over the current market price of a company as indicated by the traded price per share (i.e. market capitalization), in order to acquire a controlling interest. The premium is justified by the expected synergies, such as the expected increase in cash flow resulting from cost savings and revenue enhancements. We utilized data from Capital IQ for all transactions involving U.S. companies with the same industry classification as us during the past 12 months. The data indicated a wide range of control premiums and we selected 30 percent as an appropriate control premium in determining fair value.
54
Applying a control premium of 30 percent resulted in a controlling basis value of $200 million, which is in excess of our stockholders' equity at December 31, 2015 of $164.8 million and indicates there is not an impairment of goodwill as of December 31, 2015.
Valuation of Long-Lived Assets:
We perform an impairment test for finite-lived assets and other long-lived assets, such as property and equipment and finite-lived intangible assets, whenever events or changes in circumstances indicate that we may not recover the carrying value of such assets. We recognize impairment based on the difference between the fair value of the asset and its carrying value. We generally measures fair value based on discounted cash flow analyses. For 2015 and 2014, we identified no triggering events that required us to evaluate the impairment of our long-lived assets.
Stock Compensation Plans:
We utilize the fair value method of accounting to account for share-based compensation awards. This requires us to measure and recognize in our statements of operations the expense associated with all share-based payment awards made to employees and directors based on estimated fair values. We use the Black-Scholes model to determine the fair value of share-based payment awards. Stock-based compensation expense was $5.4 million, for 2015, and $4.0 million for 2014, and 2013, respectively.
Income Taxes:
We calculate income taxes using the asset and liability method of accounting for income taxes. Under the liability method, we record deferred income taxes to reflect the tax consequences in future years of temporary differences between the tax bases of assets and liabilities and their financial reporting amounts using enacted tax rates for the years in which we expect these items to affect taxable income. We establish valuation allowances when necessary to reduce deferred tax assets to the amount we expect are more likely than not to realize. Income tax expense is the tax payable for the period and the change during the period in deferred tax assets and liabilities.
Uncertain Tax Positions:
We utilize a two-step approach to recognizing and measuring uncertain tax positions (tax contingencies). The first step evaluates the tax position for recognition by determining if the weight of available evidence indicates it is more likely than not that we will sustain the position on audit, including resolution of related appeals or litigation processes. The second step measures the tax benefit as the largest amount more than 50% likely of being realized upon ultimate settlement. Included in the balance of unrecognized tax benefits at December 31, 2015 are potential benefits of $209,000 that if recognized, would affect the effective tax rate. We do not anticipate that the total amount of unrecognized tax benefits as of December 31, 2015 will change significantly in the next 12 months. At December 31, 2014, included in the balance of unrecognized tax benefits are potential benefits of $236,000 that if recognized, would affect the effective tax rate. We have no accrued interest and penalties as of December 31, 2015 and 2014. To the extent we accrue interest and penalties, we recognize accrued interest and penalties related to unrecognized tax benefits as a component of income tax expense.
Revenue Recognition:
Product Sales. We sell software and hardware products on both a "free-standing" basis without any services and as data center solutions bundled with installation and configuration services ("bundled arrangements"). Under either arrangement, we recognize revenue from the sales of products, primarily hardware and essential software, when persuasive evidence of an arrangement exists, shipment has
55
occurred and title has transferred, the sales price is fixed or determinable, and collection of the resulting receivable is reasonably assured. In client arrangements where a formal acceptance of products is required by the client, revenue is recognized upon meeting such acceptance criteria.
Service Sales. In addition to installation and configuration services provided by us or third party vendors as part of its bundled arrangements, our service sales include postcontract customer support ("PCS") and consulting services. On our balance sheet, deferred revenue relates to PCS for which customers have paid or have been invoiced but for which we have not yet recognized the applicable services revenue. Revenue from extended service contracts is recognized ratably over the contract term, generally one to three years. Professional services are offered under time and material or fixed fee-based contracts or as part of multiple-element arrangements. Professional services revenue is recognized as services are performed when sold on a stand-alone basis. Our service sales include customer support contracts and consulting services.
Postcontract Customer Support Contracts. When we sell hardware and/or software products to our clients, we enter into service contracts with them. These contracts are support service agreements. A majority of the time, our internal support desk first assists the client by performing an initial technical triage to determine the source of the problem and whether we can direct the client on how to fix the problem. If our internal support desk cannot solve the problem, it transfers the client to the manufacturer or its designated service organization.
When we do not provide "first call" assistance, usually because the manufacturer has not authorized us to do so, our clients call the manufacturer or its designated service organization directly for both the initial technical triage and any follow-up assistance. If the client calls us first, we transfer the client to the third party.
In both scenarios above, we purchase third party support contracts from the manufacturers for their services. In accordance with our agreements, and consistent with standard industry practice, we prepay the third party based on its "list price" for maintenance on the specific hardware or software products we have sold, less our negotiated discounts with the third party. Terms are generally net 30 days. If we provide the initial "first call" services, our discounts off of list price are more substantial. In all cases, we are the primary obligor in the transaction. The client ultimately holds us responsible for fulfillment of the third party support contracts and we bear credit risk in the event of nonpayment by the client.
We report customer support contract revenue on a gross basis because there are sufficient indicators in the aggregate that we should be reporting these revenues on a gross basis in accordance with ASC Topic 605-45, Reporting Revenue Gross as a Principle versus Net as an Agent. We usually present quotations for maintenance arrangements to our clients without differentiating as to whether we, or a third party, are providing the service. Accordingly, we are, from our clients' perspectives, the primary obligor on our maintenance arrangements. We directly enter into the agreements with our clients to provide maintenance services. In all cases, we set the price to our client for the maintenance arrangements, whether or not we provide our first call services, and bill our clients for the maintenance arrangement. We owe various third parties regardless of whether we collect from our client. We are also contractually obligated to provide or arrange to provide these underlying support services to our clients in the unlikely event that the manufacturer or its designated service organization fails to perform according to the terms of our contract.
When we sell a service contract as part of a bundled arrangement, we use vendor specific objective evidence ("VSOE") to allocate revenue to the service contract element. In all cases, we defer revenues and incremental direct costs resulting from obtaining our service contracts and amortize them into operations over the term of the contracts, which are generally twelve months. We defer customer support costs as allowed under ASC Topic 605-10-S99 based on the guidance in ASC Topic 605-20. The deferred costs we capitalize consist of direct and incremental costs we prepay to
56
third parties for direct support to our clients under our contract terms. We defer our customer support contract revenues and their related costs because significant obligations remain after contract execution. For example, we provide routine help desk assistance to our clients and assist them in contacting our vendors for additional support services.
Consulting Services. Some clients engage us to analyze their existing data center architectures and offer recommendations. Other clients engage us to assist them on-site with extended data center infrastructure projects, to support their data center environments and to help with long-term data center design challenges. For these types of consulting services that do not include the sale of hardware or software products, we recognize revenues as we perform these services.
Multiple Element Arrangements. In October 2009, the FASB amended the Accounting Standards Codification ("ASC") as summarized in Accounting Standards Update ("ASU") No. 2009-14, Software (Topic 985): Certain Revenue Arrangements That Include Software Elements, and ASU No. 2009-13, Revenue Recognition (Topic 605): Multiple-Deliverable Revenue Arrangements. ASU 2009-14 amended industry specific revenue accounting guidance for software and software related transactions to exclude from its scope tangible products containing software components and non-software components that function together to deliver the product's essential functionality, or what we refer to as essential software. We also sell non-essential software, which continues to be in the scope of ASC 985-605. ASU 2009-13 amended the accounting for multiple-element arrangements to provide guidance on how the deliverables in an arrangement should be separated and eliminates the use of the residual method. ASU 2009-13 also required an entity to allocate revenue using the relative selling price method.
ASU 2009-13 establishes a hierarchy of evidence to determine the stand-alone selling price of a deliverable based on VSOE, third-party evidence ("TPE"), and the best estimate of selling price ("BESP"). If VSOE is available, it would be used to determine the selling price of a deliverable. If VSOE is not available, the entity would determine whether TPE is available. If so, TPE must be used to determine the selling price. If TPE is not available, then the BESP would be used.
In certain instances, we are not able to establish VSOE for all deliverables in an arrangement with multiple elements. This may be due to infrequent sales of each element separately, not pricing products within a narrow range, or only having a limited sales history. We have not consistently established VSOE for any of our products or services, except for PCS.
When VSOE cannot be established, we attempt to determine the standalone selling price for each element based on TPE. TPE is determined based on competitor prices for similar deliverables when sold separately. Generally, our strategy differs from that of our peers and our offerings contain a significant level of customization and differentiation such that the comparable pricing of products with similar functionality cannot be obtained. Furthermore, we are unable to reliably determine what similar competitor products' selling prices are on a stand-alone basis. Therefore, we are typically not able to determine TPE.
Since we are typically unable to determine VSOE or TPE, we use BESP in our allocation of the arrangement consideration where VSOE or TPE do not exist. Therefore, revenue from these multiple-element arrangements is allocated based on BESP, except for PCS which is allocated based on VSOE. The objective of BESP is to determine the price at which we would transact a sale if the product or service were sold on a stand-alone basis. BESP is generally used for offerings that are not typically sold on a stand-alone basis or for new or highly customized offerings. We determine BESP for product or service using a cost-plus margin approach. When establishing the methodology used to calculate BESP we also consider multiple factors, including, but not limited to, geographies, market conditions, competitive landscape, internal costs, gross margin objectives and pricing practices. The determination of BESP is made through consultation with and formal approval by management.
57
We regularly review VSOE, TPE and BESP and maintain internal controls over the establishment and updates of these estimates. We limit the amount of revenue recognized for delivered elements to the amount that is not contingent on the future delivery of products or services, future performance obligations or subject to client-specified return or refund privileges.
We evaluate each deliverable in an arrangement to determine whether it represents a single unit of accounting. The delivered item constitutes a separate unit of accounting when it has stand-alone value and there are no client-negotiated refunds or return rights for the delivered elements. If the arrangement includes a client-negotiated refund or return right relative to the delivered item and the delivery and performance of the undelivered item is considered probable and substantially in our control, the delivered element would also constitute a separate unit of accounting. In instances when the aforementioned criteria are not met, the deliverable is combined with the undelivered elements and revenue recognition is determined for the combined unit as a single unit of accounting. Allocation of the consideration is determined at arrangement inception on the basis of each unit's relative selling price.
Our multiple-element product offerings include networking hardware with embedded software products, professional services, and PCS, which are considered separate units of accounting. Pursuant to the guidance in ASU 2009-13, when a sales arrangement contains multiple elements, such as products, essential software, PCS and/or professional services, we will allocate revenues to each element based on the aforementioned selling price hierarchy.
In multiple-element arrangements that include software that is not essential to the functionality of the products, revenue is initially allocated to each separate unit of accounting using the relative selling prices of each of the deliverables in the arrangement based on the aforementioned selling price hierarchy. Since non-essential software deliverables are in the scope of ASC 985-605, VSOE must exist to account for the non-essential software deliverables as separate units of accounting from one another and further allocate the originally allocated non-essential software fee among the individual non-essential software deliverables. Since we were only able to establish VSOE for PCS, the amount allocated to the other non-essential software deliverables would be based on the residual method of allocation using VSOE for PCS. This allocated revenue is recognized once all non-essential software deliverables other than PCS are delivered.
In 2013, we began recognizing revenue on certain new professional service contracts that include milestones using a proportional performance method of revenue recognition. Revenues from these fixed price professional service contracts are recognized as services are performed based on the achievement of specified milestones within the contracts and when the client acknowledges that such criteria have been satisfied. We invoice our client on these projects as agreed-upon project milestones are achieved and accepted by the client. We recognized approximately $11.1 million, $6.5 million and $1.1 million, respectively, of services revenues under this method during 2015, 2014 and 2013.
Net Earnings Per Share:
We compute basic net earnings per share using the weighted average number of shares outstanding. Diluted net earnings per share include the effect of common stock equivalents, if any, for each period. Diluted per share amounts assume the conversion, exercise or issuance of all potential
58
common stock instruments unless their effect is anti-dilutive. The following table computes basic and diluted net earnings per share:
| |
Year Ended December 31, | |||||||||
|---|---|---|---|---|---|---|---|---|---|---|
| |
2015 | 2014 | 2013 | |||||||
| |
(in thousands, except per share data) |
|||||||||
Net earnings |
$ | 4,699 | $ | 11,081 | $ | 10,045 | ||||
| | | | | | | | | | | |
| | | | | | | | | | | |
| | | | | | | | | | | |
Basic: |
||||||||||
Weighted average common shares outstanding |
21,941 | 21,598 | 19,078 | |||||||
| | | | | | | | | | | |
| | | | | | | | | | | |
| | | | | | | | | | | |
Net earnings per share—basic |
$ | 0.21 | $ | 0.51 | $ | 0.53 | ||||
| | | | | | | | | | | |
| | | | | | | | | | | |
| | | | | | | | | | | |
Diluted: |
||||||||||
Shares used in the computation of basic net earnings per share |
21,941 | 21,598 | 19,078 | |||||||
Employee and non-employee director stock options |
134 | 170 | 163 | |||||||
Restricted stock that has not vested |
289 | 271 | 252 | |||||||
| | | | | | | | | | | |
Shares used in the computation of diluted net earnings per share |
22,364 | 22,039 | 19,493 | |||||||
| | | | | | | | | | | |
| | | | | | | | | | | |
| | | | | | | | | | | |
Net earnings per share—diluted |
$ | 0.21 | $ | 0.50 | $ | 0.52 | ||||
| | | | | | | | | | | |
| | | | | | | | | | | |
| | | | | | | | | | | |
We exclude the following restricted stock grants that have not vested from the computation of diluted earnings per share as their effect would have been anti-dilutive:
| |
Year Ended December 31, | |||||||||
|---|---|---|---|---|---|---|---|---|---|---|
| |
2015 | 2014 | 2013 | |||||||
Non-vested common stock |
73,427 | 37,163 | 61,000 | |||||||
Fair Value of Financial Instruments:
Fair value is the price that would be received from selling an asset or paid to transfer a liability in an orderly transaction between market participants at the measurement date. In determining fair value for assets and liabilities required or permitted to be recorded at fair value, we consider the principal or most advantageous market in which it would transact and the assumptions that market participants would use when pricing the asset or liability. We apply fair value measurements for both financial and nonfinancial assets and liabilities. We have no nonfinancial assets or liabilities that require measurement at fair value on a recurring basis as of December 31, 2015.
The fair value of our financial instruments, including cash and cash equivalents, short term investments, accounts receivable, leases receivable, accounts payable, leases payable, line of credit and accrued expenses, approximate cost because of their short maturities.
We use the three-level fair value hierarchy that prioritizes the inputs to valuation techniques used to measure fair values. The hierarchy gives the highest priority to unadjusted quoted prices in active markets for identical assets or liabilities (Level 1 measurements) and the lowest priority to unobservable inputs (Level 3 measurements). The three levels of the fair value hierarchy are described below:
- •
- Level 1—Unadjusted quoted prices available in active markets for the identical assets or liabilities at the
measurement date.
- •
- Level 2—Significant other observable inputs available at the measurement date, other than quoted prices included in Level 1, either directly or indirectly.
59
- •
- Level 3—Significant unobservable inputs that we cannot corroborate by observable market data and thus reflect the use of significant management judgment. We generally determine these values using pricing models based on assumptions its management believes other market participants would make.
The fair value hierarchy requires the use of observable market data when available. In instances in which the inputs used to measure fair value fall into different levels of the fair value hierarchy, we determine the fair value measurement based on the lowest level input that is significant to the fair value measurement in its entirety. Our assessment of the significance of a particular item to the fair value measurement in its entirety requires judgment, including the consideration of inputs specific to the asset or liability. The following table sets forth, by level within the fair value hierarchy, the accounting of our financial assets and/or liabilities at fair value on a recurring basis according to the valuation techniques we use to determine their fair value(s):
(In thousands)
|
Total at Fair Value |
Quoted Prices in Active Markets for Identical Assets (Level 1) |
Significant Other Observable Inputs (Level 2) |
Significant Unobservable Inputs (Level 3) |
|||||||||
|---|---|---|---|---|---|---|---|---|---|---|---|---|---|
At December 31, 2015: |
|||||||||||||
Cash and cash equivalents |
$ | 39,397 | $ | 39,397 | $ | — | $ | — | |||||
Short term investments |
20,579 | — | 20,579 | — | |||||||||
| | | | | | | | | | | | | | |
| | | | | | | | | | | | | | |
| | | | | | | | | | | | | | |
Total assets measured at fair value |
$ | 59,976 | $ | 39,397 | $ | 20,579 | $ | — | |||||
| | | | | | | | | | | | | | |
| | | | | | | | | | | | | | |
| | | | | | | | | | | | | | |
At December 31, 2014: |
|||||||||||||
Cash and cash equivalents |
$ | 27,725 | $ | 27,725 | $ | — | $ | — | |||||
Short term investments |
22,994 | 3,000 | 19,994 | — | |||||||||
| | | | | | | | | | | | | | |
| | | | | | | | | | | | | | |
| | | | | | | | | | | | | | |
Total assets measured at fair value |
$ | 50,719 | $ | 30,725 | $ | 19,994 | $ | — | |||||
| | | | | | | | | | | | | | |
| | | | | | | | | | | | | | |
| | | | | | | | | | | | | | |
Advertising Costs:
Advertising and promotion costs are charged to operations as incurred. Advertising and promotion costs included in sales and marketing expense for 2015, 2014, and 2013 were $777,000, $616,000, and $683,000, respectively.
2. Acquisitions:
Bear Data Solutions, Inc.
On October 18, 2014, we entered into an Agreement and Plan of Merger (the "Merger Agreement") with Bear Data. Bear Data is primarily an IT services firm, serving California-based and international clients from offices in San Francisco, San Jose, Irvine and San Diego. A significant portion of its revenues is derived from networking products including Cisco wireless, routing and core switches. The aggregate purchase price for the overall transaction was approximately $13.4 million, including a cash payment of $12.7 million, net of cash acquired, in connection with the merger (the "Preliminary Purchase Price"), which was partially offset by a net working capital receivable from the sellers of $741,000 resulting from the preliminary estimated net tangible asset adjustment as defined by the Merger Agreement. The Preliminary Purchase Price was subject to certain adjustments to reflect the difference, if any, between the net working capital at closing and target net working capital. An aggregate amount of $2.4 million of the Preliminary Purchase Price was placed into escrow to cover any post-closing adjustment to the Preliminary Purchase Price and indemnification obligations of the securityholders. Pursuant to the Merger Agreement, the sellers of Bear Data were obligated to pay us
60
an amount equal to the difference between the actual net tangible assets on the closing date and the sellers' good faith estimate of net tangible assets as set forth in the Merger Agreement. In January 2016, we served a notice of claim for indemnification to recover approximately $798,000 in losses for accounts receivable, accounts payable and taxes against the indemnity escrow fund. Resolution between us and the sellers of Bear Data in ongoing.
We entered into a Common Stock Purchase Agreement (the "Common Stock Purchase Agreement"), also dated as of October 18, 2014, by and among Datalink Corporation, Merger Sub, and three executive securityholders of Bear Data. Under the Common Stock Purchase Agreement, we issued 156,360 shares of our common stock with a value of approximately $1.5 million, net of illiquidity adjustments, to the three Bear Data executives. The $13.4 million aggregate purchase price for the overall transaction discussed above includes the $1.5 million issuance of shares to the executive securityholders of Bear Data. For this purpose, our common stock was valued at the volume-weighted average of the per share trading prices of our common stock as reported through Bloomberg (based on all trades in our common stock and not an average of daily averages) for the 20 consecutive full trading days ending one business day prior to closing. These shares had an aggregate value of $1.7 million, offset by a $192,000 illiquidity adjustment. 75% of the shares issued under the Common Stock Purchase Agreement were not transferable until the first anniversary of closing.
Under the acquisition method of accounting, we estimated the fair value of the assets acquired and liabilities assumed of Bear Data primarily using a discounted cash flow approach with respect to identified intangible assets and goodwill. We based this approach upon its estimates of future cash flows from the acquired assets and liabilities and utilized a discount rate consistent with the inherent risk associated with the acquired assets and liabilities assumed. As of December 31, 2014, the fair value of the acquired assets was provisional as we had not yet finalized net working capital adjustments. The total purchase price was allocated to Bear Data's net tangible and identifiable assets based on their estimated fair values as of October 18, 2014. Adjustments to provisional amounts during the measurement period that were the result of information that existed as of the acquisition date require the revision of comparative prior period financial information when reissued in subsequent financial statements. Accordingly, our 2014 consolidated balance sheet has been retroactively adjusted to account for those changes.
Bear Data filed its final stub period federal and state income tax returns for 2014 during the three months ended September 30, 2015. The final stub period returns reported taxable losses, which have been carried back to the full extent possible. As a result, we recorded a $916,000 reduction in goodwill and increase in net deferred tax assets. The changes did not impact our consolidated statements of operations.
61
The following table summarizes the final allocation of the purchase price including measurement period adjustments:
| |
(in thousands) | |||
|---|---|---|---|---|
Assets acquired at their fair value: |
||||
Accounts receivable, net |
$ | 15,650 | ||
Inventories shipped but not installed |
775 | |||
Short term deferred tax assets |
935 | |||
Equipment |
975 | |||
Finite-lived intangibles |
9,522 | |||
Goodwill |
9,320 | |||
Other assets |
257 | |||
| | | | | |
Total assets acquired |
37,434 | |||
Liabilities assumed at their fair value: |
||||
Accounts payable |
17,188 | |||
Leases payable |
229 | |||
Accrued expenses |
3,536 | |||
Long-term deferred tax liabilities |
3,041 | |||
| | | | | |
Total liabilities assumed |
23,994 | |||
| | | | | |
Net purchase price |
$ | 13,440 | ||
| | | | | |
| | | | | |
| | | | | |
The $9.5 million of finite-lived intangibles consisted of $370,000 of covenants not to compete, $890,000 of trademarks, $7.8 million of customer relationships and $452,000 of order backlog having estimated lives of three years, three years, six years, and six months, respectively. The indefinite-lived asset consisted of goodwill of approximately $9.3 million, which was not deductible for tax purposes. We are amortizing the covenants not to compete, trademarks, and order backlog using the straight line method. We are amortizing the customer relationships it acquired in the Bear Data acquisition over its useful life using an accelerated amortization method, to match the pattern in which the economic benefits of that asset are expected to be consumed.
The following table provides a reconciliation of the net purchase price for Bear Data as compared to the cash payment for purchase:
| |
(in thousands) | |||
|---|---|---|---|---|
Payment in cash for purchase |
$ | 16,173 | ||
Less cash acquired |
(3,466 | ) | ||
Less receivable due from Seller |
(741 | ) | ||
Plus value of shares issued |
1,474 | |||
| | | | | |
Net purchase price |
$ | 13,440 | ||
| | | | | |
| | | | | |
| | | | | |
Integration costs for 2015 include salaries, benefits and retention bonuses of exiting employees, some of whom assisted with the initial integration of Bear Data. In addition, transaction costs for 2015 include legal, audit, and other outside service fees necessary to complete our acquisition of Bear Data, which were expensed. Total integration and transaction costs were $61,000 and $1.0 million for the three and twelve months ended December 31, 2015, respectively.
Strategic Technologies, Inc.
On October 4, 2012, we purchased substantially all of the assets and liabilities of Strategic Technologies, Inc. ("StraTech") from StraTech and Midas Medici Group Holdings, Inc. StraTech is an
62
IT services and solutions firm that shares our focus on optimizing enterprise data centers and IT infrastructure through a common product and services portfolio designed to help clients increase business agility.
We estimated the fair value of the assets acquired and liabilities assumed of StraTech primarily using a discounted cash flow approach with respect to identified intangible assets and goodwill. We based this approach upon its estimates of future cash flows from the acquired assets and liabilities and utilized a discount rate consistent with the inherent risk associated with the acquired assets and liabilities assumed.
The following table summarizes the final allocation of the purchase price including measurement period adjustments:
| |
(in thousands) | |||
|---|---|---|---|---|
Assets acquired at their fair value: |
||||
Accounts receivable, net |
$ | 9,539 | ||
Deferred revenue costs |
8,521 | |||
Equipment |
432 | |||
Finite-lived intangibles |
15,920 | |||
Goodwill |
5,334 | |||
Other assets |
628 | |||
| | | | | |
Total assets acquired |
40,374 | |||
Liabilities assumed at their fair value: |
||||
Accounts payable |
17,599 | |||
Deferred revenue |
10,289 | |||
Accrued expenses |
567 | |||
Other liabilities |
29 | |||
| | | | | |
Total liabilities assumed |
28,484 | |||
| | | | | |
Net purchase price |
$ | 11,890 | ||
| | | | | |
| | | | | |
| | | | | |
The fair value of the assets acquired included a finite-lived intangible asset consisting of customer relationships that have an estimated life of five years and an indefinite-lived asset consisting of goodwill of approximately $5.0 million which will be deductible for tax purposes over a 15-year period. We are amortizing the finite-lived intangible asset we acquired in the StraTech acquisition over its useful life using an accelerated amortization method, to match the pattern in which the economic benefits of that asset are expected to be consumed. We paid a premium over the fair value of the net tangible and identified intangible assets acquired (i.e. goodwill) because this acquisition expanded our market share and physical presence across the Eastern seaboard of the United States and allows us to diversify its product offerings from certain manufacturers and expand its high-margin professional and managed services business lines. We expect to experience operational synergies and efficiencies through combined general and administrative corporate functions.
The following table provides a reconciliation of the net purchase price for StraTech as compared to the cash payment for purchase:
| |
(in thousands) | |||
|---|---|---|---|---|
Payment in cash for purchase |
$ | 13,172 | ||
Less receivable due from seller |
(3,307 | ) | ||
Plus value of shares issued |
2,025 | |||
| | | | | |
Net purchase price |
$ | 11,890 | ||
| | | | | |
| | | | | |
| | | | | |
63
Integration costs for 2013 include salaries, benefits and retention bonuses of exiting employees, some of whom assisted with the initial integration of StraTech. Total integration and transaction costs were $95,000 during 2013.
3. Short-Term Investments:
The following table summarizes our short-term investments (in thousands):
| |
Amortized Cost |
Gross Unrealized Gains |
Gross Unrealized Losses |
Fair Value |
|||||||||
|---|---|---|---|---|---|---|---|---|---|---|---|---|---|
December 31, 2015 |
|||||||||||||
Commercial paper |
$ | 11,981 | $ | 9 | $ | 2 | $ | 11,988 | |||||
Corporate bonds |
8,701 | — | 110 | 8,591 | |||||||||
| | | | | | | | | | | | | | |
Total |
$ | 20,682 | $ | 9 | $ | 110 | $ | 20,579 | |||||
| | | | | | | | | | | | | | |
| | | | | | | | | | | | | | |
| | | | | | | | | | | | | | |
December 31, 2014 |
|||||||||||||
Commercial paper |
$ | 19,988 | $ | 6 | $ | — | $ | 19,994 | |||||
Interest-bearing CDs |
3,005 | — | 5 | 3,000 | |||||||||
| | | | | | | | | | | | | | |
Total |
$ | 22,993 | $ | 6 | $ | 5 | $ | 22,994 | |||||
| | | | | | | | | | | | | | |
| | | | | | | | | | | | | | |
| | | | | | | | | | | | | | |
Our $20.6 million of short-term investments at December 31, 2015 is comprised of commercial paper and corporate bonds with maturities within one year and interest rates ranging from 3.45% to 5.75%. Our $23.0 million of short term investments at December 31, 2014 was comprised of commercial paper and interest-bearing CDs with maturities within one year and interest rates at 0.5%.
4. Goodwill and Intangible Assets:
We had goodwill assets with a recorded value of $47.1 million as of December 31, 2015 and 2014, respectively. Goodwill activity is summarized as follows:
| |
(in thousands) | |||
|---|---|---|---|---|
January 1, 2013 |
$ | 37,780 | ||
Additions |
10,237 | |||
Subtractions |
(916 | ) | ||
| | | | | |
December 31, 2014 and 2015 |
$ | 47,101 | ||
| | | | | |
| | | | | |
| | | | | |
We have finite-lived intangible assets with a net book value of $9.3 million and $16.6 million as of December 31, 2015 and 2014, respectively. The change in the net carrying amount of intangibles during 2015 and 2014 is as follows:
| |
Year Ended December 31, |
||||||
|---|---|---|---|---|---|---|---|
| |
2015 | 2014 | |||||
| |
(in thousands) |
||||||
Beginning Balance |
$ | 16,603 | $ | 13,509 | |||
Recognized in connection with acquisitions |
— | 9,522 | |||||
Amortization |
(7,347 | ) | (6,428 | ) | |||
| | | | | | | | |
Ending Balance |
$ | 9,256 | $ | 16,603 | |||
| | | | | | | | |
| | | | | | | | |
| | | | | | | | |
64
Identified finite-lived intangible asset balances are summarized as follows:
| |
|
As of December 31, 2015 | As of December 31, 2014 | ||||||||||||||||||
|---|---|---|---|---|---|---|---|---|---|---|---|---|---|---|---|---|---|---|---|---|---|
| |
Amortizable Period (years) |
Gross Assets |
Accumulated Amortization |
Net Assets |
Gross Assets |
Accumulated Amortization |
Net Assets |
||||||||||||||
Customer relationships |
5-8 | $ | 36,943 | (28,440 | ) | $ | 8,503 | $ | 36,943 | (21,776 | ) | $ | 15,167 | ||||||||
Services agreement |
4 | 67 | (67 | ) | — | 67 | (67 | ) | — | ||||||||||||
Certification |
2 | 467 | (467 | ) | — | 467 | (467 | ) | — | ||||||||||||
Covenant not to compete |
3 | 848 | (627 | ) | 221 | 848 | (504 | ) | 344 | ||||||||||||
Trademarks |
3 | 1,153 | (621 | ) | 532 | 1,153 | (325 | ) | 828 | ||||||||||||
Order backlog |
3 months- 1 year |
2,614 | (2,614 | ) | — | 2,614 | (2,350 | ) | 264 | ||||||||||||
| | | | | | | | | | | | | | | | | | | | | | |
Total identified intangible assets |
$ | 42,092 | (32,836 | ) | $ | 9,256 | $ | 42,092 | (25,489 | ) | $ | 16,603 | |||||||||
| | | | | | | | | | | | | | | | | | | | | | |
| | | | | | | | | | | | | | | | | | | | | | |
| | | | | | | | | | | | | | | | | | | | | | |
Amortization expense related to finite-lived intangible assets for 2015, 2014, and 2013 was $7.3 million, $6.4 million, and $7.3 million, respectively. The increase in amortization of intangibles expenses in 2015 as compared to 2014 is primarily due to our use of an accelerated amortization method in amortizing the customer relationships acquired in the Bear Data acquisition. The finite-lived intangible assets we acquired in the Bear Data acquisition consisted of covenants not to compete, trademarks, customer relationships and order backlog having estimated lives of 3 years, 3 years, 6 years and three months, respectively. We are amortizing the covenants not to compete, trademarks, and order backlog acquired in the Bear Data acquisition using the straight line method. We are amortizing the customer relationships acquired in the Bear Data acquisition using an accelerated amortization method, to match the pattern in which the economic benefits are expected to be consumed. The decrease in amortization of intangibles expenses in 2014 as compared to 2013 is primarily due to our use of an accelerated amortization method in amortizing the customer relationships acquired in the StraTech acquisition. This decrease was partially offset by the acquisition of Bear Data. Expected amortization in each of the next five years is as follows:
| |
(in thousands) | |||
|---|---|---|---|---|
2016 |
$ | 5,157 | ||
2017 |
2,649 | |||
2018 |
900 | |||
2019 |
550 | |||
2020 |
— | |||
| | | | | |
|
$ | 9,256 | ||
| | | | | |
| | | | | |
| | | | | |
5. Income Taxes:
The reconciliation of the U.S. federal statutory tax rate to our effective income tax rate is as follows:
| |
2015 | 2014 | 2013 | |||||||
|---|---|---|---|---|---|---|---|---|---|---|
Tax expense at U.S. statutory rates |
35.0 | % | 35.0 | % | 35.0 | % | ||||
State tax expense, net of federal tax effect |
5.0 | 3.4 | 3.3 | |||||||
Meals and entertainment |
4.9 | 1.9 | 1.7 | |||||||
Gain on settlement related to StraTech acquisition |
0.0 | (3.8 | ) | — | ||||||
Non-deductible expenses and other |
2.8 | (0.3 | ) | (0.2 | ) | |||||
| | | | | | | | | | | |
Effective tax rate |
47.7 | % | 36.2 | % | 39.8 | % | ||||
| | | | | | | | | | | |
| | | | | | | | | | | |
| | | | | | | | | | | |
65
Net deferred tax assets consist of the following components as of December 31, 2015 and 2014:
| |
Year Ended December 31, |
||||||
|---|---|---|---|---|---|---|---|
| |
2015 | 2014 | |||||
| |
(in thousands) |
||||||
Deferred income tax assets: |
|||||||
Compensation accrual |
$ | 4,148 | $ | 3,823 | |||
Deferred revenue |
21,055 | 19,478 | |||||
Net operating loss and credits carryovers |
1,217 | 1,822 | |||||
Intangibles |
1,294 | — | |||||
Other |
631 | 692 | |||||
| | | | | | | | |
Gross deferred tax assets |
28,345 | 25,815 | |||||
| | | | | | | | |
Valuation allowance |
(40 | ) | (285 | ) | |||
| | | | | | | | |
Total deferred tax asset |
28,305 | 25,530 | |||||
Deferred income tax liabilities: |
|||||||
Deferred costs |
(17,124 | ) | (19,031 | ) | |||
Intangibles |
— | (59 | ) | ||||
Property and equipment |
(1,445 | ) | (1,095 | ) | |||
Other |
(559 | ) | (752 | ) | |||
| | | | | | | | |
Total deferred tax liabilities |
(19,128 | ) | (20,937 | ) | |||
| | | | | | | | |
Net deferred income tax assets |
$ | 9,177 | $ | 4,593 | |||
| | | | | | | | |
| | | | | | | | |
| | | | | | | | |
On November 20, 2015, the FASB issued Accounting Standards Update (ASU) 2015-17, "Balance Sheet Classification of Deferred Taxes," as part of the FASB's simplification initiative to reduce complexity in accounting standards. The new guidance requires that all deferred tax assets and liabilities for each jurisdiction, along with any valuation allowance, be classified as noncurrent on the balance sheet. The new guidance is effective for public businesses in fiscal years beginning after December 15, 2016. However, as early adoption is permitted as of the beginning of an interim or annual reporting period in which the ASU 2015-17 was issued, we decided to apply the new standard for the December 31, 2015 period. As the guidance allows for retrospective application of the new standard, prior period financial statements have been retrospectively adjusted. For 2014, our long term deferred tax asset of $6.9 million has been netted with our current deferred tax liability of $2.3 million for a net deferred tax asset of $4.6 million.
The tax expense for 2015, 2014, and 2013 consists of the following:
| |
Year Ended December 31, | |||||||||
|---|---|---|---|---|---|---|---|---|---|---|
| |
2015 | 2014 | 2013 | |||||||
| |
(in thousands) |
|||||||||
Current income tax expense: |
||||||||||
United States federal |
$ | 7,243 | $ | 6,591 | $ | 14,142 | ||||
State and local |
1,625 | 984 | 2,485 | |||||||
| | | | | | | | | | | |
Current income tax expense |
$ | 8,868 | $ | 7,575 | $ | 16,627 | ||||
| | | | | | | | | | | |
Deferred income tax benefit: |
||||||||||
United States federal |
$ | (3,828 | ) | $ | (1,200 | ) | $ | (8,886 | ) | |
State and local |
(756 | ) | (78 | ) | (1,099 | ) | ||||
| | | | | | | | | | | |
Deferred income tax benefit |
(4,584 | ) | (1,278 | ) | (9,985 | ) | ||||
| | | | | | | | | | | |
Income tax expense |
$ | 4,284 | $ | 6,297 | $ | 6,642 | ||||
| | | | | | | | | | | |
| | | | | | | | | | | |
| | | | | | | | | | | |
66
A reconciliation of the beginning and ending amounts of gross unrecognized tax benefits for 2015, 2014, and 2013 is presented in the table below:
| |
Year Ended December 31, |
|||||||||
|---|---|---|---|---|---|---|---|---|---|---|
| |
2015 | 2014 | 2013 | |||||||
| |
(in thousands) |
|||||||||
Gross unrecognized tax benefits at January 1 |
$ | 236 | $ | — | $ | — | ||||
Increases related to: |
||||||||||
Prior year income tax positions |
— | 236 | — | |||||||
Current year income tax positions |
— | — | — | |||||||
| | | | | | | | | | | |
Gross unrecognized tax benefits at December 31 |
$ | 236 | $ | 236 | $ | — | ||||
| | | | | | | | | | | |
| | | | | | | | | | | |
| | | | | | | | | | | |
Included in the balance of unrecognized tax benefits at December 31, 2015 are potential benefits of $209,000 that, if recognized, would affect the effective tax rate. We do not anticipate that the total amount of unrecognized tax benefits as of December 31, 2015 will change significantly in the next 12 months. We had no accrued interest and penalties as of December 31, 2015 and 2014. To the extent we accrue interest and penalties, we recognize accrued interest and penalties related to unrecognized tax benefits as a component of income tax expense.
In assessing the recoverability of deferred tax assets, management considers whether it is more likely than not that we will realize some portion or all of the deferred tax assets. The ultimate realization of deferred tax assets is dependent upon the generation of future taxable income during the periods in which those temporary differences become deductible. As of December 31, 2015, we had federal and state net operating carryforwards as a result of the Bear Data acquisition of approximately $2.7 million and $2.8 million, respectively, which will expire beginning in 2033 if not fully utilized. As of December 31, 2015, we had federal and state credit carryforwards as a result of the Bear Data acquisition of approximately $136,000 and $60,000, respectively, which will expire beginning in 2031 for federal purposes if not fully utilized. As of December 31, 2015, we had federal capital loss carryforwards as a result of the Bear Data acquisition of approximately $115,000 which will expire in 2017 if not fully utilized. Because we do not expect to generate capital gain income within this period, a full valuation allowance has been recorded on this deferred tax asset.
We file income tax returns in the U.S. federal jurisdiction and various state and foreign jurisdictions. As of December 31, 2015, we were no longer subject to federal income tax examinations for taxable years before 2012.
Our ability to utilize a portion of its net operating loss carryforwards to offset future taxable income may be subject to certain limitations under Section 382 of the Internal Revenue Code due to changes in our equity ownership. As a result of the acquisition of Bear Data in October 2014, utilization of U.S. net operating losses and tax credits of Bear Data are subject to annual limitations under Internal Revenue Code Section 382 and 383, respectively.
6. Operating Lease Commitments:
Our corporate headquarters, including our principal technical and support services operations, are located in an office and warehouse facility in Eden Prairie, Minnesota. As of December 31, 2015, our other 30 leased locations, housing sales and technical staff, were small to medium-sized offices. We have regional hubs located in the Northeast, South, Mid Central, North Central and West.
67
As of December 31, 2015, future minimum lease payments due under non-cancelable operating leases were as follows:
| |
Net Lease Obligations |
|||
|---|---|---|---|---|
| |
(in thousands) |
|||
2016 |
$ | 3,287 | ||
2017 |
2,803 | |||
2018 |
2,301 | |||
2019 |
1,955 | |||
2020 |
859 | |||
Thereafter |
1,465 | |||
| | | | | |
|
$ | 12,670 | ||
| | | | | |
| | | | | |
| | | | | |
Total rent expense, net of sublease income of $0, $38,500, and $34,000 in 2015, 2014, and 2013, respectively, is as follows:
| |
Year Ended December 31, | |||||||||
|---|---|---|---|---|---|---|---|---|---|---|
| |
2015 | 2014 | 2013 | |||||||
| |
(in thousands) |
|||||||||
Rent expense |
$ | 3,712 | $ | 3,040 | $ | 3,062 | ||||
| | | | | | | | | | | |
| | | | | | | | | | | |
| | | | | | | | | | | |
7. Employee Benefit Plan:
We have a defined contribution retirement plan for eligible employees. Employees may contribute up to 60% of their pretax compensation to the 401(k) portion of the plan. Since April 2006, we have matched 50% of an employee's contribution up to the first 6% of an employee's eligible compensation. The cost of our contributions to the 401(k) portion of the plan for 2015, 2014, and 2013 was $1.8 million, $1.6 million, and $1.4 million, respectively.
8. Line of Credit:
On July 17, 2013, we entered into a Credit Agreement ("Credit Agreement") with Castle Pines Capital LLC ("CPC"), an affiliate of Wells Fargo Bank, National Association ("Wells Fargo"). The Credit Agreement provided for a channel finance facility ("Floor Plan Line of Credit") and a revolving facility ("Revolving Facility" and, together with the Floor Plan Line of Credit, "Combined Facility") in a maximum combined aggregate amount of $40 million. On May 21, 2015, we entered into the Second Amendment to Credit Agreement (the "Amended Agreement"), which provides an increase to the Combined Facility for a maximum combined aggregate borrowing amount of $75 million. Under the Amended Agreement, borrowing under the Revolving Facility cannot exceed the lesser of (i) $75 million minus the amount outstanding under the Floor Plan Line of Credit or (ii) a borrowing base consisting of 85% of certain eligible accounts and 100% of channel financed inventory, subject to CPC's ability to impose reserves in the future. The Floor Plan Line of Credit will finance certain purchases of inventory by us from vendors approved by CPC, and the Revolving Facility may be used for working capital purposes and permitted acquisitions.
The amounts outstanding under the Revolving Facility bear interest at a per annum rate of 2.0% above Wells Fargo's one-month LIBOR rate (approximately 0.43% at December 31, 2015). Advances under the Floor Plan Line of Credit will not bear interest so long as they are paid by the applicable payment due date, and advances that remain outstanding after the applicable payment due date will bear interest at a per annum rate of LIBOR plus 4%. Under the Credit Agreement, we were obligated to pay quarterly to CPC an unused commitment fee equal to 0.50% per annum on the average daily
68
unused amount of the Combined Facility, with usage including the sum of any advances under either the Floor Plan Line of Credit or the Revolving Facility. The Amended Agreement eliminates the unused commitment fee. The Combined Facility and certain bank product obligations owed to Wells Fargo or its affiliates are secured by substantially all of our personal property. The Amended Agreement terminates on January 9, 2018, and we will be obligated to pay certain prepayment fees if the Credit Agreement is terminated prior to that date.
The Amended Agreement contains customary representations, warranties, covenants and events of default, including but not limited to, covenants restricting our ability to (i) grant liens on its assets, (ii) make certain fundamental changes, including merging or consolidating with another entity or making any material change in the nature of its business, (iii) make certain dividends or distributions, (iv) make certain loans or investments, (v) guarantee or become liable in any way on certain liabilities or obligations of any other person or entity, or (vi) incur certain indebtedness.
The Amended Agreement contains certain covenants regarding our financial performance, including (i) a minimum tangible net worth of at least $30 million and (ii) a minimum quarterly free cash flow requirement, which requires us to have free cash flow of at least $5 million at the end of each fiscal quarter for the trailing twelve-month period then ended, commencing December 31, 2014 and continuing at the end of each fiscal quarter thereafter.
Of the $75 million maximum borrowing amount available at December 31, 2015 under the Combined Facility, we have outstanding advances of $24.3 million and $27.7 million on the Floor Plan Line of Credit at December 31, 2015 and December 31, 2014, respectively, related to the purchase of inventory from certain vendors.
9. Stockholders' Equity:
Repurchase of Stock:
On September 14, 2015, our board of directors approved a new stock repurchase program authorizing the repurchase of shares of our common stock in the open market or in privately negotiated purchases, or both, at an aggregate purchase price of up to $10 million. The timing and amount of any share repurchases will be determined by our management based on market conditions and other factors. The share repurchase program is expected to be completed by December 31, 2016. Under this program, we may from time to time purchase our outstanding common stock in the open market at management's discretion, subject to share price, market conditions and other factors. The common stock repurchase program does not obligate us to repurchase any dollar amount or number of shares. During 2015, we repurchased 629,000 shares of our common stock at a total purchase price of $4.8 million under this program.
Stock Compensation Plans:
In May 2011, our shareholders approved our 2011 Incentive Compensation Plan ("2011 Plan"). The 2011 plan replaced our existing 2009 Incentive Compensation Plan ("2009 Plan") and 2000 Director Stock Option Plan (the "Director Plan"), each of which terminated upon approval of the 2011 Plan on May 12, 2011. We reserved up to 750,000 initial shares of our common stock for possible issuance under the 2011 Plan and 303,943 shares remaining available for future grants under the 2009 Plan. Awards under the 2011 Plan may consist of options (non-qualified and incentive stock options), stock appreciation rights, or SARs, restricted stock units, performance units, dividend equivalents, annual incentive awards and other share-based awards as determined by our compensation committee. The terms and conditions of each award are set in an award agreement as determined by the compensation committee.
69
On May 20, 2015, our shareholders approved an amendment to the 2011 Plan (the "2011 Plan") that increased the number of shares of common stock that may be issued pursuant to awards thereunder from 1,553,943 shares to 2,553,943 shares. As of December 31, 2015, there were 1,391,321 shares available for grant under the 2011 Plan.
Time-based Restricted Stock Grants under the Company's 2011 Plan:
Under the 2011 Plan, eligible employees may be awarded shares of restricted stock. These shares generally vest three to four years after issuance, subject to continuous employment and certain other conditions. In 2015, 2014, and 2013, we issued 298,000, 319,900, and 273,500 shares, respectively, of time-based restricted stock to our executive management and certain other employees. Restricted shares are valued at the closing price of our stock on the date of grant and are expensed over the vesting period. Unrecognized compensation expense related to the non-vested stock grants was $3.3 million at December 31, 2015 and is expected to be recognized through February 2019. Compensation expense related to these restricted stock grants was $3.2 million in 2015, $1.9 million in 2014, and $1.9 million in 2013.
Under the Deferred Stock Unit ("DSU") Master Agreements, each member of the board of directors may elect to receive DSUs with a fair value equivalent to a percentage of each quarterly installment of the annual cash retainer for non-employee directors to which that member would otherwise be entitled for service as a Datalink director during 2015. In addition, each member of the board of directors may elect to receive a DSU award equal to a percentage of the award of shares of Restricted Stock to which that member would otherwise have been entitled as the equity component of the 2015 annual retainer. The DSUs and DSU awards vest and become non-forfeitable on each of June 30, 2015, September 30, 2015, December 31, 2015 and March 31, 2016, provided the board member remains in service with us. We will issue one share in payment and settlement of each vested DSU subject to the Master DSU Agreement following a termination of that board member's service with Datalink.
In 2015, 2014, and 2013, we issued 40,684, 40,804, and 36,000 awards of fully vested common stock to members of the Board of Directors, respectively. Of the 40,684 shares of fully vested stock awarded to members of our Board of Directors during the year ended December 31, 2015, 16,684 shares were DSUs. Of the 40,804 shares of fully vested stock awarded to members of our Board of Directors during the year ended December 31, 2014, 15,646 shares were DSUs. Our non-employee directors receive 6,000 shares of restricted stock for their Board service. We issue the annual restricted stock grants on June 30 of each year and they vest one-quarter upon issuance and one-quarter on the following September 30, December 31, and March 31, respectively, provided that the director is still a member of the Board on that date. As of December 31, 2015, 9,000 shares of the 2015 restricted stock grant were not vested. The 2014 and 2013 awards to our directors have all vested. For 2015, 2014, and 2013, total compensation expense for these awards was approximately $347,000, $484,000, and $424,000, respectively.
Performance-based Restricted Stock Grants under the Company's 2011 Plan, 2009 Plan and Director Plan:
Under the 2011 Plan, we are able to grant performance-based awards of restricted stock to our employees. The purpose of the performance-based grants is to retain key employees and to align key management with shareholders' interests.
70
On March 4, 2015, we awarded 83,403 shares of restricted stock and 83,407 performance stock unit awards pursuant to our 2011 Plan to executive management. These shares vest as follows: the performance stock unit awards one-third, or 27,802 shares, upon achievement of 150% of the non-GAAP operating income target of $40.8 million for 2015 as certified by the compensation committee in 2016; one-third when we publicly announce 2016 earnings in 2017; and one-third when we publicly announce 2017 earnings in 2018. We did not achieve our 2015 non-GAAP operating income target, so these performance stock unit awards did not vest. The 83,403 restricted stock grant remaining, is subject to time-based vesting (one-half on the second anniversary of the grant date, one-quarter on the third anniversary of the grant date, and one-quarter on the fourth anniversary of the grant date), provided that the individual remains employed by us on these vesting dates. The total fair value of the shares that have not vested under this award is $2.0 million, comprised of $987,000 for the time-based awards and $988,000 for the performance-based awards. We are amortizing the $987,000 value of the time-based shares that have not vested as follows: (1) $493,500 through the second anniversary of the grant date (2) $246,750 over the three-year vesting period and (3) $246,750 over the four-year vesting period. For the performance-based shares, since the non-GAAP operating income target was not met no compensation expense related to these performance stock units will be amortized. Unrecognized compensation expense related to the time-based restricted stock grants in this award was $662,000 at December 31, 2015 and is expected to be recognized through February 2019. Compensation expense related to these restricted stock grants was $326,000 for the year ended December 31, 2015.
On February 11, 2015, we awarded 426,000 shares of restricted stock pursuant to our 2011 Plan to certain managers. These shares vest as follows: 95,500 shares vest in full upon each individual manager's achievement of gross profit or operating income objectives for 2015 and upon publicly announcing our 2015 results. The remaining 330,500 shares are subject to time-based vesting (one-third of this subtotal on the first anniversary of the grant date, one-third of this subtotal on the second anniversary of the grant date, and one-third of this subtotal on the third anniversary of the grant date), provided that the individual remains employed by us on these vesting dates. We are amortizing the $3.9 million fair value of the time-based awards as follows: (1) $1.3 million through the first anniversary of the grant date (2) $1.3 million over the two-year vesting period and (3) $1.3 million over the three-year vesting period. For the performance-based shares, the individual managers did not achieve their gross profit or operating income objectives for 2015 so these restricted stock grants did not vest. The total fair value of the shares that did not vest under this award was $1.1 million for the performance-based awards. For these performance-based shares, since the gross profit or operating income targets were not met, no compensation expense related to these performance-based restricted stock grants will be amortized. Unrecognized compensation expense related to the time-based restricted stock grants in this award was $1.7 million at December 31, 2015 and is expected to be recognized through February 2018. Compensation expense related to these restricted stock grants was $2.0 million for the year ended December 31, 2015.
On August 15, 2014, we awarded 15,000 shares of restricted stock pursuant to our 2011 Plan to one executive manager. These shares vest as follows: two-thirds, or 10,000 shares, upon achievement of 150% of the non-GAAP operating income target of $32.3 million for 2014. We achieved 90% of the 2014 non-GAAP operating income target, which equated to a final 4,000 performance-based shares, which vest as follows: one-third vested upon announcement of the non-GAAP operating income target, one-third vested on the first anniversary of the announcement, and the last third of this subtotal will vest on the second anniversary of the announcement. The remaining one-third of this grant, or 5,000 shares, is subject to time-based vesting (one-third of this subtotal on the first anniversary of the grant date, one-third of this subtotal on the second anniversary of the grant date, and the last third of this subtotal on the third anniversary of the grant date), provided that the individual remains employed by us on these vesting dates. We are amortizing the $175,050 fair value of the shares that have not vested as follows: $58,350 for the time-based awards and $116,700 for the performance-based awards. We are
71
amortizing the $58,350 fair value of the time-based shares that have not vested as follows: (1) $19,450 through the first anniversary of the grant date (2) $19,450 over the two-year vesting period and (3) $19,450 over the three-year vesting period. For the performance-based shares, we are only subjecting to amortization the portion that was attained based on its achievement of 90% of non-GAAP operating income during 2014. The corresponding fair value of the 4,000 performance-based shares the executive manager attained is $46,680 and will vest as follows: (1) $15,560 over the 14-month period for the achievement of the performance objectives and remaining employed by us through the announcement of 2014 financial results, (2) $15,560 over the two-year vesting period (3) $15,560 over the three-year vesting period. Unrecognized compensation expense related to both the performance-based and time-based restricted stock grants in this award was $24,900 at December 31, 2015 and is expected to be recognized through August 2017. Compensation expense related to these restricted stock grants was $48,900 and $31,000 for the year ended December 31, 2015 and 2014, respectively.
On August 12, 2014, we awarded 140,000 shares of restricted stock pursuant to our 2011 Plan to certain managers. One-half of these awards, or 70,000 shares, vest upon each individual manager's achievement of revenue or gross profit objectives for 2014 and remaining employed by us through December 31, 2015. The remaining one-half of these awards, or 70,000 shares, is subject to time-based vesting (50% upon the second grant anniversary date, 25% upon the third grant anniversary date and 25% upon the fourth grant anniversary date), provided that the individual remains employed by us on these vesting dates. The total fair value of the shares that have not vested under these awards is $1.6 million, comprised of $809,200 for the time-based awards and $809,200 for the performance-based awards. We are amortizing the $809,200 fair value of the time-based shares that have not vested as follows: (1) $404,600 through the second anniversary of the grant date (2) $202,300 over the three-year vesting period and (3) $202,300 over the four-year vesting period. For the performance-based shares, we are only subjecting to amortization the portion that was attained based on each individual manager's achievement of revenue and gross profit objectives during 2014. The corresponding fair value of the 17,500 performance-based shares these managers attained is $202,000, which will vest ratably over the 17-month period for the achievement of the performance objectives and remaining employed by us through December 31, 2015. Unrecognized compensation expense related to both the performance-based and time-based restricted stock grants in this award was $342,000 at December 31, 2015 and is expected to be recognized through August 2018. Compensation expense related to these restricted stock grants was $378,000 and $175,000 for the year ended December 31, 2015 and 2014, respectively.
On December 23, 2013, we awarded 171,408 shares of restricted stock pursuant to our 2011 Plan to executive management. These shares vest as follows: two-thirds, or 114,272 shares, upon achievement of 150% of the non-GAAP operating income target of $32.3 million for 2014, with such percentages adjusted according to the matrix approved by our compensation committee during the December 23, 2013 meeting. We achieved 90% of the 2014 non-GAAP operating income target, which equated to a final 45,708 performance-based shares, which vest as follows: one-third vested upon announcement of the non-GAAP operating income target, one-third vested on the first anniversary of the announcement, and the last third of this subtotal will vest on the second anniversary of the announcement. The remaining one-third of this grant, or 57,136 shares, is subject to time-based vesting (one-third of this subtotal on the first anniversary of the grant date, one-third of this subtotal on the second anniversary of the grant date, and the last third of this subtotal on the third anniversary of the grant date), provided that the individual remains employed by us on these vesting dates. We are amortizing the $1.9 million fair value of the shares that have not vested as follows: $633,000 for the time-based awards and $1.3 million for the performance-based awards. We are amortizing the $633,000 fair value of the time-based shares that have not vested as follows: (1) $211,000 through the first anniversary of the grant date (2) $211,000 over the two-year vesting period and (3) $211,000 over the three-year vesting period. For the performance-based shares, we are only subjecting to amortization the portion that was
72
attained based on its achievement of 90% of non-GAAP operating income during 2014. The corresponding fair value of the 45,658 performance-based shares executive management attained is $507,000 and will vest as follows: (1) $169,000 over the 14-month period for the achievement of the performance objectives and remaining employed by us through the announcement of 2014 financial results, (2) $169,000 over the two-year vesting period (3) $169,000 over the three-year vesting period. Unrecognized compensation expense related to both the performance-based and time-based restricted stock grants in this award was $141,000 at December 31, 2015 and is expected to be recognized through February 2017. Compensation expense related to these restricted stock grants was $326,000, $656,000 and $15,000 for the years ended December 31, 2015, 2014 and 2013, respectively.
On March 11, 2013, we awarded 36,000 shares of restricted stock pursuant to its 2011 Plan to certain managers. The restricted stock vests as follows: (1) 50% upon the achievement of our income or gross profit objectives for 2013 and remaining employed by Datalink through December 31, 2014, (2) 25% upon the second grant anniversary date (3) 12.5% upon the third grant anniversary date and (4) 12.5% upon the fourth grant anniversary date. We are amortizing the $382,000 fair value of the shares that have not vested as follows: (1) $191,000 over the 22-month period for the achievement of the performance objectives and remaining employed by Datalink through December 31, 2014, (2) $95,000 over the two-year vesting period (3) $48,000 over the three-year vesting period and (4) $48,000 over the four-year vesting period. Unrecognized compensation expense related to the restricted stock grants was $13,000 at December 31, 2015 and is expected to be recognized through March 2017. Compensation expense related to these restricted stock grants was $27,000, $78,000 and $144,000 for the years ended December 31, 2015, 2014 and 2013, respectively.
On December 4, 2012, we awarded approximately 163,000 shares of restricted stock pursuant to our 2011 Plan to executive management. The restricted stock vests as follows: (1) 50% upon the achievement of our predetermined earnings from operations objective for 2013 as approved by our Board of Directors and assuming the individual employee remained employed by Datalink through December 31, 2014, (2) 25% upon the second grant anniversary date, (3) 12.5% upon the third grant anniversary date and (4) 12.5% upon the fourth grant anniversary date. We are amortizing the $1.4 million fair value of the shares that have not vested as follows: (1) $680,000 over a 25-month period for the achievement of the performance objectives and assuming the individual employee remained employed by Datalink through December 31, 2014, (2) $340,000 over the two-year vesting period, (3) $170,000 over the three-year vesting period and (4) $170,000 over the four-year vesting period. Unrecognized compensation expense related to the non-vested stock grants was $34,000 at December 31, 2015 and is expected to be recognized through November 2016. Compensation expense related to these restricted stock grants was $83,000, $514,000 and $519,000 for the years ended December 31, 2015, 2014, and 2013, respectively.
On October 4, 2012, we awarded 45,000 shares of restricted stock pursuant to our 2011 Plan to certain managers. The restricted stock vests as follows: (1) 50% upon the achievement of our income or gross profit objectives for 2012 and having remained employed by Datalink through the announcement of the 2012 financial results, (2) 25% upon the second grant anniversary date and (3) 25% upon the third grant anniversary date. We are amortizing the $386,000 fair value of the shares that have not vested as follows: (1) $193,000 over the 4.5-month period for the achievement of the performance objectives and having remained employed by Datalink through the announcement of 2012 financial results, (2) $96,500 over the two-year vesting period and (3) $96,500 over the three-year vesting period. There was no unrecognized compensation expense related to the restricted stock grants as it was fully recognized in September 2015. Compensation expense related to these restricted stock grants was $24,000, $68,000 and $80,000 for the years ended December 31, 2015, 2014 and 2013, respectively.
On February 22, 2012, we awarded approximately 173,000 shares of restricted stock pursuant to our 2011 Plan to certain members of its executive management team. The restricted stock vests as
73
follows: (1) 50% upon the achievement of our predetermined earnings from operations objective for 2012 as approved by its Board of Directors and assuming the individual employee remained employed by Datalink through December 31, 2013, (2) 25% upon the second grant anniversary date and (3) 25% upon the third grant anniversary date, provided in each case the individual is employed by Datalink on each vesting date. We are amortizing the $1.5 million fair value of the shares that have not vested as follows: (1) $750,000 over the 22.5-month period for the achievement of the performance objectives and assuming the individual employee remained employed by Datalink through December 31, 2013, (2) $375,000 over the two-year vesting period and (3) $375,000 over the three-year vesting period. There was no unrecognized compensation expense related to the restricted stock grants as it was fully recognized in February 2015. Compensation expense related to these restricted stock grants was $13,000, $115,000 and $191,000 for the years ended December 31, 2015, 2014 and 2013, respectively.
On July 17, 2011, we awarded 215,000 shares of restricted stock pursuant to our 2011 Plan to certain managers. The restricted stock vests as follows: (1) 39,000 upon the achievement of our income or gross profit objectives for 2011, (2) 88,000 upon the second grant anniversary date and (3) 88,000 upon the third grant anniversary date. We are amortizing the $1.6 million fair value of the restricted shares that have not vested as follows: (1) $292,000 over a 6-month vesting period for the achievement of the performance objectives, (2) $658,000 over the two-year vesting period and (3) $658,000 over the three-year vesting period. There was no unrecognized compensation expense related to these restricted stock grants at December 31, 2015. Compensation expense related to these restricted stock grants was $55,000 and $297,000 for the years ended December 31, 2014 and 2013, respectively.
On January 17, 2011, we awarded 209,000 shares of restricted stock pursuant to our 2011 Plan to executive management. The restricted stock vests as follows: (1) 104,500 shares upon the achievement of our predetermined earnings from operations objective for 2011 as approved by its Board of Directors and assuming the individual employee remained employed by Datalink through December 31, 2013, (2) 52,250 upon the second grant anniversary date and (3) 52,250 upon the third grant anniversary date. We are amortizing the $1.2 million fair value of the restricted stock as follows: (1) $612,000 over a 12 month vesting period for the achievement of the performance objectives, (2) $306,000 over the two-year vesting period and (3) $306,000 over the three-year vesting period. There was no unrecognized compensation expense related to these restricted stock grants at December 31, 2015. Compensation expense related to these restricted stock grants was $13,000 and $313,000 for the years ended December 31, 2014 and 2013, respectively.
The following table summarizes our restricted stock activity for the periods indicated below:
| |
Number of Shares | Weighted Average Grant-Date Fair Value |
|||||
|---|---|---|---|---|---|---|---|
Restricted stock at January 1, 2013 |
1,247,668 | $ | 7.47 | ||||
Granted |
480,908 | $ | 11.21 | ||||
Shares vested |
(316,000 | ) | $ | 5.84 | |||
Shares cancelled |
(231,061 | ) | $ | 8.83 | |||
| | | | | | | | |
Restricted stock at December 31, 2013 |
1,181,515 | $ | 9.17 | ||||
Granted |
474,900 | $ | 11.37 | ||||
Shares vested |
(438,710 | ) | $ | 7.53 | |||
Shares cancelled |
(213,864 | ) | $ | 10.96 | |||
| | | | | | | | |
Restricted stock at December 31, 2014 |
1,003,841 | $ | 10.55 | ||||
Granted |
655,810 | $ | 11.45 | ||||
Shares vested |
(378,416 | ) | $ | 9.63 | |||
Shares cancelled |
(296,157 | ) | $ | 11.56 | |||
| | | | | | | | |
Restricted stock at December 31, 2015 |
985,078 | $ | 11.19 | ||||
| | | | | | | | |
| | | | | | | | |
| | | | | | | | |
74
Stock Options:
We had no stock option grants in 2015, 2014, or 2013.
Total stock-based compensation expense related to stock options was $0, $0 and $134,000 for the years ended December 31, 2015, 2014, and 2013, respectively. At December 31, 2015 there were no unrecognized stock-based compensation expense related to stock options.
The following table summarizes activity under our stock option plans:
| |
Outstanding Options | ||||||||
|---|---|---|---|---|---|---|---|---|---|
| |
Number of Shares | Range of Exercise Prices |
Weighted Average Exercise Price |
||||||
Balance, December 31, 2012 |
568,040 | $1.80 - $5.21 | $ | 3.49 | |||||
Options granted |
— | — | $ | — | |||||
Options exercised |
(77,738 | ) | $1.80 - $5.00 | $ | 3.23 | ||||
Options cancelled |
(4,518 | ) | $3.32 - $3.85 | $ | 3.43 | ||||
| | | | | | | | | | |
Balance, December 31, 2013 |
485,784 | $3.32 - $5.21 | $ | 3.54 | |||||
Options granted |
— | — | $ | — | |||||
Options exercised |
(22,884 | ) | $3.32 - $4.30 | $ | 3.88 | ||||
Options cancelled |
— | — | $ | — | |||||
| | | | | | | | | | |
Balance, December 31, 2014 |
462,900 | $3.50 - $5.21 | $ | 3.52 | |||||
| | | | | | | | | | |
| | | | | | | | | | |
| | | | | | | | | | |
Options granted |
— | — | $ | — | |||||
Options exercised |
(8,200 | ) | $3.88 - $5.21 | $ | 4.15 | ||||
Options cancelled |
— | — | $ | — | |||||
| | | | | | | | | | |
Balance, December 31, 2015 |
454,700 | $3.50 - $5.21 | $ | 3.51 | |||||
| | | | | | | | | | |
| | | | | | | | | | |
| | | | | | | | | | |
Options exercisable as of December 31, 2015 |
454,700 | $3.50 - $5.21 | $ | 3.51 | |||||
The weighted average remaining contractual life of options outstanding at December 31, 2015 was 3.53 years. At December 31, 2015, the aggregate intrinsic value of options outstanding and exercisable was $1,497,023. Total intrinsic value of options exercised was $41,235, $202,670, and $568,335 for 2015, 2014, and 2013, respectively.
10. Sales-Type Lease Receivables and Sales-Leaseback Arrangements:
We occasionally enter into sales-type lease agreements with our clients resulting from the sale of certain products. Our lease receivables are recorded at net realizable value within the short- and long-term lease receivables balances on our balance sheets and are due in installments over the lives of the leases. Cash received and applied against this receivable balance is recorded within changes in operating assets and liabilities in the net cash provided by operating activities section of the statement of cash flows. Finance income is derived over the term of the sales-type lease arrangement as the unearned income on financed sales-type leases is earned. Unearned income is amortized over the life of the lease using the interest method. The present value of net investment in sales-type lease receivables of $10.4 million and $6.1 million at December 31, 2015 and 2014, respectively, is reflected net of unearned income of $492,000 and $435,000 at December 31, 2015 and 2014, respectively. As of
75
December 31, 2015, scheduled maturities of minimum lease payments receivable were as follows for the fiscal years ended December 31:
| |
(in thousands) | |||
|---|---|---|---|---|
2016 |
$ | 3,895 | ||
2017 |
3,466 | |||
2018 |
2,804 | |||
2019 |
505 | |||
2020 |
242 | |||
| | | | | |
|
10,912 | |||
Less: Current portion |
(3,895 | ) | ||
| | | | | |
Long-term sales-type lease receivable |
$ | 7,017 | ||
| | | | | |
| | | | | |
| | | | | |
Lease receivables are individually evaluated for impairment. In the event we determine that a lease receivable may not be paid, we include in our allowance an amount for the outstanding balance related to the lease receivable. At December 31, 2015 and 2014, there were no material amounts past due related to lease receivables.
Our lease receivables typically generate monthly cash inflows with average lease durations of 24 to 36 months. To better match cash outflows related to these receivables, we occasionally finance the equipment associated with our lease receivables through sales-leaseback arrangements over a period commensurate with the receivable. Gains associated with these sales are deferred in accordance with the accounting for sales-leaseback transactions and are amortized over the lives of the related lease agreements. As of December 31, 2015, our contractual cash obligations for future minimum lease payments were as follows for the fiscal years ended December 31:
| |
(in thousands) | |||
|---|---|---|---|---|
2016 |
$ | 3,382 | ||
2017 |
3,226 | |||
2018 |
2,415 | |||
2019 |
336 | |||
2020 |
141 | |||
| | | | | |
|
9,500 | |||
Less: Current portion |
(3,643 | ) | ||
| | | | | |
Long-term leases payable |
$ | 5,857 | ||
| | | | | |
| | | | | |
| | | | | |
Of the $9.5 million of contractual cash obligations for future minimum lease payments at December 31, 2015, $480,000 represented interest.
11. Commitments and Contingencies:
We have change of control severance agreements and employment agreements in place with certain executive employees. Under the agreements, an executive is entitled to a severance payment in the event the executive (a) is terminated without cause by us in anticipation of, in connection with, at the time of or within two years after a change of control, or (b) resigns for good reasons arising in anticipation of, in connection with, at the time of or within two years after a change of control.
76
12. Quarterly Financial Information (unaudited):
| |
March 31 | June 30 | Sept 30 | Dec 31 | |||||||||
|---|---|---|---|---|---|---|---|---|---|---|---|---|---|
| |
(in thousands, except per share data) |
||||||||||||
2015 |
|||||||||||||
Net sales |
$ | 175,352 | $ | 182,631 | $ | 198,032 | $ | 208,750 | |||||
Gross profit |
35,168 | 36,472 | 34,881 | 36,909 | |||||||||
Operating earnings (loss) |
(8 | ) | 1,179 | 2,476 | 5,427 | ||||||||
Net earnings |
(14 | ) | 661 | 1,314 | 2,738 | ||||||||
Net earnings per share—basic |
(0.00 | ) | 0.03 | 0.06 | 0.13 | ||||||||
Net earnings per share—diluted |
(0.00 | ) | 0.03 | 0.06 | 0.12 | ||||||||
| |
March 31 | June 30 | Sept 30 | Dec 31 | |||||||||
|---|---|---|---|---|---|---|---|---|---|---|---|---|---|
| |
(in thousands, except per share data) |
||||||||||||
2014 |
|||||||||||||
Net sales |
$ | 139,535 | $ | 159,380 | $ | 144,947 | $ | 186,374 | |||||
Gross profit |
29,482 | 35,483 | 32,333 | 39,529 | |||||||||
Operating earnings |
(413 | ) | 5,974 | 4,564 | 6,372 | ||||||||
Net earnings |
301 | 3,563 | 3,546 | 3,671 | |||||||||
Net earnings per share—basic |
0.01 | 0.17 | 0.16 | 0.17 | |||||||||
Net earnings per share—diluted |
0.01 | 0.16 | 0.16 | 0.17 | |||||||||
| |
March 31 | June 30 | Sep 30 | Dec 31 | |||||||||
|---|---|---|---|---|---|---|---|---|---|---|---|---|---|
| |
(in thousands, except per share data) |
||||||||||||
2013 |
|||||||||||||
Net sales |
$ | 133,518 | $ | 147,779 | $ | 139,519 | $ | 173,368 | |||||
Gross profit |
29,833 | 33,561 | 29,805 | 40,659 | |||||||||
Operating earnings |
1,966 | 4,936 | 1,155 | 9,348 | |||||||||
Net earnings |
1,098 | 2,904 | 818 | 5,225 | |||||||||
Net earnings per share—basic |
0.07 | 0.17 | 0.05 | 0.24 | |||||||||
Net earnings per share—diluted |
0.07 | 0.16 | 0.05 | 0.24 | |||||||||
13. Subsequent Events:
On September 14, 2015, our board of directors approved a new stock repurchase program authorizing the repurchase of shares of our common stock in the open market or in privately negotiated purchases, or both, at an aggregate purchase price of up to $10 million. The timing and amount of any share repurchases will be determined by our management based on market conditions and other factors. The share repurchase program is expected to be completed by December 31, 2016. Under this program, we may from time to time purchase our outstanding common stock in the open market at management's discretion, subject to share price, market conditions and other factors. The common stock repurchase program does not obligate us to repurchase any dollar amount or number of shares. During January and February of 2016, we repurchased 600,000 shares of our common stock at a total purchase price of $4.2 million under this program.
77
Item 9. Changes in and Disagreements with Accountants on Accounting and Financial Disclosure.
None.
Item 9A. Controls and Procedures.
- (a)
- Evaluation of Disclosure Controls and Procedures
Under the supervision and with the participation of our management, including our Chief Executive Officer (principal executive officer) and our Chief Financial Officer (principal financial officer), we have evaluated the effectiveness of the design and operation of our disclosure controls and procedures pursuant to Rule 13a-15(b) under the Securities Exchange Act of 1934. Based on their review of our disclosure controls and procedures, the Chief Executive Officer and the Chief Financial Officer have concluded that our disclosure controls and procedures were effective at December 31, 2015 to ensure that information we are required to disclose in reports that we file or submit is accumulated and communicated to our management, including our principal executive and principal financial officer, as appropriate to allow timely decisions regarding required disclosures, and that such information is recorded, processed, summarized and reported within the time periods specific in the Securities and Exchange Commission rules and forms.
- (b)
- Management's Report on Internal Control over Financial Reporting
Our management is responsible for establishing and maintaining adequate internal control over financial reporting. Our internal controls are designed to provide reasonable assurance regarding the reliability of financial reporting and the preparation of financial statements for external purposes in accordance with generally accepted accounting principles. Because of its inherent limitations, internal control over financial reporting may not prevent or detect misstatements. Also, projections of any evaluation of effectiveness to future periods are subject to the risk that controls may become inadequate because of changes in conditions, or that the degree of compliance with the policies or procedures may deteriorate.
Under the supervision and with the participation of our management, including our Chief Executive Officer and our Chief Financial Officer, we assessed the effectiveness of our internal control over financial reporting as of December 31, 2015. In making this assessment, our management used the criteria set forth by the Committee of Sponsoring Organizations of the Treadway Commission (COSO) in Internal Control—Integrated Framework (2013).
Based on our evaluation under the framework in Internal Control—Integrated Framework (2013), our management concluded that our internal control over financial reporting was effective as of December 31, 2015.
RSM US LLP, the independent registered accounting firm who audited our financial statements, has also audited the effectiveness of our internal control over financial reporting as of December 31, 2015 as described in their report on the next page.
- (c)
- Changes in Internal Control
There has been no change in our internal controls over financial reporting during our most recent fiscal quarter that has materially affected, or is reasonably likely to materially affect, our internal controls over financial reporting.
78
Report of Independent Registered Public Accounting Firm
To
the Board of Directors and Shareholders
Datalink Corporation
We have audited Datalink Corporation's internal control over financial reporting as of December 31, 2015, based on criteria established in Internal Control—Integrated Framework issued by the Committee of Sponsoring Organizations of the Treadway Commission in 2013. Datalink Corporation's management is responsible for maintaining effective internal control over financial reporting and for its assessment of the effectiveness of internal control over financial reporting included in the accompanying Management's Report on Internal Control over Financial Reporting. Our responsibility is to express an opinion on the company's internal control over financial reporting based on our audit.
We conducted our audit in accordance with the standards of the Public Company Accounting Oversight Board (United States). Those standards require that we plan and perform the audit to obtain reasonable assurance about whether effective internal control over financial reporting was maintained in all material respects. Our audit included obtaining an understanding of internal control over financial reporting, assessing the risk that a material weakness exists, and testing and evaluating the design and operating effectiveness of internal control based on the assessed risk. Our audit also included performing such other procedures as we considered necessary in the circumstances. We believe that our audit provides a reasonable basis for our opinion.
A company's internal control over financial reporting is a process designed to provide reasonable assurance regarding the reliability of financial reporting and the preparation of financial statements for external purposes in accordance with generally accepted accounting principles. A company's internal control over financial reporting includes those policies and procedures that (a) pertain to the maintenance of records that, in reasonable detail, accurately and fairly reflect the transactions and dispositions of the assets of the company; (b) provide reasonable assurance that transactions are recorded as necessary to permit preparation of financial statements in accordance with generally accepted accounting principles, and that receipts and expenditures of the company are being made only in accordance with authorizations of management and directors of the company; and (c) provide reasonable assurance regarding prevention or timely detection of unauthorized acquisition, use, or disposition of the company's assets that could have a material effect on the financial statements.
Because of its inherent limitations, internal control over financial reporting may not prevent or detect misstatements. Also, projections of any evaluation of effectiveness to future periods are subject to the risk that controls may become inadequate because of changes in conditions, or that the degree of compliance with the policies or procedures may deteriorate.
In our opinion, Datalink Corporation maintained, in all material respects, effective internal control over financial reporting as of December 31, 2015, based on criteria established in Internal Control—Integrated Framework issued by the Committee of Sponsoring Organizations of the Treadway Commission in 2013.
We have also audited, in accordance with the standards of the Public Company Accounting Oversight Board (United States), the consolidated financial statements of Datalink Corporation as of December 31, 2015 and 2014 and for each of the three years in the period ended December 31, 2015, and our report dated March 14, 2016 expressed an unqualified opinion.
/s/ RSM US LLP
Minneapolis,
Minnesota
March 14, 2016
79
Not Applicable.
Item 10. Directors, Executive Officers and Corporate Governance.
Information contained in Part I, Item 1 of this Annual Report under the heading "Executive Officers," as well as under "Election of Directors," "Executive Compensation—Executive Officers" and "Section 16(a) Beneficial Ownership Reporting Compliance" in our proxy statement for our 2016 annual meeting of shareholders, to be filed pursuant to Regulation 14A within 120 days after the end of the fiscal year covered by this Form 10-K (the "2016 Proxy Statement") is incorporated herein by reference.
We have adopted a code of ethics that applies to our officers, including our principal executive, financial and accounting officers, and our directors and employees. We intend to make all required disclosures concerning any amendments to, or waivers from, our code of ethics by the filing current reports on Form 8-K.
Item 11. Executive Compensation.
We incorporate the information set forth under "Executive Compensation" and "Director Compensation" in our 2016 Proxy Statement herein by reference.
Item 12. Security Ownership of Certain Beneficial Owners and Management and Related Stockholder Matters.
We incorporate the information set forth under "Outstanding Voting Securities and Voting Rights" and "Equity Compensation Plan Information at Fiscal Year Ended December 31, 2015" in our 2016 Proxy Statement herein by reference.
Item 13. Certain Relationships and Related Transactions, and Director Independence.
We incorporate the information required by this section by reference from the information set forth under "Transactions with Related Parties" and "Corporate Governance" in our 2016 Proxy Statement.
Item 14. Principal Accountant Fees and Services.
We incorporate the information required by this section by reference from the information set forth under "Auditing Matters" in our 2016 Proxy Statement.
Item 15. Exhibits and Financial Statement Schedules.
- (a)
- We
are filing the following documents as part of this Form 10-K report:
- 1.
- Financial Statements
Reference is made to the Financial Statements of Datalink Corporation in Part II, Item 8 of this Annual Report.
80
- 2.
- Financial Statement Schedules.
The following financial statement schedule of Datalink Corporation for 2015, 2014 and 2013 is filed as part of this Annual Report and should be read in conjunction with the Financial Statements of Datalink Corporation.
DATALINK CORPORATION
SCHEDULE II VALUATION AND QUALIFYING ACCOUNTS
FOR THE YEARS ENDED DECEMBER 31, 2015, 2014, AND 2013
Description
|
Period | Balance at Beginning of Period |
Additions | Deductions(1) | Balance at End of Period |
|||||||||||
|---|---|---|---|---|---|---|---|---|---|---|---|---|---|---|---|---|
Allowance for Doubtful Accounts |
2015 | $ | 460,026 | $ | 90,667 | $ | 128,667 | $ | 422,026 | |||||||
|
2014 | $ | 330,689 | $ | 151,714 | $ | 22,377 | $ | 460,026 | |||||||
|
2013 | $ | 222,860 | $ | 115,354 | $ | 7,525 | $ | 330,689 | |||||||
Allowance for Inventory Obsolescence |
2015 |
$ |
87,377 |
$ |
191,240 |
$ |
177,006 |
$ |
101,611 |
|||||||
|
2014 | $ | 89,076 | $ | 131,063 | $ | 132,762 | $ | 87,377 | |||||||
|
2013 | $ | 309,501 | $ | 151,986 | $ | 372,411 | $ | 89,076 | |||||||
- (1)
- Deductions reflect write-offs of client accounts receivables, net of recoveries.
- 3.
- Exhibits.
The exhibits filed with this report are set forth on the exhibit index filed as a part of this report immediately following the signatures to this report.
81
Pursuant to the requirements of Section 13 or 15(d) of the Securities Exchange Act of 1934, the registrant has duly caused this Annual Report on Form 10-K to be signed on its behalf by the undersigned, thereunto duly authorized.
| DATALINK CORPORATION | ||||
| Date: March 14, 2016 | ||||
| By: | /s/ PAUL F. LIDSKY Paul F. Lidsky, President and Chief Executive Officer |
|||
By: |
/s/ GREGORY T. BARNUM Gregory T. Barnum, Vice President, Finance and Chief Financial Officer and Secretary |
|||
Pursuant to the requirements of the Securities Act of 1934, this report has been signed below by the following persons on behalf of the registrant and in the capacities and on the dates indicated.
Signature
|
Title
|
Date
|
||
|---|---|---|---|---|
| /s/ PAUL F. LIDSKY |
President, Chief Executive Officer and Director (Principal Executive Officer) | March 14, 2016 | ||
/s/ GREGORY T. BARNUM |
Vice President, Finance and Chief Financial Officer and Secretary (Principal Financial Officer) |
March 14, 2016 |
||
/s/ DENISE M. WESTENFIELD |
Vice President, Controller and Chief Accounting Officer and Assistant Secretary (Principal Accounting Officer) |
March 14, 2016 |
||
/s/ JAMES E. OUSLEY |
Chairman of the Board and Director |
March 14, 2016 |
||
/s/ BRENT G. BLACKEY |
Director |
March 14, 2016 |
||
/s/ GREG R. MELAND |
Director |
March 14, 2016 |
||
/s/ J. PATRICK O'HALLORAN |
Director |
March 14, 2016 |
||
/s/ MERCEDES A. WALTON |
Director |
March 14, 2016 |
||
/s/ JAMES L. ZUCCO |
Director |
March 14, 2016 |
82
| |
Exhibit Number |
Title | Method of Filing | ||||
|---|---|---|---|---|---|---|---|
| 3.1 | Amended and Restated Articles of Incorporation of the Company | 12 | |||||
| 3.2 | Amended and Restated Bylaws of the Company | 13 | |||||
| 4.1 | Form of Common Stock Certificate | 11 | |||||
| 4.2 | Common Stock Purchase Agreement, dated October 18, 2014, by and among Datalink Corporation, Mars Acquisition, Inc., the Donald W. James, Jr. Revocable Trust, Bradford Thompson, and Richard Wallace. | 23 | |||||
| 10.1 | Form of Indemnification Agreement | 1 | |||||
| 10.2 | * | 2009 Incentive Compensation Plan, as amended May 13, 2010 | 10 | ||||
| 10.3 | * | Change of Control Severance Agreement | 2 | ||||
| 10.4 | Sublease Agreement dated December 9, 2004, with Checkpoint Security, Inc. | 4 | |||||
| 10.5 | Vacant Land Purchase Agreement | 5 | |||||
| 10.6 | * | Correction to Restricted Stock Award Agreements dated August 13, 2004 | 6 | ||||
| 10.7 | * | Employment Agreement dated March 14, 2006, with Gregory T. Barnum | 7 | ||||
| 10.8 | * | Employment Agreement dated July 20, 2009, as amended, with Paul F. Lidsky | 8 | ||||
| 10.9 | * | Employment Agreement dated December 17, 2009, with M. Shawn O'Grady | 9 | ||||
| 10.10 | * | 2011 Incentive Compensation Plan | 14 | ||||
| 10.11 | * | Form of Restricted Stock Award Agreement for Directors under 2011 Incentive Compensation Plan | 15 | ||||
| 10.12 | * | Form of Restricted Stock Award Agreement for Employees under 2011 Incentive Compensation Plan | 16 | ||||
| 10.13 | * | Form of Incentive Stock Option Agreement under 2011 Incentive Compensation Plan | 17 | ||||
| 10.14 | * | Form of Non-Qualified Stock Option Agreement under 2011 Incentive Compensation Plan | 18 | ||||
| 10.15 | Lease dated August 9, 2010, with IRET Properties | 19 | |||||
| 10.16 | First Amendment to Lease dated December 20, 2010, with IRET Properties | 20 | |||||
| 10.17 | Credit Agreement by and between Datalink Corporation and Castle Pines Capital LLC dated as of July 17, 2013 | 21 | |||||
| 10.18 | First Amendment, dated as of January 13, 2015, to Credit Agreement, dated as of July 17, 2013, by and between Datalink Corporation and Castle Pines Capital LLC | 22 | |||||
| 10.19 | Second Amendment, dated as of May 21, 2015, to Credit Agreement, dated as of July 17, 2013, by and between Datalink Corporation and Castle Pines Capital LLC | 26 | |||||
| 10.20 | Form of Deferred Stock Unit Master Agreement under 2011 Incentive Compensation Plan | 24 | |||||
| 10.21 | Form of Restricted Stock Award Agreement for awards granted to employees in October 2014 | 25 | |||||
| 10.22 | Form of Performance Stock Unit Award Agreement under 2011 Incentive Compensation Plan | Filed herewith | |||||
| 14.1 | Code of Ethics | 3 | |||||
| 23.1 | Consent of RSM US LLP | Filed herewith | |||||
83
| |
Exhibit Number |
Title | Method of Filing | ||||
|---|---|---|---|---|---|---|---|
| 31.1 | Certifications by the Chief Executive Officer and Chief Financial Officer pursuant to Section 302 of the Sarbanes-Oxley Act of 2002 | Filed herewith | |||||
| 32.1 | Certifications by the Chief Executive Officer and Chief Financial Officer pursuant to Section 906 of the Sarbanes-Oxley Act of 2002 | Filed herewith | |||||
| 101.INS | XBRL Instance Document | Filed herewith | |||||
| 101.SCH | XBRL Taxonomy Extension Schema Document | Filed herewith | |||||
| 101.CAL | XBRL Taxonomy Extension Calculation Linkbase Document | Filed herewith | |||||
| 101.DEF | XBRL Taxonomy Extension Definition Linkbase Document | Filed herewith | |||||
| 101.LAB | XBRL Taxonomy Extension Label Linkbase Document | Filed herewith | |||||
| 101.PRE | XBRL Taxonomy Extension Presentation Linkbase Document | Filed herewith | |||||
- *
- Management
contract or compensatory plan or arrangement.
- 1)
- Incorporated
by reference to exhibit 10.4 in our registration statement on Form S-1, Reg. No. 333-55935, filed on June 3, 1998.
- 2)
- Incorporated
by reference to exhibit 10.24 in our Form 10-Q for the period ended September 30, 2004, filed on November 15, 2004
(File No. 0-29758).
- 3)
- Incorporated
by reference to exhibit 14.1 in our Form 10-K for the period ended December 31, 2003, filed on March 24, 2004 (File
No. 0-29758).
- 4)
- Incorporated
by reference to exhibit 10.25 in our Form 10-K for the period ended December 31, 2004, filed on March 31, 2005 (File
No. 0-29758).
- 5)
- Incorporated
by reference to exhibit 10.26 in our Form 10-K for the period ended December 31, 2004, filed on March 31, 2005 (File
No. 0-29758).
- 6)
- Incorporated
by reference to exhibit 10.25 in our Form 10-Q for the period ended September 30, 2005, filed on November 14, 2005
(File No. 0-29758).
- 7)
- Incorporated
by reference to exhibit 10.28 in our Form 8-K filed on March 17, 2006 (File No. 0-29758).
- 8)
- Incorporated
by reference to exhibit 10.1 in our Form 8-K filed on January 21, 2011 (File No. 0-29758).
- 9)
- Incorporated
by reference to exhibit 10.1 in our Form 8-K filed on December 22, 2009 (File No. 0-29758).
- 10)
- Incorporated
by reference to exhibit 10.1 in our Form 8-K filed on May 17, 2010 (File No. 0-29758).
- 11)
- Incorporated
by reference to exhibit 4.1 in our amended registration statement on Form S-1/A, Reg. No. 333-55935, filed on
July 16, 1998.
- 12)
- Incorporated
by reference to the exhibit of the same number in our Registration Statement on Form S-1, filed on June 3, 1998 (File
No. 333-55935).
- 13)
- Incorporated
by reference to exhibit 3.2 in our Form 8-K filed on February 18, 2011 (File No. 0-29758).
- 14)
- Incorporated
by reference to Appendix A in our proxy statement for our 2011 annual meeting, filed on March 31, 2011 (File No. 0-29758).
- 15)
- Incorporated by reference to exhibit 10.3 in our Form 10-Q for the period ended June 30, 2011, filed on August 11, 2011 (File No. 0-29758).
84
- 16)
- Incorporated
by reference to exhibit 10.4 in our Form 10-Q for the period ended June 30, 2011, filed on August 11, 2011 (File
No. 0-29758).
- 17)
- Incorporated
by reference to exhibit 10.5 in our Form 10-Q for the period ended June 30, 2011, filed on August 11, 2011 (File
No. 0-29758).
- 18)
- Incorporated
by reference to exhibit 10.6 in our Form 10-Q for the period ended June 30, 2011, filed on August 11, 2011 (File
No. 0-29758).
- 19)
- Incorporated
by reference to exhibit 10.18 in our Form 10-K for the period ended December 31, 2011, filed on March 15, 2012
(File No. 000-29758).
- 20)
- Incorporated
by reference to exhibit 10.19 in our Form 10-K for the period ended December 31, 2011, filed on March 15, 2012
(File No. 000-29758).
- 21)
- Incorporated
by reference to exhibit 10.1 in our Form 8-K filed on July 18, 2013 (File No. 000-29758).
- 22)
- Incorporated
by reference to exhibit 10.1 in our Form 8-K filed on January 14, 2015 (File No. 000-29758).
- 23)
- Incorporated
by reference to exhibit 4.1 in our Form 8-K filed on October 20, 2014 (File No. 0-29758).
- 24)
- Incorporated
by reference to exhibit 10.1 in our Form 10-Q for the period ended March 31, 2014, filed on May 9, 2014 (File
No. 0-29758).
- 25)
- Incorporated
by reference to exhibit 10.1 in our Form 8-K filed on October 20, 2014 (File No. 0-29758).
- 26)
- Incorporated by reference to exhibit 10.1 in our Form 8-K filed on May 22, 2015 (File No. 0-29758).
85
NOTE REGARDING FORWARD-LOOKING STATEMENTS
PART I
-
Item 1B. Unresolved Staff Comments.
Item 2. Properties.
Item 3. Legal Proceedings.
Item 4. Mine Safety Disclosures.
COMPARISON OF 5 YEAR CUMULATIVE TOTAL RETURN Datalink Corporation, The NASDAQ Composite Index And The Russell 2000 Index
COMPARISON OF 5 YEAR CUMULATIVE TOTAL RETURN* Among Datalink Corporation, the NASDAQ Composite lndex, and the Russell 2000 lndex
Report of Independent Registered Public Accounting Firm
DATALINK CORPORATION CONSOLIDATED BALANCE SHEETS (in thousands, except share data)
DATALINK CORPORATION CONSOLIDATED STATEMENTS OF OPERATIONS (in thousands, except per share data)
DATALINK CORPORATION CONSOLIDATED STATEMENTS OF STOCKHOLDERS' EQUITY (in thousands)
DATALINK CORPORATION CONSOLIDATED STATEMENTS OF CASH FLOWS (In thousands)
DATALINK CORPORATION NOTES TO CONSOLIDATED FINANCIAL STATEMENTS
-
Item 9. Changes in and Disagreements with Accountants on Accounting and Financial Disclosure.
Item 9A. Controls and Procedures.
-
Item 10. Directors, Executive Officers and Corporate Governance.
Item 11. Executive Compensation.
Item 12. Security Ownership of Certain Beneficial Owners and Management and Related Stockholder Matters.
Item 13. Certain Relationships and Related Transactions, and Director Independence.
Item 14. Principal Accountant Fees and Services.
DATALINK CORPORATION SCHEDULE II VALUATION AND QUALIFYING ACCOUNTS FOR THE YEARS ENDED DECEMBER 31, 2015, 2014, AND 2013
SIGNATURES
EXHIBIT INDEX