Attached files
| file | filename |
|---|---|
| 8-K - FORM 8-K - BRINKS CO | form_8k.htm |
| EX-99.1 - EXHIBIT 99.1 - BRINKS CO | exhibit_99-1.htm |

The Brink’s Company
Second-Quarter 2012 Earnings
Conference Call
NYSE:BCO
July 26, 2012
Exhibit 99.2

Forward-Looking Statements
These materials contain forward-looking statements. Actual
results could differ materially from projected or estimated
results. Information regarding factors that could cause such
differences is available in today's release and in The Brink’s
Company’s most recent SEC filings.
results could differ materially from projected or estimated
results. Information regarding factors that could cause such
differences is available in today's release and in The Brink’s
Company’s most recent SEC filings.
Information discussed today is representative as of today
only and Brink's assumes no obligation to update any
forward-looking statements. These materials are
copyrighted and may not be used without written permission
from Brink's.
only and Brink's assumes no obligation to update any
forward-looking statements. These materials are
copyrighted and may not be used without written permission
from Brink's.
2

The Brink’s Company
Ed Cunningham
Director - Investor Relations and
Corporate Communications
Corporate Communications

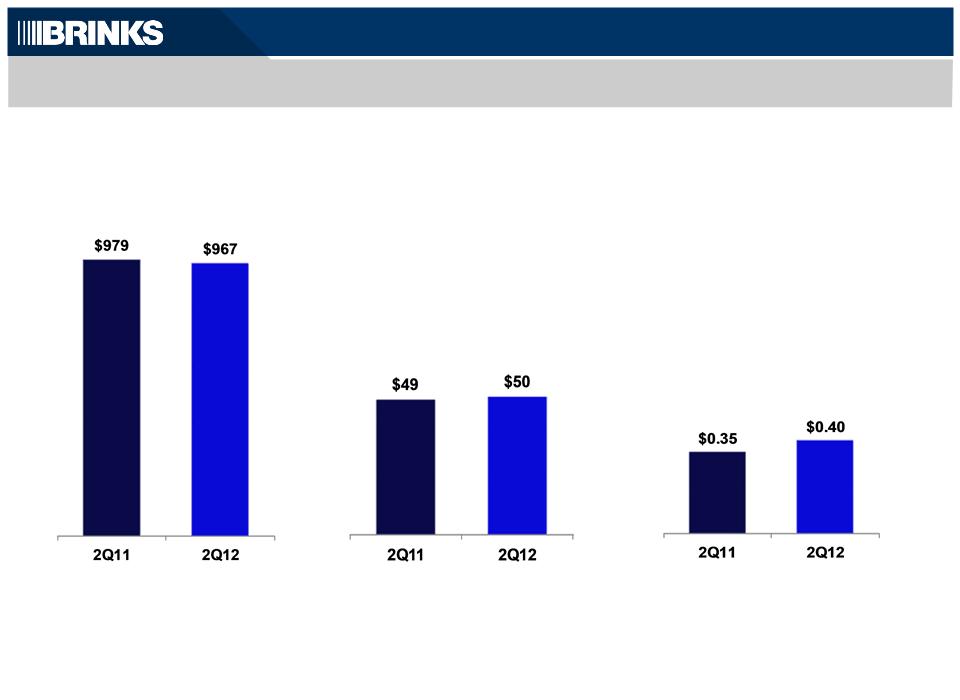
Highlights of Second-Quarter Non-GAAP Results
• EPS $.40 vs $.35
• Revenue down 1%, 7% organic growth
• Segment Margin 5.2% vs. 5.0%
Note: See reconciliation to GAAP results in Appendix
4

The Brink’s Company
Tom Schievelbein
Chairman, President and
Chief Executive Officer

Second-Quarter Overview
• Profit Growth in North America, Europe offset Latin
America
America
• 2012 outlook affirmed
• Capex reduced
• Pension funded with cash
Note: See reconciliation to GAAP results in Appendix
6

Strategy
• Accelerate strategic execution, deliver near-term profit
growth
growth
• Profit turnaround in North America and EMEA
• Growth in Latin America; Mexico on track
• Grow high-value solutions
• Long-term goal: 10% segment margin
Note: See reconciliation to GAAP results in Appendix
7

The Brink’s Company
Joe Dziedzic
Vice President and Chief
Financial Officer
Financial Officer
Review and Outlook
2Q12 Non-GAAP Results
($ millions, except EPS)
Segment
Operating Profit
Operating Profit
Revenue
|
|
|
|
|
|
Margin
|
5.0%
|
|
5.2%
|
EPS
Note: See reconciliation to GAAP results in Appendix
9
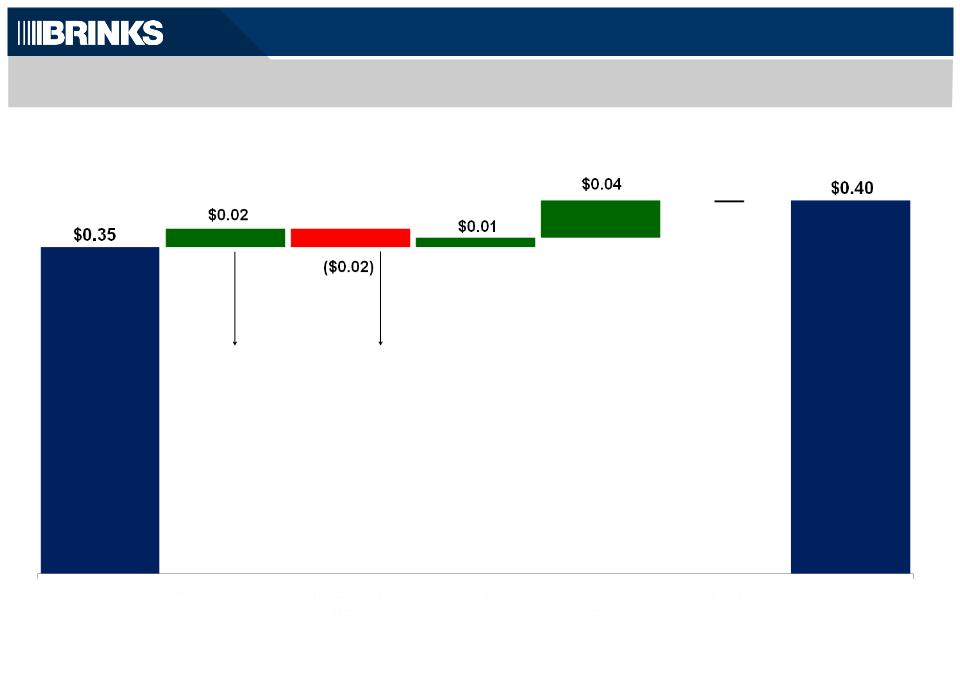
Non-GAAP EPS: 2Q12 Versus 2Q11
Segment
Operating
Profit
Operating
Profit
Non-Segment
Expense
Expense
Interest
Expense,
Net
Expense,
Net
Non-
Controlling
Interest
Controlling
Interest
Tax Rate
2Q11
2Q12
Note: See reconciliation to GAAP results in Appendix
Fx ($0.06)
Ops $0.08
New CEO ($0.04)
Other $0.02
10

Total Non-GAAP Segment Results and Outlook
($ millions)
2Q12 Results
2012 Outlook
— Maintained margin guidance at ~7%
— 5% - 8% organic revenue growth
— U.S. actions improve profitability
— Europe operations stable to improving in a
difficult environment
difficult environment
— Continued strong Latin America growth
— Strong organic revenue growth
— North America & Europe profits improve
— Latin America profits lower; Venezuela
down
down
— First-half margin 6.2% versus 5.3%
|
|
|
|
|
|
|
|
Margin
|
|
|
5.0%
|
|
5.2%
|
(a)
(a) See reconciliation to GAAP results in Appendix
Segment
Operating Profit
11

North America Non-GAAP Segment Results and Outlook
2Q12 Results
2012 Outlook
— Revenue down organically
— Solid margin improvement
— U.S. cost reductions/productivity offset
price and volume pressure
price and volume pressure
— First-half margin 4.6% versus 3.8%
— Flat revenue in a difficult environment
— U.S. cost reductions/productivity offset
price and volume pressure
price and volume pressure
— On track for margin of 4.5% to 5.5%
(a) See reconciliation to GAAP results in Appendix
|
|
|
|
|
|
|
|
Margin
|
|
|
4.5%
|
|
5.7%
|
(a)
Operating Profit
12

International Non-GAAP Segment Results and Outlook
2Q12 Results
2012 Outlook
($ millions)
— Revenue Growth
— Organic growth $77
— Currency down ($80)
— Profit Growth
— Organic growth $4
— Currency down ($5)
— Profit decline in Latin America due to
Venezuela
Venezuela
— Profits up in EMEA on operations and
commercial settlement
commercial settlement
— Mexico on track
— 7% to 8% margin rate
— Continued strong organic revenue growth
driven by Latin America
driven by Latin America
— Unfavorable currency impact
— Strong improvement in Mexico, positioned
for margin expansion 2013+
for margin expansion 2013+
(a) See reconciliation to GAAP results in Appendix
(a)
|
|
|
|
|
|
|
|
Margin
|
|
|
5.1%
|
|
5.0%
|
Revenue
13

Non-GAAP Cash Flow, Capital Investment, and Net Debt
14
($ millions)
(a) See reconciliation to GAAP results in Appendix
Non-GAAP
CFOA
CFOA
(a)
$82
$101
North
America
America
International
Capital
Expenditures
and Capital
Leases
Expenditures
and Capital
Leases
Net Debt
(a)
14

2012 Outlook
($ millions)
Capital Deployment
— Future pension contributions in cash
— Capital Expenditures/Leases below 2011
|
|
|
|
|
|
|
|
Margin
|
|
|
6.3%
|
|
~7%
|
(a)
(a) See reconciliation to GAAP results in Appendix
— Strong growth in Latin America
— Slow/no growth in North America
— Modest growth in Europe
Revenue
— Strong profit expansion in Latin America
— North America on track for 4.5% to 5.5%
— Slight profit expansion in Europe
Segment Profit
15

The Brink’s Company
Second-Quarter 2012 Earnings
Conference Call
NYSE:BCO
July 26, 2012

Appendix - Non-GAAP Reconciliations

Non-GAAP Reconciliations - 2Q12
GAAP Basis
Gain on
Acquisitions and
Dispositions (a)
Acquisitions and
Dispositions (a)
Employee
Benefit
Settlement
Losses (b)
Benefit
Settlement
Losses (b)
U.S.
Retirement
Plans (c)
Retirement
Plans (c)
Tax Benefit on
Change in Health
Care Funding
Strategy (d)
Change in Health
Care Funding
Strategy (d)
Adjust
Income Tax
Rate (e)
Income Tax
Rate (e)
Non-
GAAP
Basis
GAAP
Basis
Second Quarter 2012
Operating profit:
International
$
36.4
-
0.3
-
-
-
36.7
Segment operating profit
47.8
-
0.3
2.2
-
-
50.3
Non-segment
(21.3)
(0.9)
-
10.5
-
-
(11.7)
Amounts attributable to Brink’s:
Diluted EPS - continuing operations
0.63
(0.01)
-
0.16
(0.43)
0.04
0.40
(a) To eliminate:
• First quarter gain related to the sale of investments in mutual fund securities ($2 million). Proceeds from the sale were used to fund the
settlement of pension obligations related to the former CEO.
settlement of pension obligations related to the former CEO.
• Second quarter gain related to business acquisition ($0.9 million).
(b) To eliminate employee benefit settlement losses related to severance payments made by Brink’s subsidiary in Mexico. Employee termination
benefits in Mexico are accounted for under FASB ASC Topic 715, Compensation - Retirement Benefits.
benefits in Mexico are accounted for under FASB ASC Topic 715, Compensation - Retirement Benefits.
(c) To eliminate expenses related to U.S. retirement plans.
(d) To eliminate tax benefit related to change in retiree health care funding strategy.
(e) To adjust effective income tax rate in the interim period to be equal to the midpoint of the estimated range of the full-year non-GAAP effective income
tax rate. The midpoint of the estimated range of the full-year non-GAAP effective tax rate for 2012 is 38.5%.
tax rate. The midpoint of the estimated range of the full-year non-GAAP effective tax rate for 2012 is 38.5%.
Amounts may not add due to rounding.
18

Non-GAAP Reconciliations -2Q11
GAAP Basis
Gains on
Acquisitions and
Dispositions (a)
Acquisitions and
Dispositions (a)
Belgium
Settlement
Charge (b)
Settlement
Charge (b)
Employee
Benefit
Settlement
Losses (c)
Benefit
Settlement
Losses (c)
U.S. Retirement
Plans (d)
Plans (d)
Adjust
Income Tax
Rate (e)
Income Tax
Rate (e)
Non-GAAP
Basis
Basis
Operating profit:
North America
10.4
-
-
-
0.8
-
11.2
Segment operating profit
36.6
-
10.1
1.0
0.8
-
48.5
Non-segment
(16.2)
-
-
-
6.2
-
(10.0)
Operating profit
$
20.4
-
10.1
1.0
7.0
-
38.5
Amounts attributable to Brink’s:
Income from continuing operations
$
5.3
-
6.4
0.7
4.4
0.2
17.0
Diluted EPS - continuing operations
0.11
-
0.13
0.01
0.09
-
0.35
(a) To eliminate gains on available-for-sale equity and debt securities and gain related to acquisition of controlling interest in a subsidiary that was
previously accounted for as an equity method investment.
previously accounted for as an equity method investment.
(b) To eliminate settlement charge related to exit of Belgium cash-in-transit business.
(c) To eliminate employee benefit settlement loss related to severance payments made by Brink’s subsidiary in Mexico. Employee termination
benefits in Mexico are accounted for under FASB ASC Topic 715, Compensation - Retirement Benefits.
benefits in Mexico are accounted for under FASB ASC Topic 715, Compensation - Retirement Benefits.
(d) To eliminate expenses related to U.S. retirement plans.
(e) To adjust effective income tax rate to be equal to the full-year non-GAAP effective income tax rate. The non-GAAP effective tax rate for 2011 was
38.6%.
38.6%.
Amounts may not add due to rounding.
19

(b) To eliminate settlement charge related to exit of Belgium cash-in-transit business.
(c) To eliminate employee benefit settlement loss related to Mexico. Portions of Brink’s Mexican subsidiaries’ accrued employee termination benefit were
paid in the second and third quarters of 2011. The employee termination benefit is accounted for under FASB ASC Topic 715, Compensation -
Retirement Benefits. Accordingly, the severance payments resulted in settlement losses.
paid in the second and third quarters of 2011. The employee termination benefit is accounted for under FASB ASC Topic 715, Compensation -
Retirement Benefits. Accordingly, the severance payments resulted in settlement losses.
(d) To eliminate the costs related to the retirement of the former CEO.
(e) To eliminate expenses related to U.S. retirement liabilities.
GAAP
Basis
Basis
Gains on
Acquisitions and
Asset Dispositions
(a)
Acquisitions and
Asset Dispositions
(a)
Belgium
Settlement
Charge (b)
Settlement
Charge (b)
Mexico
Employee
Benefit
Settlement
Losses (c)
Employee
Benefit
Settlement
Losses (c)
CEO
Retirement
Costs (d)
Retirement
Costs (d)
U.S.
Retirement
Plans (e)
Retirement
Plans (e)
Non-GAAP
Basis
Basis
Full Year 2011
Operating profit:
International
$
199.7
-
10.1
2.1
-
-
211.9
North America
31.4
-
-
-
-
3.2
34.6
Segment operating profit
231.1
-
10.1
2.1
-
3.2
246.5
Non-segment
(59.8)
(9.7)
-
-
4.1
24.8
(40.6)
Operating profit
$
171.3
(9.7)
10.1
2.1
4.1
28.0
205.9
Amounts attributable to Brink’s:
Income from continuing operations
$
73.0
(9.6)
6.4
1.5
2.6
17.7
91.6
Diluted EPS - continuing operations
1.52
(0.20)
0.13
0.03
0.05
0.37
1.90
Amounts may not foot due to rounding
(a) To eliminate gain recognized on the sale of the U.S. document destruction business, gains on available-for-sale equity and debt securities, gains related
to acquisition of controlling interest in subsidiaries that were previously accounted for as equity or cost method investments, and gains on sales of former
operating assets, as follows:
to acquisition of controlling interest in subsidiaries that were previously accounted for as equity or cost method investments, and gains on sales of former
operating assets, as follows:
Non-GAAP Reconciliations - Full-Year 2011
|
|
|
|
Full Year 2011
|
|
||
|
|
|
|
Operating Profit
|
|
EPS
|
|
|
|
Sale of U.S. Document Destruction business
|
$
|
(6.7)
|
|
(0.09)
|
|
|
|
Gains on available-for-sale equity and debt securities
|
|
-
|
|
(0.05)
|
|
|
|
Acquisition of controlling interests
|
|
(2.5)
|
|
(0.05)
|
|
|
|
Sale of former operating assets
|
|
(0.5)
|
|
(0.01)
|
|
|
|
|
$
|
(9.7)
|
|
(0.20)
|
|
20

Non-GAAP Reconciliations - Cash Flows
|
NON-GAAP CASH FLOWS FROM OPERATING ACTIVITIES - RECONCILED TO AMOUNTS REPORTED UNDER U.S. GAAP
|
||||||
|
|
|
First Half
|
||||
|
|
|
|
2012
|
|
|
2011
|
|
|
||||||
|
Decrease in certain customer obligations (a)
|
|
20.4
|
|
|
10.2
|
|
|
Discontinued operations (b)
|
|
-
|
|
|
(1.2)
|
|
|
|
|
|
|
|
|
|
|
|
Cash flows from operating activities - Non-GAAP
|
$
|
50.7
|
|
$
|
78.3
|
(a) To eliminate the change in the balance of customer obligations related to cash received and processed in certain of our secure cash logistics
operations. The title to this cash transfers to us for a short period of time. The cash is generally credited to customers’ accounts the following
day and we do not consider it as available for general corporate purposes in the management of our liquidity and capital resources.
operations. The title to this cash transfers to us for a short period of time. The cash is generally credited to customers’ accounts the following
day and we do not consider it as available for general corporate purposes in the management of our liquidity and capital resources.
(b) To eliminate cash flows related to our discontinued operations.
Non-GAAP cash flows from operating activities are supplemental financial measures that are not required by, or presented in accordance with
GAAP. The purpose of the non-GAAP cash flows from operating activities is to report financial information excluding the impact of cash received
GAAP. The purpose of the non-GAAP cash flows from operating activities is to report financial information excluding the impact of cash received
and processed in certain of our secure cash logistics operations, without cash flows from discontinued operations. We believe these measures are
helpful in assessing cash flows from operations, enable period-to-period comparability and are useful in predicting future operating cash flows.
Non-GAAP cash flows from operating activities should not be considered as an alternative to cash flows from operating activities determined in
accordance with GAAP and should be read in conjunction with our consolidated statements of cash flows.
21

|
NET DEBT RECONCILED TO GAAP
|
|
|
June 30,
|
|
December 31,
|
|
|||
|
|
|
|
2012
|
|
2011
|
|
|||
|
Debt:
|
|
|
|
|
|
||||
|
|
|
|
|
||||||
|
|
Long-term
|
|
|
368.3
|
|
364.0
|
|
||
|
|
|
|
|
|
|
||||
|
|
|
|
|
|
|
|
|
|
|
|
Cash and cash equivalents
|
|
|
126.9
|
|
182.9
|
|
|||
|
Less amounts held by cash logistics operations (a)
|
|
|
(5.7)
|
|
(25.1)
|
|
|||
|
|
|
|
Cash and cash equivalents available for general corporate purposes
|
|
|
121.2
|
|
157.8
|
|
|
|
|
|
|
|
|
|
|
|
|
|
|
|
Net Debt
|
|
$
|
284.6
|
|
231.6
|
|
|
(a) Title to cash received and processed in certain of our secure cash logistics operations transfers to us for a short period of time. The cash is
generally credited to customers’ accounts the following day and we do not consider it as available for general corporate purposes in the
management of our liquidity and capital resources and in our computation of Net Debt.
Net Debt is a supplemental non-GAAP financial measure that is not required by, or presented in accordance with GAAP. We use Net Debt as a
measure of our financial leverage. We believe that investors also may find Net Debt to be helpful in evaluating our financial leverage. Net Debt
measure of our financial leverage. We believe that investors also may find Net Debt to be helpful in evaluating our financial leverage. Net Debt
should not be considered as an alternative to Debt determined in accordance with GAAP and should be reviewed in conjunction with our
consolidated balance sheets. Set forth above is a reconciliation of Net Debt, a non-GAAP financial measure, to Debt, which is the most directly
comparable financial measure calculated and reported in accordance with GAAP. Net Debt excluding cash and debt in Venezuelan operations
was $308 million at June 30, 2012, and $242 million at December 31, 2011.
Non-GAAP Reconciliations - Net Debt
22