Attached files
| file | filename |
|---|---|
| 8-K - FORM 8-K - RAILAMERICA INC /DE | d384170d8k.htm |
| EX-99.1 - EX-99.1 - RAILAMERICA INC /DE | d384170dex991.htm |
 Second Quarter
2012 Supplemental Information
July 25, 2012
Exhibit 99.2 |
 Forward-Looking Statements
2
Certain items in this presentation and other information we provide from time to time may
constitute forward-looking statements within the meaning of the Private Securities
Litigation Reform Act of 1995 including, but not necessarily limited to, statements
relating to future events and financial performance. Words such as
“anticipates,” “expects,”
“intends,”
“plans,”
“projects,”
“believes,”
“appears,”
“may,”
“will,”
“would,”
“could,”
“should,”
“seeks,”
“estimates”
and variations on these words and similar
expressions are intended to identify such forward-looking statements. These statements are
based on management’s current expectations and beliefs and are subject to a number
of factors that could lead to actual results materially different from those described
in the forward-looking statements in this presentation, including operating ratio goals. RailAmerica, Inc. can give no
assurance that its expectations will be attained. Accordingly, you should not place undue
reliance on any forward-looking statements contained in this presentation. Factors
that could have a material adverse effect on our operations and future prospects or
that could cause actual results to differ materially from RailAmerica, Inc.’s expectations include, but are not limited to, prolonged
capital markets disruption and volatility, general economic conditions and business
conditions, our relationships with Class I railroads and other connecting carriers, our
ability to obtain railcars and locomotives from other providers on which we are
currently dependent, legislative and regulatory developments including rulings by the Surface
Transportation Board or the Railroad Retirement Board, strikes or work stoppages by our
employees, our transportation of hazardous materials by rail, rising fuel costs,
goodwill assessment risks, acquisition risks, competitive pressures within the industry, risks
related to the geographic markets in
which we operate; and other risks detailed in RailAmerica, Inc.'s filings with the Securities
and Exchange Commission, including our
Annual Report on Form 10-K and our Quarterly Reports on Form 10-Q. In addition,
new risks and uncertainties emerge from time to time, and it is not possible for
RailAmerica, Inc. to predict or assess the impact of every factor that may cause its
actual results to differ from those contained in any forward-looking statements.
Such forward-looking statements speak only as of the date of this presentation.
RailAmerica, Inc. expressly disclaims any obligation to release publicly any updates or revisions to any forward-
looking statements contained herein to reflect any change in its
expectations with regard thereto or change in events, conditions or
circumstances on which any statement is based. |
 Executive
Summary 3 |
 Second quarter
2012 overview 4
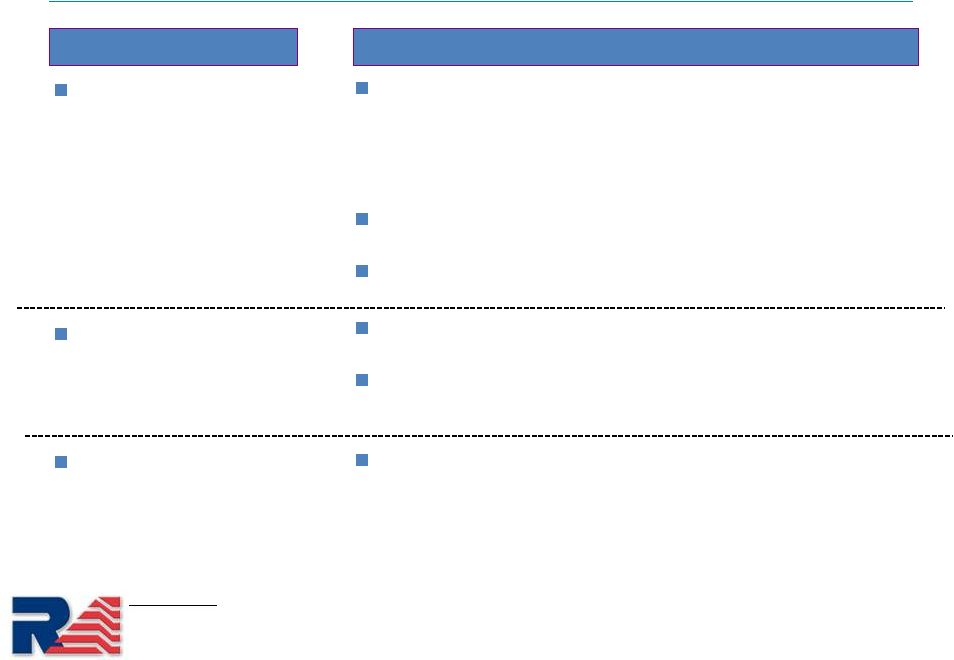
Strategic Focus
Accomplishments
Organic Growth
External Growth
Financial Flexibility
Revenue increased 12%
•
Carloads up 4%
•
Average freight revenue per car up 4%
•
Non-freight revenue up 26%
Operating income (excl. 45G, impairments & asset sales) up 28%
1
Adjusted net income
2
of $0.34 per share
Integrating two acquisitions
Robust industrial development pipelines
Redeemed $74 million of 9.25% Senior Notes
Note:
(1)
See page 20 for a reconciliation to GAAP. Reported operating income up 19%
for Q2 2012 versus Q2 2011. (2)
See page 21 for a reconciliation to GAAP. Reported net income of $0.23 per
share for Q2 2012. |
 Commercial
Update 5 |
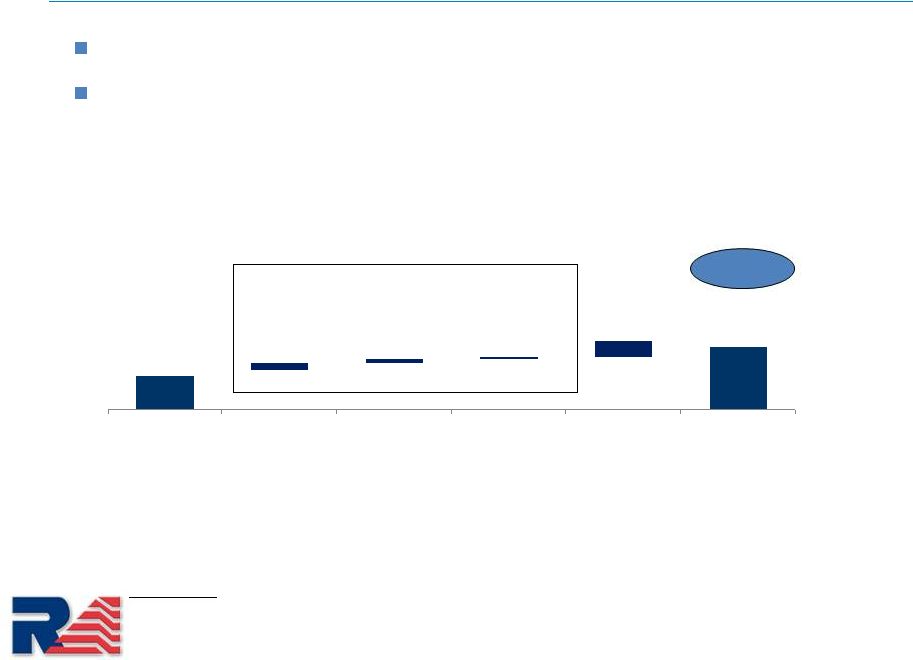 6
($in millions)
Q2 2012 revenue up $16.9 million versus Q2 2011.
Strong freight and non-freight revenue growth.
$139.2
$3.5
$2.3
$2.2
$8.9
$156.1
Q2 2011
Volume
Rev. Per Car
Fuel Surcharge
Non-Freight
Q2 2012
Freight Revenue up $8 million
Second quarter 2012 revenue up 12%
Note:
Numbers may not add or recalculate due to rounding.
+12% |
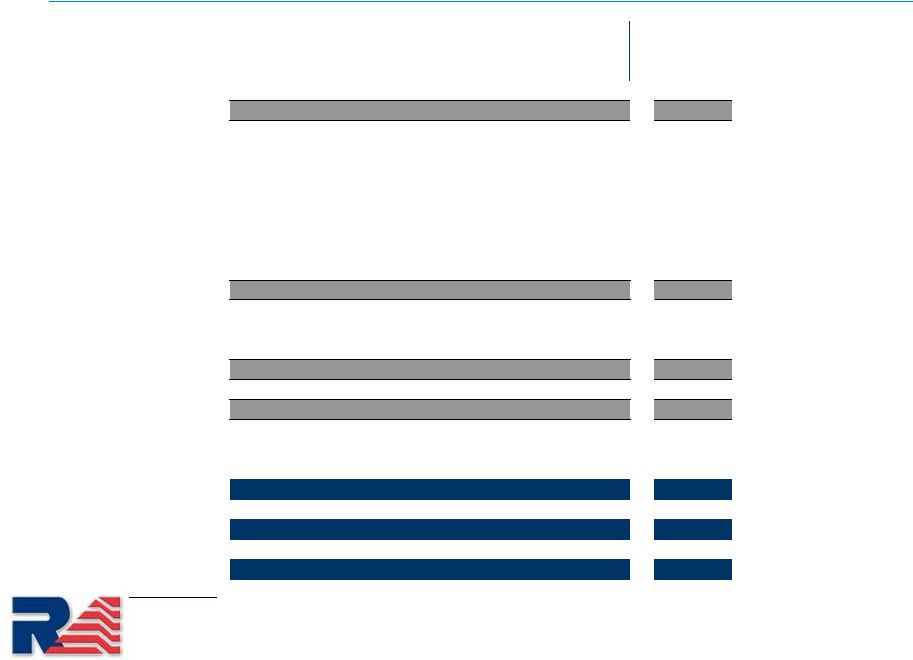   Second quarter 2012
carloads increased 4%, up 5% excluding coal 7
Note:
Numbers may not add or recalculate due to rounding.
Revenue
Q2
Q2 2012 vs.
Q1 2012 vs.
2012
Q2 2011
Q2 2011
Industrial Products Subtotal
97,787
4%
8%
Chemicals
24,151
-1%
7%
Pulp, Paper & Allied Products
17,177
0%
-8%
Metallic Ores and Metals
16,763
-9%
-1%
Waste & Scrap Materials
14,581
-6%
3%
Petroleum
9,912
19%
20%
Other
9,542
36%
29%
Motor Vehicles
5,661
113%
147%
Agricultural & Food Products Subtotal
50,122
4%
4%
Agricultural Products
36,273
6%
5%
Food or Kindred Products
13,849
-3%
1%
Coal
33,483
-3%
-4%
Construction Products Subtotal
38,374
8%
16%
Non-Metallic Minerals and Products
23,493
3%
9%
Forest Products
14,881
18%
24%
Total
219,766
4%
8%
Total (excluding coal)
186,283
5%
8%
"Same Railroad"
214,677
1%
5%
Carloads |
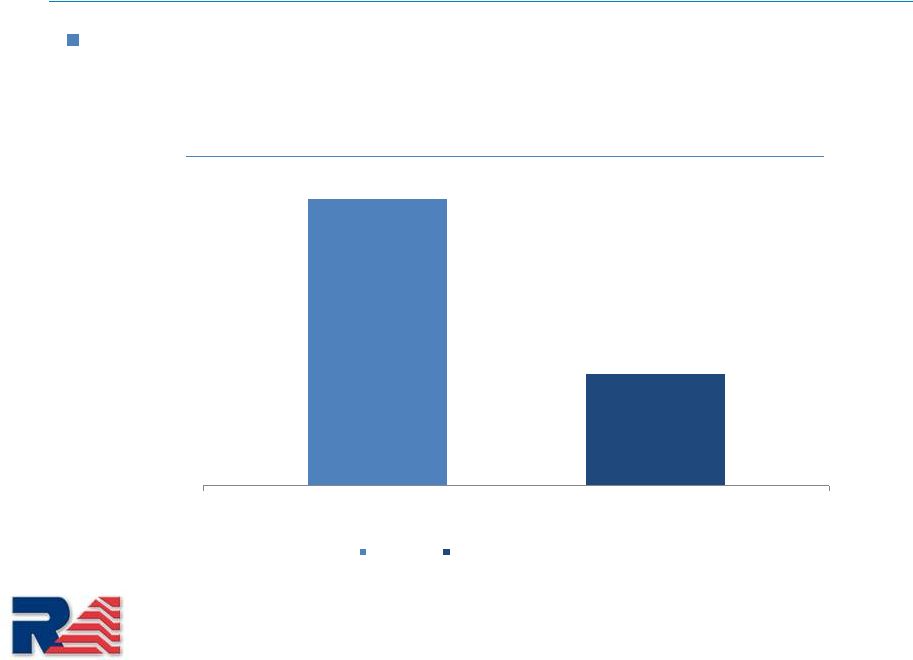 Second quarter
2012 average freight revenue per carload up 4% 8
Change in Average Freight Revenue per Carload
(Versus Prior Year Period)
3.8%
2.7%
Q2 2012 vs. Q2 2011
Reported
Excl Fuel Surcharge & Foreign Exchange
Core price increases of ~ 5% |
 Second quarter
non-freight revenue up 26% 9
Note:
Numbers may not add or recalculate due to rounding.
(1) Includes MQTR, WCOR/TNA and three Alabama roads (for partial
period). Three Alabama roads acquired 5/11/11 Non-freight revenue
increase was broad based led by engineering services, storage, demurrage, and
car repair. ($ millions)
Q2 2011
Q2 2012
% Change
Non-Freight Revenue
$33.6
$42.5
26%
Less Acquisitions
1
(0.0)
(2.7)
Organic Non-Freight Revenue
$33.6
$39.8
19%
Non-Freight Revenue Detail:
Engineering Services
$8.8
$11.5
31%
Car Storage
4.4
5.5
23%
Demurrage
4.3
5.1
20%
Car Repair
3.9
4.7
21%
Real Estate Lease Income
3.1
3.5
12%
Switching
1.9
2.4
27%
Car Hire Revenue
1.0
0.9
-17%
Other
6.2
9.0
45%
Total
$33.6
$42.5
26% |
 Operations
Update 10 |
 Continued focus
on operating ratio improvement 11
Operating Ratio –
excluding 45G benefit, asset sales and impairments improved
270 basis points
Fuel improved 210 basis points.
Other
expenses
excluding
fuel
and
acquisition
expense
improved
200
basis
points.
Note:
(1)
See page 20 for a reconciliation to GAAP.
(2)
Numbers may not add or recalculate due to rounding.
Q2 2011
Q2 2012
Operating Ratio -
Reported
79.4%
78.1%
Gain/Loss on Sale of Assets
0.0%
0.0%
Impairments
-2.3%
0.0%
Operating Ratio -
excluding asset sales and impairments
77.1%
78.1%
45G Credit
3.7%
0.0%
Operating Ratio -
excluding 45G benefit, asset sales and impairments
1
80.8%
78.1%
Acquisition / Transaction expenses
0.0%
1.4%
Fuel
10.5%
8.4%
Remaining expenses excluding fuel
70.3%
68.3%
% of Operating Revenue |
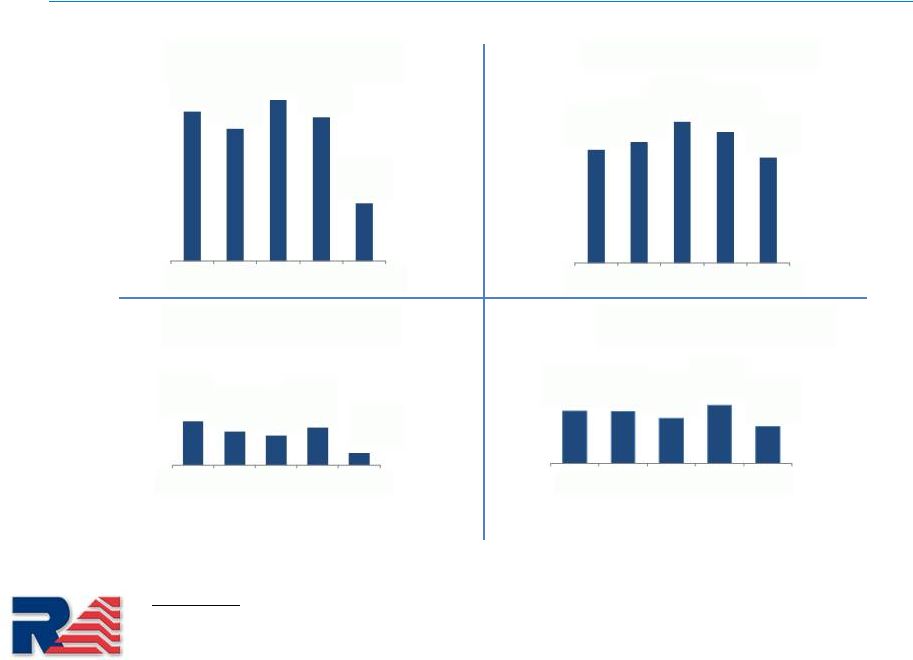 Safety
trends 12
Note:
RailAmerica includes Canadian railroads and excludes Atlas.
PI ratio rate per 200,000 man hours worked.
FRA = Federal Railroad Administration.
FRA Reportable Train
Accidents
FRA Reportable Train
Accident Ratio
0.77
0.76
0.66
0.85
0.54
2008
2009
2010
2011
2012 YTD
44
34
30
38
12
2008
2009
2010
2011
2012 YTD
26
23
28
25
10
2008
2009
2010
2011
2012 YTD
FRA Reportable Personal
Injuries
1.6
1.8
2.1
1.9
1.5
2008
2009
2010
2011
2012 YTD
Personal Injury (PI) Ratio |
 Financial
Update 13 |
 Second quarter
2012 net income of $0.23 per share 14
Note:
Numbers may not add due to rounding.
($ in millions except EPS)
Q2 2011
Q2 2012
($)
(%)
Operating revenue
$139.2
$156.1
$16.9
12%
Operating expenses
(110.5)
(121.9)
(11.4)
(10%)
Operating income
$28.7
$34.2
$5.5
19%
Interest expense
(18.1)
(10.3)
Other income (loss)
0.5
(5.5)
Income before taxes
$11.1
$18.4
$7.4
67%
Provision for income taxes
2.4
7.2
Net income
$8.7
$11.2
$2.5
29%
Less: Net loss attributable to noncontrolling interest
-
(0.2)
Net income (attributable to company)
$8.7
$11.4
$2.7
31%
EPS
-
diluted
$0.17
$0.23
Change |
 Second quarter
2012 adjusted net income was $0.34 per share 15
Note:
(1)
Q2 2012 cash taxes paid were $1
million.
(2)
Numbers may not add due to rounding.
After Tax
Per Share
Net income
$11,399
$0.23
Add:
Amortization of swap termination costs
859
0.02
Loss on extinguishment of debt and credit facility
3,570
0.07
Acquisition / strategic alternatives expense
1,376
0.03
Adjusted net income
$17,203
$0.34
Weighted Average common shares outstanding (diluted)
50,578
Q2 2012 |
 Second quarter
2012 detailed results compared to prior year 16
Note:
(1)
See page 20 for a reconciliation to GAAP.
(2)
Numbers may not add due to rounding.
(in thousands, except carloads and revenue per carload)
Q2 2011
% of
Revenue
Q2 2012
% of
Revenue
($)
(%)
Carloads
212,095
219,766
7,671
4%
Average Freight Revenue/Carload
$498
$517
$19
4%
Freight revenue
$105,567
$113,555
$7,988
8%
Non-freight revenue
33,648
42,541
8,893
26%
Operating revenue
$139,215
$156,096
$16,881
12%
Labor & benefits
$41,859
30%
$43,228
28%
$1,369
Equipment rents
8,889
6%
9,939
6%
1,050
Purchased services
11,327
8%
15,550
10%
4,223
Diesel fuel
14,578
11%
13,210
8%
(1,368)
Casualties & insurance
4,955
4%
5,306
3%
351
Materials
5,928
4%
9,746
6%
3,818
Joint facilities
2,550
2%
2,755
2%
205
Other expenses
10,672
8%
10,588
7%
(84)
Track maintenance expense reimbursement
(5,133)
-4%
-
0%
5,133
Loss (gain) on sales of assets
(64)
0%
5
0%
69
Impairment of assets
3,220
2%
-
0%
(3,220)
Depreciation expense
11,736
8%
11,594
7%
(142)
Operating expenses
$110,517
79.4%
$121,921
78.1%
$11,404
10%
Operating income
$28,698
20.6%
$34,175
21.9%
$5,477
19%
$26,721
19.2%
$34,180
21.9%
$7,459
28%
Change
Operating income excluding 45G benefit, asset sales and
impairments
(1) |
 Capital
expenditures 17
Capital Expenditures
Note:
Numbers may not add due to rounding.
($ in millions)
2011
2012
2011
2012
Maintenance
$16.8
$17.9
$24.5
$26.9
Project (non-NECR)
1.3
6.3
5.1
9.6
NECR High Speed Rail Project *
6.3
5.9
10.6
6.4
45G Credit
(4.0)
-
(4.0)
-
Reported Capex
$20.4
$30.1
$36.2
$42.9
* Sources of NECR Project Funding
$6.3
$5.9
$10.6
$6.4
NECR Grant
4.6
3.4
7.0
3.7
Scrap Sales Related to NECR Project
1.5
-
2.0
0.7
RA Contribution
0.3
2.5
1.7
2.0
Second Quarter
Second Quarter YTD |
 Strong capital
structure supports organic growth and strategic investments 18
Capitalization
Note:
Numbers may not add due to rounding.
Tender / Refinancing completed in Q1
Senior
Notes
redeemed
in
January
and
June
2012
–
No
notes
outstanding
($ in millions)
At December
31, 2011
At June 30,
2012
Cash & equivalents
$91.0
$51.0
Senior Secured Notes
573.6
-
Term Loan B
-
580.8
Other debt
2.1
60.0
Total debt
$575.7
$640.7
Stockholders equity
$680.1
$657.1
Total capitalization
$1,255.8
$1,297.8
Total debt / Total capitalization
46%
49%
Net debt / Total capitalization
39%
45% |
 Appendix
19 |
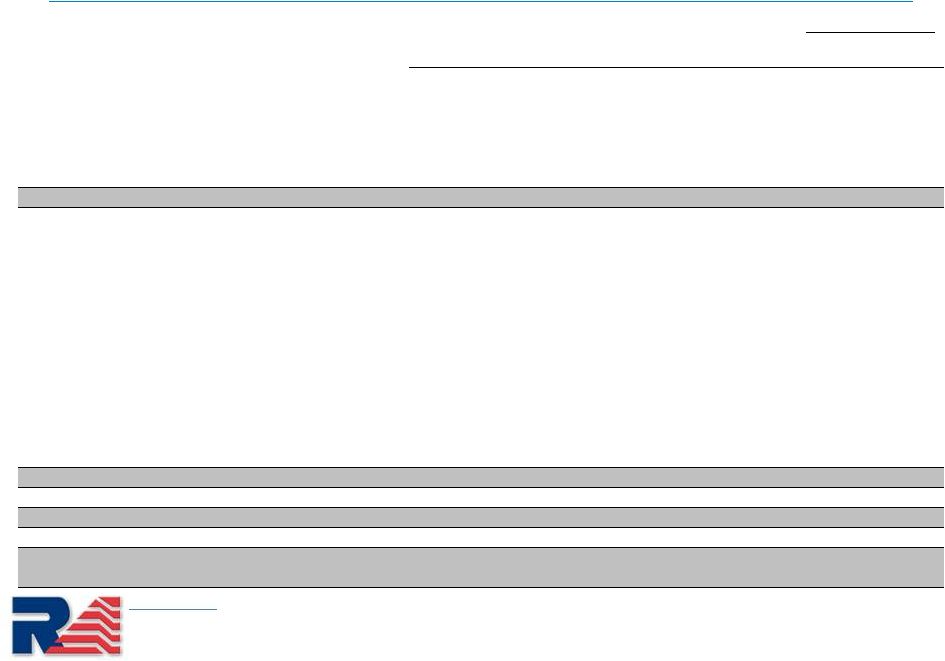
 Operating Income
and Operating Ratio Excluding 45G Benefit Reconciliation to GAAP & Operating Income
and Operating Ratio Excluding 45G Benefit, Asset Sales & Impairments Reconciliation to GAAP
20
Note:
(1)
Numbers may not add due to rounding.
($ in thousands)
Operating revenue
$139,215
$156,096
Operating expense
110,517
121,921
Operating income, reported
28,698
34,175
Operating ratio reported
79.4%
78.1%
Less: Benefit from 45G credits
(5,133)
3.7%
-
0.0%
Operating income excluding 45G Benefit
23,565
34,175
Operating ratio excluding 45G Benefit
83.1%
78.1%
Net (gain) loss on sale of assets
(64)
0.0%
5
0.0%
Impairment of assets
3,220
-2.3%
-
0.0%
Operating income excluding 45G Benefit, Asset Sales & Impairments
$26,721
$34,180
Operating ratio, excluding 45G Benefit, Asset Sales & Impairments
80.8%
78.1%
Q2 2012
Q2 2011
Operating Income Excluding 45G Benefit, Operating Ratio Excluding 45G Benefit, Operating Income
Excluding 45G Benefit, Asset Sales & Impairments and Operating Ratio Excluding 45G Benefit,
Asset Sales & Impairments are supplemental measures of profitability that are not calculated or presented in
accordance with U.S. generally accepted accounting principles (“GAAP”). We use
non-GAAP financial measures as a supplement to our GAAP results in order to provide a more
complete understanding of the factors and trends affecting our business. However, Operating Income Excluding 45G Benefit,
Operating Ratio Excluding 45G Benefit, Operating Income Excluding 45G Benefit, Asset Sales &
Impairments and Operating Ratio Excluding 45G Benefit, Asset Sales & Impairments have
limitations as analytical tools. They are not measurements of our profitability under GAAP and should not be considered as
alternatives to Operating Income or Operating Ratio as measures of profitability.
Operating Income Excluding 45G Benefit and Operating Ratio Excluding 45G Benefit assist us in
measuring our performance and profitability of our operations without the impact of monetizing
the 45G tax benefit. Operating Income Excluding 45G Benefit, Asset Sales & Impairments and Operating Ratio
Excluding 45G Benefit, Asset Sales & Impairments assist us in measuring our performance and
profitability of our operations without the impact of monetizing the 45G tax benefit, Asset
Sales and Impairments. The following table sets forth the reconciliation of Operating Income Excluding 45G Benefit
from our Operating Income, Operating Ratio Excluding 45G Benefit from our Operating Ratio, Operating
Income Excluding 45G Benefit, Asset Sales & Impairments from our Operating Income and
Operating Ratio Excluding 45G Benefit, Asset Sales & Impairments from our Operating Ratio.
|
 Adjusted income
from continuing operations reconciliation to GAAP 21
Note:
(1)
Numbers may not add due to rounding.
(In thousands, except per share data)
After Tax
Per Share
After Tax
Per Share
Net income
$8,700
$0.17
$11,399
$0.23
Add:
Amortization of swap termination costs
1,953
0.04
859
0.02
Impairment of assets
1,964
0.04
-
-
Loss on extinguishment of debt and credit facility
-
-
3,570
0.07
Acquisition / strategic alternatives expense
148
0.00
1,376
0.03
Adjusted net income
$12,765
$0.24
$17,203
$0.34
Weighted Average common shares outstanding (diluted)
52,282
50,578
Q2 2011
Q2 2012
Adjusted net income (loss) is a supplemental measure of profitability that is not calculated or
presented in accordance with U.S. generally accepted accounting principles
(“GAAP”). We use non-GAAP financial measures as a supplement to our GAAP results in order to provide a more complete understanding of the
factors and trends affecting our business. However, Adjusted net income (loss) has limitations
as an analytical tool. It is not a measurement of our profitability under GAAP and should
not be considered as an alternative to Net income (loss) as a measure of profitability.
Adjusted net income (loss) assists us in measuring our performance and profitability of our operations
without the impact of transaction costs related to debt and credit facility extinguishment,
exploration of strategic alternatives acquisitions, impairment of assets and swap termination. The following table sets forth
the reconciliation of Adjusted net income (loss).
|
 Adjusted EBITDA
reconciliation to GAAP 22
Adjusted EBITDA, is a supplemental measure of liquidity that is not calculated or
presented in accordance with U.S. generally accepted accounting principles
(“GAAP”). We use non-GAAP financial measures as a supplement to our GAAP results in order to provide a more complete
understanding of the factors and trends affecting our business. However, Adjusted
EBITDA has limitations as an analytical tool. It is not a measurement of our
cash flows from operating activities under GAAP and should not be considered as an alternative to cash flow from operating
activities as a measure of liquidity.
Adjusted EBITDA assists us in monitoring our ability to undertake key investing and
financing functions such as making investments, transferring property,
paying dividends, and incurring additional indebtedness, which are generally prohibited by the covenants under our senior secured notes
unless we meet certain financial ratios and tests. Adjusted EBITDA represents
EBITDA before impairment of assets, equity compensation costs and
acquisition costs. EBITDA, also a non-GAAP financial measure, is defined as net income (loss) before interest expense, provision for (benefit
from) income taxes and depreciation and amortization.
The following tables set forth the reconciliation of Adjusted EBITDA from our cash
flow from operating activities (in thousands): Q1 2012
Q2 2012
YTD 2012
Cash flows from operating activities to Adjusted EBITDA Reconciliation:
Net cash provided by operating activities
$ 19,552
$ 53,760
$ 73,312
Changes in working capital accounts
16,977
(14,958)
2,019
Depreciation and amortization, including amortization of debt issuance costs classified in
interest expense
(11,432)
(12,393)
(23,825)
Amortization of swap termination costs
(1,591)
(1,363)
(2,954)
Net (gain) loss on sale or disposal of properties
163
(5)
158
Equity compensation costs
(5,727)
(1,920)
(7,647)
Loss on early extinguishment of notes
(82,441)
(5,666)
(88,107)
Deferred income taxes
24,280
(6,258)
18,022
Net income
(40,219)
11,197
(29,022)
Add:
Provision for income taxes
(23,258)
7,235
(16,023)
Interest expense, including amortization costs
13,411
10,267
23,678
Depreciation and amortization
10,406
11,594
22,000
EBITDA
(39,660)
40,293
633
Add:
Equity compensation costs
5,727
1,920
7,647
Loss on early extinguishment of notes
82,441
5,666
88,107
Acquisition / strategic alternative costs
380
2,184
2,564
Noncontrolling interest
-
(9)
(9)
Adjusted EBITDA
$ 48,888
$ 50,054
$ 98,942 |
 Adjusted EBITDA
reconciliation to GAAP (continued) 23
Q1 2011
Q2 2011
YTD 2011
Cash flows from operating activities to Adjusted EBITDA Reconciliation:
Net cash provided by operating activities
$ 23,123
$ 29,605
$ 52,728
Changes in working capital accounts
1,015
1,659
2,674
Depreciation and amortization, including amortization of debt issuance costs
classified in interest expense
(12,945)
(12,919)
(25,864)
Amortization of swap termination costs
(3,677)
(3,201)
(6,878)
Net (gain) loss on sale or disposal of properties
(207)
64
(143)
Impairment of assets
-
(3,220)
(3,220)
Equity compensation costs
(2,609)
(2,370)
(4,979)
Deferred income taxes
(615)
(918)
(1,533)
Net income
4,085
8,700
12,785
Add:
Provision for income taxes
2,067
2,350
4,417
Interest expense, including amortization costs
18,591
18,143
36,734
Depreciation and amortization
11,764
11,736
23,500
EBITDA
36,507
40,929
77,436
Add:
Equity compensation costs
2,609
2,370
4,979
Severance -
non equity
1,210
-
1,210
Impairment of assets
-
3,220
3,220
Acquisition / strategic alternative costs
72
243
315
Noncontrolling interest
-
-
Adjusted EBITDA
$ 40,398
$ 46,762
$ 87,160 |
  45G tax credit
24
Note:
(1)
Numbers may not add due to rounding.
($ in millions)
Q1
Q2
Q3
Q4
FY
2009 Actual
Income Statement Benefit
4.1
4.1
4.5
3.9
16.7
Capital Expenditure Benefit
-
-
-
5.2
5.2
2010 Actual
Income Statement Benefit
-
-
-
17.6
17.6
Capital Expenditure Benefit
-
-
-
4.2
4.2
2011 Actual
Income Statement Benefit
4.2
5.1
3.9
3.6
16.7
Capital Expenditure Benefit
-
4.0
-
1.4
5.4
Financial Impact of 45G Credit Assignment |
 Swap
amortization 25
Note:
(1)
Numbers may not add due to rounding.
($ in millions)
2012
2013
2014
Q1
$1.6
$0.8
$0.2
Q2
$1.4
$0.7
Q3
$1.3
$0.6
Q4
$1.1
$0.5
FY
(1)
$5.3
$2.5
$0.2 |