Attached files
| file | filename |
|---|---|
| 8-K - FORM 8-K - PRIVATEBANCORP, INC | d382667d8k.htm |
Exhibit 99.1

For further information:
Media Contact:
Amy Yuhn
312-564-1378
ayuhn@theprivatebank.com
Investor Relations Contact:
Sarah Lewensohn
312-564-3894
slewensohn@theprivatebank.com
For Immediate Release
PrivateBancorp Reports Second Quarter Earnings Per Share of $0.19
Earnings per share up 27 percent from first quarter driven by improved credit quality;
Total loans grew $214 million from prior quarter
CHICAGO, July 24, 2012 – PrivateBancorp, Inc. (NASDAQ: PVTB) today reported net income available to common shareholders of $14.1 million, or $0.19 per diluted share, for the second quarter 2012, compared to $5.5 million, or $0.08 per diluted share, for the second quarter 2011, and $10.8 million, or $0.15 per diluted share, for the first quarter 2012. For the six months ended June 30, 2012, the Company had net income available to common shareholders of $24.9 million, or $0.34 per diluted share, compared to $13.0 million, or $0.18 per diluted share, for the six months ended June 30, 2011.
“Continuing to build client relationships and driving overall asset quality improvement led to our highest quarterly profit since the launch of our commercial banking strategy in late 2007,” said Larry D. Richman, President and Chief Executive Officer, PrivateBancorp, Inc. “Persistently low interest rates, along with the competitive commercial banking landscape, have pressured our margins. Overall I am pleased with the steady execution of our strategy and the calling effort of our bankers, which is keeping our pipeline solid.
“I believe our performance over the past year demonstrates the strength of our core commercial business model. Compared to a year ago, total loans have increased more than $760 million, while problem loans have declined almost $470 million. Our consistent and focused business development efforts have helped us add clients and increase product sales, which have led to strong growth in treasury management, capital markets and mortgage. All of this helped drive higher net revenue and improved profits for the quarter as compared to second quarter 2011.”
Highlights
| • | Net income was $14.1 million, up 30 percent from the first quarter 2012, largely as a result of lower provision for loan losses. |
| • | Net interest income of $105.3 million increased from $104.4 million in the first quarter 2012, as growth in loans offset the impact of net interest margin compression. |
| • | Operating profit of $48.4 million declined $3.9 million from first quarter 2012, primarily as a result of higher net foreclosed property expense. |
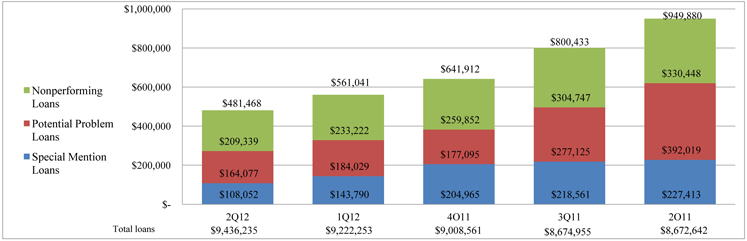
| • | Asset quality continued to improve during the quarter with non-performing, special mention and potential problem loans declining 14 percent from March 31, 2012. The provision for loan losses declined to $17.4 million, from $27.6 million in the first quarter of 2012. |
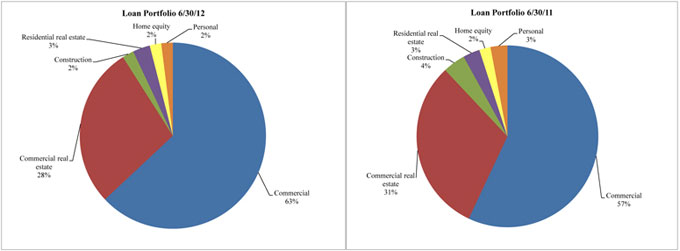
| • | Total loans grew $214.0 million to $9.4 billion at June 30, 2012, driven by growth in commercial and industrial loans from new relationships and existing clients, which now comprise 63 percent of the loan portfolio at quarter end. |
Operating Performance
Net revenue was $132.3 million in the second quarter 2012, an increase of 8 percent compared to $122.8 million in the second quarter 2011, and relatively flat as compared to $132.6 million in the first quarter 2012. Operating profit was $48.4 million in the second quarter 2012, compared to $47.1 million in the same period prior year and $52.3 million in the prior quarter. For the second quarter 2012, operating profit declined primarily due to higher net foreclosed property expense, which included $9.2 million of valuation adjustments, with the majority of the adjustments relating to land parcels.
Net interest income was $105.3 million for the second quarter 2012, up 5 percent from $100.5 million for the second quarter 2011 and up 1 percent from $104.4 million for the first quarter 2012. Growth in average loan balances of 5 percent over the past year and the 12 basis point decline in funding costs contributed to a $4.8 million increase in net interest income as compared to the second quarter 2011. In comparison to the first quarter 2012, the 4 percent increase in average loan balances in the second quarter offset the impact of declining yields within the loan and investment portfolios.
Net interest margin was 3.46 percent for the second quarter 2012, up from 3.36 percent in the same period prior year and down from 3.53 percent in the prior quarter. The impact to net interest margin from loan fees this quarter was 4 basis points lower than in the prior quarter. While overall changes in the mix of the loan portfolio over the past year have been favorable to net interest margin, average yields on investments and new loan production are generally trending lower.
Non-interest income was $26.2 million in the second quarter 2012, compared to $21.6 million in the second quarter 2011, and $27.5 million in the first quarter 2012. The 22 percent growth of non-interest income as compared to the second quarter of 2011 was a result of higher volumes in mortgage banking and treasury management, and increased capital markets revenue. Non-interest income declined compared to the first quarter 2012, from lower capital markets revenue. Second quarter capital markets revenue included a negative credit valuation adjustment of $830,000, whereas the first quarter results included a positive credit value adjustment of $19,000.
Expenses
Non-interest expense was $83.9 million for the second quarter 2012, compared to $75.7 million for the second quarter 2011 and $80.2 million for the first quarter 2012. The increase in non-interest expense was primarily driven by net foreclosed property expense, which was up 59 percent compared to the same period prior year and up 44 percent compared to the prior quarter. Net foreclosed property expense included $9.2 million of valuation adjustments.
The effective tax rate for the quarter was 43.0 percent and continues to be impacted by the non-deductibility of certain compensation expense as well as a reduction in tax benefits of previously awarded stock-based compensation. The Company continues to project an effective tax rate for the full year 2012 ranging from 41 to 42 percent.
Credit Quality
The Company’s asset quality continued to improve during the second quarter 2012. Non-performing assets declined to $319.2 million at June 30, 2012, down 30 percent from $454.4 million at June 30, 2011, and down 11 percent from $356.7 million at March 31, 2012. Non-performing assets to total assets were 2.47 percent at June 30, 2012, compared to 3.75 percent a year ago, and 2.83 percent at March 31, 2012. Non-performing loans were $209.3 million at the end of the second quarter 2012, a 37 percent decline from $330.4 million a year ago, and a 10 percent decline from $233.2 million at the end of the first quarter 2012. Non-performing loan inflows were $57.7 million during the second quarter 2012, down $11.9 million from the prior quarter. Special mention and potential problem loans declined 56 percent from the second quarter 2011, and 17 percent from the first quarter 2012. Based on ongoing workout and disposition activity, the Company expects problem assets will continue to trend lower in the second half of 2012, driving further improvement in asset quality metrics.
During the second quarter, the Company disposed of $50.8 million of problem assets, with an incremental charge of 2 percent based on the carrying value net of specific reserves at the time of disposition.
The reduction of the allowance for loan losses reflects the overall improvement in asset quality, the reduced requirement for specific reserves, lower charge-offs, and an increase of recoveries. At June 30, 2012, the allowance for loan losses was $174.3 million, or 1.85 percent of total loans, compared to
$206.3 million, or 2.38 percent of total loans, at June 30, 2011, and $183.8 million, or 1.99 percent of total loans at March 31, 2012. As a percentage of non-performing loans the allowance for loan losses was 83 percent at the end of the second quarter 2012, compared to 62 percent a year ago, and 79 percent at the end of the first quarter 2012.
The Company benefited from $6.9 million of recoveries this quarter, compared to an average of $3.1 million over the last four quarters. Charge-offs declined to $33.9 million for the second quarter 2012, from $45.3 million for the same period prior year and $39.7 million for the prior quarter. The second quarter 2012 provision for loan losses was $17.4 million, excluding covered loan provision, down from $31.7 million in the same period prior year and $27.6 million in the prior quarter.
Credit quality results exclude $244.8 million in covered assets as of the end of the second quarter 2012, referring to certain assets acquired through an FDIC-assisted transaction that are subject to a loss-sharing agreement, compared to $346.5 million in the second quarter 2011 and $276.5 million in the first quarter 2012.
Balance Sheet
Total loans were $9.4 billion at June 30, 2012, compared to $9.2 billion at March 31, 2012. The 2 percent growth in total loans this quarter was primarily from new commercial and industrial relationships, while revolver usage has remained flat over the last several quarters. The Company funded $430.3 million in loans to new relationships during the second quarter 2012.
Commercial and industrial loans continued to grow from March 31, 2012, and comprised 63 percent of the total loan portfolio at June 30, 2012. Total assets were $12.9 billion at June 30, 2012, up from $12.6 billion at March 31, 2012.
Total deposits were $10.7 billion at June 30, 2012, up from $10.4 billion at March 31, 2012. Non-interest bearing deposits comprised 27 percent of total deposits at June 30, 2012, compared to 29 percent of total deposits at March 31, 2012. Brokered deposits were $1.5 billion, or 14 percent of total deposits, at June 30, 2012, as compared to $1.0 billion, or 9 percent of total deposits, at March 31, 2012.
The Company’s investment securities portfolio was $2.4 billion at June 30, 2012, compared to $2.3 billion at March 31, 2012. The securities portfolio is primarily comprised of U.S. government agency backed mortgage pools, agency collateralized mortgage obligations, and investment grade municipal bonds.
Capital
As of June 30, 2012, the Company’s total risk-based capital ratio was 14.12 percent, the Tier 1 risk-based capital ratio was 12.25 percent and the leverage ratio was 11.20 percent. Tier 1 common capital ratio was 8.05 percent and tangible common equity ratio was 7.67 percent at the end of the second quarter 2012.
Quarterly Conference Call and Webcast Presentation
PrivateBancorp will host a conference call on Tuesday, July 24, 2012, at 10 a.m. CT. The call may be accessed by telephone at (888) 782-9127 (U.S. and Canada) or (706) 634-5643 (International) and entering passcode #93482670. A live webcast of the call can be accessed on the Company website at www.theprivatebank.com by visiting the Investor Relations tab under the About Us section. A rebroadcast will be available beginning approximately two hours after the call until midnight on July 26, 2012, by calling (855) 859-2056 (U.S. and Canada) or (404) 537-3406 (International) and entering passcode # 93482670.
About PrivateBancorp, Inc.
PrivateBancorp, Inc., through its subsidiaries, delivers customized business and personal financial services to middle-market companies, as well as business owners, executives, entrepreneurs and families in all of the markets and communities we serve. As of June 30, 2012, the Company had 34 offices in 9 states and $12.9 billion in assets. The Company website is www.theprivatebank.com.
Forward-Looking Statements
Statements contained in this press release that are not historical facts may constitute forward-looking statements within the meaning of federal securities laws. Our ability to predict results or the actual effects of future plans, strategies or events is inherently uncertain. Factors which could cause actual results to differ from those reflected in forward-looking statements include, but are not limited to: unforeseen credit quality problems or further deterioration in problem assets that could result in charge-offs greater than we have anticipated in our allowance for loan losses; adverse developments impacting one or more large credits; the extent of further deterioration in real estate values in our market areas, particularly in the Chicago area; difficulties in resolving problem credits or slower than anticipated dispositions of other real estate owned which may result in increased losses or higher credit-related operating costs; continued uncertainty regarding U.S. and global economic recovery and economic outlook, and ongoing volatility in market conditions, that may impact credit quality or prolong weakness in demand for loans or other banking products and services; unanticipated withdrawals of significant client deposits; the availability of cost-effective sources of liquidity or funding; the terms and availability of capital to the extent necessary to repay TARP preferred stock or otherwise required; loss of key personnel or an inability to recruit and retain appropriate talent; unanticipated changes in interest rates or significant tightening of credit spreads; increased competitive pricing pressures; uncertainty relating to recently proposed regulatory capital rules that could, depending on the nature of our assets, require us to maintain higher levels of regulatory capital; uncertainty regarding implications of recently adopted or proposed rules and regulations, or those remaining to be proposed in connection with implementation of the Dodd-Frank Act that may negatively affect our revenues or profitability; other legislative, regulatory or accounting changes affecting financial services companies and/or the products
and services offered by financial services companies; or failures or disruptions to our data processing or other information or operational systems. Forward-looking statements are subject to risks, assumptions and uncertainties and could be significantly affected by many factors, including those set forth in the “Risk Factors” section of our Form 10-K for the year ended December 31, 2011 as well as those set forth in our subsequent periodic and current reports filed with the SEC. These factors should be considered in evaluating forward-looking statements and undue reliance should not be placed on our forward-looking statements. Forward-looking statements speak only as of the date they are made and we assume no obligation to update any of these statements in public filings in light of future events unless required under the federal securities laws.
Non-GAAP Measures
This press release contains both financial measures based on accounting principles generally accepted in the United States (GAAP) and non-GAAP based financial measures. The Company believes that these non-GAAP financial measures provide information useful to investors in understanding the underlying operational performance of the Company, its business, and performance trends and facilitates comparisons with the performance of others in the banking industry. If non-GAAP financial measures are used, the comparable GAAP financial measure, as well as the reconcilement to the comparable GAAP financial measure, can be found in this press release. These disclosures should not be viewed as a substitute for operating results determined in accordance with GAAP, nor are they necessarily comparable to non-GAAP performance measures that may be presented by other companies.
Editor’s Note: Financial highlights attached.
Consolidated Income Statements
| (Amounts in thousands except per share data) |

|
| Three Months Ended | Six Months Ended | |||||||||||||||
| June 30, | June 30, | |||||||||||||||
| 2012 | 2011 | 2012 | 2011 | |||||||||||||
| unaudited | unaudited | unaudited | unaudited | |||||||||||||
| Interest Income |
||||||||||||||||
| Loans, including fees |
$ | 105,142 | $ | 102,391 | $ | 208,681 | $ | 208,038 | ||||||||
| Federal funds sold and other short-term investments |
133 | 399 | 265 | 735 | ||||||||||||
| Securities: |
||||||||||||||||
| Taxable |
14,854 | 15,568 | 30,234 | 30,958 | ||||||||||||
| Exempt from Federal income taxes |
1,336 | 1,387 | 2,636 | 2,873 | ||||||||||||
|
|
|
|
|
|
|
|
|
|||||||||
| Total interest income |
121,465 | 119,745 | 241,816 | 242,604 | ||||||||||||
| Interest Expense |
||||||||||||||||
| Interest-bearing demand deposits |
799 | 587 | 1,435 | 1,229 | ||||||||||||
| Savings deposits and money market accounts |
4,265 | 6,082 | 8,867 | 12,744 | ||||||||||||
| Brokered and time deposits |
5,394 | 6,528 | 10,411 | 13,220 | ||||||||||||
| Short-term borrowings |
123 | 566 | 265 | 1,393 | ||||||||||||
| Long-term debt |
5,538 | 5,479 | 11,116 | 10,962 | ||||||||||||
|
|
|
|
|
|
|
|
|
|||||||||
| Total interest expense |
16,119 | 19,242 | 32,094 | 39,548 | ||||||||||||
|
|
|
|
|
|
|
|
|
|||||||||
| Net interest income |
105,346 | 100,503 | 209,722 | 203,056 | ||||||||||||
| Provision for loan and covered loan losses |
17,038 | 31,093 | 44,739 | 68,671 | ||||||||||||
|
|
|
|
|
|
|
|
|
|||||||||
| Net interest income after provision for loan and covered loan losses |
88,308 | 69,410 | 164,983 | 134,385 | ||||||||||||
|
|
|
|
|
|
|
|
|
|||||||||
| Non-interest Income |
||||||||||||||||
| Trust and Investments |
4,312 | 4,720 | 8,531 | 9,382 | ||||||||||||
| Mortgage banking |
2,915 | 704 | 5,578 | 2,106 | ||||||||||||
| Capital markets products |
6,033 | 3,871 | 13,382 | 8,360 | ||||||||||||
| Treasury management |
5,260 | 4,453 | 10,414 | 8,778 | ||||||||||||
| Loan and credit-related fees |
6,372 | 5,290 | 12,899 | 11,188 | ||||||||||||
| Deposit service charges and fees and other income |
1,644 | 1,884 | 3,131 | 4,368 | ||||||||||||
| Net securities (losses) gains |
(290 | ) | 670 | (185 | ) | 1,037 | ||||||||||
|
|
|
|
|
|
|
|
|
|||||||||
| Total non-interest income |
26,246 | 21,592 | 53,750 | 45,219 | ||||||||||||
|
|
|
|
|
|
|
|
|
|||||||||
| Non-interest Expense |
||||||||||||||||
| Salaries and employee benefits |
42,177 | 38,636 | 84,875 | 77,193 | ||||||||||||
| Net occupancy expense |
7,653 | 7,545 | 15,332 | 15,077 | ||||||||||||
| Technology and related costs |
3,273 | 2,729 | 6,569 | 5,390 | ||||||||||||
| Marketing |
3,058 | 2,500 | 5,218 | 4,443 | ||||||||||||
| Professional services |
2,247 | 2,312 | 4,204 | 4,646 | ||||||||||||
| Outsourced servicing costs |
2,093 | 1,852 | 3,803 | 4,006 | ||||||||||||
| Net foreclosed property expenses |
11,894 | 7,485 | 20,129 | 13,791 | ||||||||||||
| Postage, telephone, and delivery |
882 | 931 | 1,751 | 1,819 | ||||||||||||
| Insurance |
4,239 | 5,092 | 8,544 | 12,432 | ||||||||||||
| Loan and collection expense |
2,918 | 4,247 | 6,075 | 6,800 | ||||||||||||
| Other expenses |
3,424 | 2,335 | 7,587 | 5,416 | ||||||||||||
|
|
|
|
|
|
|
|
|
|||||||||
| Total non-interest expense |
83,858 | 75,664 | 164,087 | 151,013 | ||||||||||||
|
|
|
|
|
|
|
|
|
|||||||||
| Income before income taxes |
30,696 | 15,338 | 54,646 | 28,591 | ||||||||||||
| Income tax provision |
13,192 | 6,320 | 22,887 | 8,599 | ||||||||||||
|
|
|
|
|
|
|
|
|
|||||||||
| Net income |
17,504 | 9,018 | 31,759 | 19,992 | ||||||||||||
| Net income attributable to noncontrolling interests |
— | 58 | — | 130 | ||||||||||||
|
|
|
|
|
|
|
|
|
|||||||||
| Net income attributable to controlling interests |
17,504 | 8,960 | 31,759 | 19,862 | ||||||||||||
| Preferred stock dividends and discount accretion |
3,442 | 3,419 | 6,878 | 6,834 | ||||||||||||
|
|
|
|
|
|
|
|
|
|||||||||
| Net income available to common stockholders |
$ | 14,062 | $ | 5,541 | $ | 24,881 | $ | 13,028 | ||||||||
|
|
|
|
|
|
|
|
|
|||||||||
| Per Common Share Data |
||||||||||||||||
| Basic earnings per share |
$ | 0.19 | $ | 0.08 | $ | 0.35 | $ | 0.18 | ||||||||
| Diluted earnings per share |
$ | 0.19 | $ | 0.08 | $ | 0.34 | $ | 0.18 | ||||||||
| Cash dividends declared |
$ | 0.01 | $ | 0.01 | $ | 0.02 | $ | 0.02 | ||||||||
| Weighted-average common shares outstanding |
70,956 | 70,428 | 70,868 | 70,388 | ||||||||||||
| Weighted-average diluted common shares outstanding |
71,147 | 70,663 | 71,041 | 70,602 | ||||||||||||
| Note 1: | Certain reclassifications have been made to prior period financial statements to place them on a basis comparable with the current period financial statements. |
| Quarterly Consolidated Income Statements Unaudited
(Amounts in thousands except per share data) |

|
| 2Q12 | 1Q12 | 4Q11 | 3Q11 | 2Q11 | ||||||||||||||||
| Interest Income |
||||||||||||||||||||
| Loans, including fees |
$ | 105,142 | $ | 103,539 | $ | 102,897 | $ | 102,174 | $ | 102,391 | ||||||||||
| Federal funds sold and other short-term investments |
133 | 132 | 215 | 231 | 399 | |||||||||||||||
| Securities: |
||||||||||||||||||||
| Taxable |
14,854 | 15,380 | 15,263 | 15,196 | 15,568 | |||||||||||||||
| Exempt from Federal income taxes |
1,336 | 1,300 | 1,273 | 1,293 | 1,387 | |||||||||||||||
|
|
|
|
|
|
|
|
|
|
|
|||||||||||
| Total interest income |
121,465 | 120,351 | 119,648 | 118,894 | 119,745 | |||||||||||||||
| Interest Expense |
||||||||||||||||||||
| Interest-bearing demand deposits |
799 | 636 | 585 | 625 | 587 | |||||||||||||||
| Savings deposits and money market accounts |
4,265 | 4,602 | 4,857 | 5,356 | 6,082 | |||||||||||||||
| Brokered and time deposits |
5,394 | 5,017 | 5,561 | 5,895 | 6,528 | |||||||||||||||
| Short-term borrowings |
123 | 142 | 152 | 466 | 566 | |||||||||||||||
| Long-term debt |
5,538 | 5,578 | 5,511 | 5,463 | 5,479 | |||||||||||||||
|
|
|
|
|
|
|
|
|
|
|
|||||||||||
| Total interest expense |
16,119 | 15,975 | 16,666 | 17,805 | 19,242 | |||||||||||||||
|
|
|
|
|
|
|
|
|
|
|
|||||||||||
| Net interest income |
105,346 | 104,376 | 102,982 | 101,089 | 100,503 | |||||||||||||||
| Provision for loan and covered loan losses |
17,038 | 27,701 | 31,611 | 32,615 | 31,093 | |||||||||||||||
|
|
|
|
|
|
|
|
|
|
|
|||||||||||
| Net interest income after provision for loan and covered loan losses |
88,308 | 76,675 | 71,371 | 68,474 | 69,410 | |||||||||||||||
|
|
|
|
|
|
|
|
|
|
|
|||||||||||
| Non-interest Income |
||||||||||||||||||||
| Trust and Investments |
4,312 | 4,219 | 3,992 | 4,452 | 4,720 | |||||||||||||||
| Mortgage banking |
2,915 | 2,663 | 3,032 | 1,565 | 704 | |||||||||||||||
| Capital markets products |
6,033 | 7,349 | 5,471 | 5,510 | 3,871 | |||||||||||||||
| Treasury management |
5,260 | 5,154 | 4,813 | 4,590 | 4,453 | |||||||||||||||
| Loan and credit-related fees |
6,372 | 6,527 | 5,606 | 5,413 | 5,290 | |||||||||||||||
| Deposit service charges and fees and other income |
1,644 | 1,487 | 2,115 | 1,735 | 1,884 | |||||||||||||||
| Net securities (losses) gains |
(290 | ) | 105 | 364 | 4,370 | 670 | ||||||||||||||
|
|
|
|
|
|
|
|
|
|
|
|||||||||||
| Total non-interest income |
26,246 | 27,504 | 25,393 | 27,635 | 21,592 | |||||||||||||||
|
|
|
|
|
|
|
|
|
|
|
|||||||||||
| Non-interest Expense |
||||||||||||||||||||
| Salaries and employee benefits |
42,177 | 42,698 | 40,729 | 38,841 | 38,636 | |||||||||||||||
| Net occupancy expense |
7,653 | 7,679 | 7,394 | 7,515 | 7,545 | |||||||||||||||
| Technology and related costs |
3,273 | 3,296 | 3,142 | 2,856 | 2,729 | |||||||||||||||
| Marketing |
3,058 | 2,160 | 2,250 | 2,218 | 2,500 | |||||||||||||||
| Professional services |
2,247 | 1,957 | 2,126 | 2,434 | 2,312 | |||||||||||||||
| Outsourced servicing costs |
2,093 | 1,710 | 2,077 | 1,918 | 1,852 | |||||||||||||||
| Net foreclosed property expenses |
11,894 | 8,235 | 6,862 | 7,129 | 7,485 | |||||||||||||||
| Postage, telephone, and delivery |
882 | 869 | 953 | 944 | 931 | |||||||||||||||
| Insurance |
4,239 | 4,305 | 3,462 | 5,393 | 5,092 | |||||||||||||||
| Loan and collection expense |
2,918 | 3,157 | 3,840 | 2,931 | 4,247 | |||||||||||||||
| Other expenses |
3,424 | 4,163 | 3,395 | 2,855 | 2,335 | |||||||||||||||
|
|
|
|
|
|
|
|
|
|
|
|||||||||||
| Total non-interest expense |
83,858 | 80,229 | 76,230 | 75,034 | 75,664 | |||||||||||||||
|
|
|
|
|
|
|
|
|
|
|
|||||||||||
| Income before income taxes |
30,696 | 23,950 | 20,534 | 21,075 | 15,338 | |||||||||||||||
| Income tax provision |
13,192 | 9,695 | 9,468 | 7,593 | 6,320 | |||||||||||||||
|
|
|
|
|
|
|
|
|
|
|
|||||||||||
| Net income |
17,504 | 14,255 | 11,066 | 13,482 | 9,018 | |||||||||||||||
| Net income attributable to noncontrolling interests |
— | — | 7 | 33 | 58 | |||||||||||||||
|
|
|
|
|
|
|
|
|
|
|
|||||||||||
| Net income attributable to controlling interests |
17,504 | 14,255 | 11,059 | 13,449 | 8,960 | |||||||||||||||
| Preferred stock dividends and discount accretion |
3,442 | 3,436 | 3,430 | 3,426 | 3,419 | |||||||||||||||
|
|
|
|
|
|
|
|
|
|
|
|||||||||||
| Net income available to common stockholders |
$ | 14,062 | $ | 10,819 | $ | 7,629 | $ | 10,023 | $ | 5,541 | ||||||||||
|
|
|
|
|
|
|
|
|
|
|
|||||||||||
| Per Common Share Data |
||||||||||||||||||||
| Basic earnings per share |
$ | 0.19 | $ | 0.15 | $ | 0.11 | $ | 0.14 | $ | 0.08 | ||||||||||
| Diluted earnings per share |
$ | 0.19 | $ | 0.15 | $ | 0.11 | $ | 0.14 | $ | 0.08 | ||||||||||
| Cash dividends declared |
$ | 0.01 | $ | 0.01 | $ | 0.01 | $ | 0.01 | $ | 0.01 | ||||||||||
| Weighted-average common shares outstanding |
70,956 | 70,780 | 70,540 | 70,479 | 70,428 | |||||||||||||||
| Weighted-average diluted common shares outstanding |
71,147 | 70,932 | 70,713 | 70,621 | 70,663 | |||||||||||||||
| Note 1: | Certain reclassifications have been made to prior period financial statements to place them on a basis comparable with the current period financial statements. |
| Consolidated Balance Sheets
(Dollars in thousands) |

|
| 06/30/12 | 03/31/12 | 12/31/11 | 09/30/11 | 06/30/11 | ||||||||||||||||
| unaudited | unaudited | audited | unaudited | unaudited | ||||||||||||||||
| Assets |
||||||||||||||||||||
| Cash and due from banks |
$ | 141,563 | $ | 166,062 | $ | 156,131 | $ | 171,268 | $ | 160,289 | ||||||||||
| Fed funds sold and other short-term investments |
315,378 | 193,571 | 205,610 | 248,559 | 457,422 | |||||||||||||||
| Loans held for sale |
35,342 | 29,185 | 32,049 | 24,126 | 13,503 | |||||||||||||||
| Securities available-for-sale, at fair value |
1,625,649 | 1,705,649 | 1,783,465 | 1,872,587 | 2,057,290 | |||||||||||||||
| Securities held-to-maturity, at amortized cost |
693,277 | 598,066 | 490,143 | 273,200 | — | |||||||||||||||
| Non-marketable equity investments |
47,702 | 43,882 | 43,604 | 43,894 | 20,406 | |||||||||||||||
| Loans - excluding covered assets, net of unearned fees |
9,436,235 | 9,222,253 | 9,008,561 | 8,674,955 | 8,672,642 | |||||||||||||||
| Allowance for loan losses |
(174,302 | ) | (183,844 | ) | (191,594 | ) | (200,041 | ) | (206,286 | ) | ||||||||||
|
|
|
|
|
|
|
|
|
|
|
|||||||||||
| Loans, net of allowance for loan losses and unearned fees |
9,261,933 | 9,038,409 | 8,816,967 | 8,474,914 | 8,466,356 | |||||||||||||||
|
|
|
|
|
|
|
|
|
|
|
|||||||||||
| Covered assets |
244,782 | 276,534 | 306,807 | 318,973 | 346,452 | |||||||||||||||
| Allowance for covered loan losses |
(21,733 | ) | (26,323 | ) | (25,939 | ) | (16,689 | ) | (16,904 | ) | ||||||||||
|
|
|
|
|
|
|
|
|
|
|
|||||||||||
| Covered assets, net of allowance for covered loan losses |
223,049 | 250,211 | 280,868 | 302,284 | 329,548 | |||||||||||||||
|
|
|
|
|
|
|
|
|
|
|
|||||||||||
| Other real estate owned, excluding covered assets |
109,836 | 123,498 | 125,729 | 116,364 | 123,997 | |||||||||||||||
| Premises, furniture, and equipment, net |
38,177 | 37,462 | 38,633 | 39,069 | 38,171 | |||||||||||||||
| Accrued interest receivable |
37,089 | 36,033 | 35,732 | 32,686 | 32,128 | |||||||||||||||
| Investment in bank owned life insurance |
51,751 | 51,356 | 50,966 | 50,565 | 50,183 | |||||||||||||||
| Goodwill |
94,546 | 94,559 | 94,571 | 94,584 | 94,596 | |||||||||||||||
| Other intangible assets |
14,152 | 14,683 | 15,353 | 15,715 | 16,089 | |||||||||||||||
| Capital markets derivative assets |
102,613 | 97,805 | 101,676 | 111,248 | 93,453 | |||||||||||||||
| Other assets |
150,119 | 142,733 | 145,373 | 148,798 | 161,946 | |||||||||||||||
|
|
|
|
|
|
|
|
|
|
|
|||||||||||
| Total assets |
$ | 12,942,176 | $ | 12,623,164 | $ | 12,416,870 | $ | 12,019,861 | $ | 12,115,377 | ||||||||||
|
|
|
|
|
|
|
|
|
|
|
|||||||||||
| Liabilities |
||||||||||||||||||||
| Demand deposits: |
||||||||||||||||||||
| Noninterest-bearing |
$ | 2,920,182 | $ | 3,054,536 | $ | 3,244,307 | $ | 2,832,481 | $ | 2,527,230 | ||||||||||
| Interest-bearing |
785,879 | 714,522 | 595,238 | 611,293 | 531,107 | |||||||||||||||
| Savings deposits and money market accounts |
4,146,022 | 4,347,832 | 4,378,220 | 4,392,697 | 4,497,297 | |||||||||||||||
| Brokered deposits |
1,484,435 | 961,481 | 815,951 | 902,002 | 1,342,422 | |||||||||||||||
| Time deposits |
1,398,012 | 1,344,341 | 1,359,138 | 1,370,190 | 1,336,212 | |||||||||||||||
|
|
|
|
|
|
|
|
|
|
|
|||||||||||
| Total deposits |
10,734,530 | 10,422,712 | 10,392,854 | 10,108,663 | 10,234,268 | |||||||||||||||
| Short-term borrowings |
335,000 | 355,000 | 156,000 | 59,154 | 63,311 | |||||||||||||||
| Long-term debt |
374,793 | 379,793 | 379,793 | 379,793 | 409,793 | |||||||||||||||
| Accrued interest payable |
5,855 | 5,425 | 5,567 | 5,841 | 5,767 | |||||||||||||||
| Capital markets derivative liabilities |
105,773 | 100,109 | 104,140 | 113,968 | 95,043 | |||||||||||||||
| Other liabilities |
52,071 | 47,971 | 81,764 | 66,266 | 46,547 | |||||||||||||||
|
|
|
|
|
|
|
|
|
|
|
|||||||||||
| Total liabilities |
11,608,022 | 11,311,010 | 11,120,118 | 10,733,685 | 10,854,729 | |||||||||||||||
|
|
|
|
|
|
|
|
|
|
|
|||||||||||
| Equity |
||||||||||||||||||||
| Preferred stock - Series B |
241,185 | 240,791 | 240,403 | 240,020 | 239,642 | |||||||||||||||
| Common stock |
71,843 | 71,611 | 71,483 | 71,220 | 71,155 | |||||||||||||||
| Treasury stock |
(22,639 | ) | (21,749 | ) | (21,454 | ) | (20,680 | ) | (20,615 | ) | ||||||||||
| Additional paid-in capital |
978,510 | 973,417 | 968,787 | 965,640 | 963,156 | |||||||||||||||
| Retained earnings/(accumulated deficit) |
14,268 | 932 | (9,164 | ) | (16,075 | ) | (25,388 | ) | ||||||||||||
| Accumulated other comprehensive income, net of tax |
50,987 | 47,152 | 46,697 | 46,051 | 32,535 | |||||||||||||||
|
|
|
|
|
|
|
|
|
|
|
|||||||||||
| Total stockholders’ equity |
1,334,154 | 1,312,154 | 1,296,752 | 1,286,176 | 1,260,485 | |||||||||||||||
|
|
|
|
|
|
|
|
|
|
|
|||||||||||
| Noncontrolling interests |
— | — | — | — | 163 | |||||||||||||||
|
|
|
|
|
|
|
|
|
|
|
|||||||||||
| Total equity |
1,334,154 | 1,312,154 | 1,296,752 | 1,286,176 | 1,260,648 | |||||||||||||||
|
|
|
|
|
|
|
|
|
|
|
|||||||||||
| Total liabilities and equity |
$ | 12,942,176 | $ | 12,623,164 | $ | 12,416,870 | $ | 12,019,861 | $ | 12,115,377 | ||||||||||
|
|
|
|
|
|
|
|
|
|
|
|||||||||||
Selected Financial Data
| Unaudited
(Amounts in thousands except per share data) |

|
| 2Q12 | 1Q12 | 4Q11 | 3Q11 | 2Q11 | ||||||||||||||||
| Selected Statement of Income Data: |
||||||||||||||||||||
| Net interest income |
$ | 105,346 | $ | 104,376 | $ | 102,982 | $ | 101,089 | $ | 100,503 | ||||||||||
| Net revenue (1) (2) |
$ | 132,291 | $ | 132,560 | $ | 129,046 | $ | 129,404 | $ | 122,811 | ||||||||||
| Operating profit (1) (2) |
$ | 48,433 | $ | 52,331 | $ | 52,816 | $ | 54,370 | $ | 47,147 | ||||||||||
| Provision for loan and covered loan losses |
$ | 17,038 | $ | 27,701 | $ | 31,611 | $ | 32,615 | $ | 31,093 | ||||||||||
| Income before taxes |
$ | 30,696 | $ | 23,950 | $ | 20,534 | $ | 21,075 | $ | 15,338 | ||||||||||
| Net income available to common stockholders |
$ | 14,062 | $ | 10,819 | $ | 7,629 | $ | 10,023 | $ | 5,541 | ||||||||||
| Per Common Share Data: |
||||||||||||||||||||
| Basic earnings per share |
$ | 0.19 | $ | 0.15 | $ | 0.11 | $ | 0.14 | $ | 0.08 | ||||||||||
| Diluted earnings per share |
$ | 0.19 | $ | 0.15 | $ | 0.11 | $ | 0.14 | $ | 0.08 | ||||||||||
| Dividends declared |
$ | 0.01 | $ | 0.01 | $ | 0.01 | $ | 0.01 | $ | 0.01 | ||||||||||
| Book value (period end) (1) |
$ | 15.09 | $ | 14.79 | $ | 14.72 | $ | 14.57 | $ | 14.22 | ||||||||||
| Tangible book value (period end) (1) (2) |
$ | 13.59 | $ | 13.29 | $ | 13.19 | $ | 13.04 | $ | 12.68 | ||||||||||
| Market value (close) |
$ | 14.76 | $ | 15.17 | $ | 10.98 | $ | 7.52 | $ | 13.80 | ||||||||||
| Book value multiple |
0.98 | x | 1.03 | x | 0.75 | x | 0.52 | x | 0.97 | x | ||||||||||
| Share Data: |
||||||||||||||||||||
| Weighted-average common shares outstanding |
70,956 | 70,780 | 70,540 | 70,479 | 70,428 | |||||||||||||||
| Diluted-average common shares outstanding |
71,147 | 70,932 | 70,713 | 70,621 | 70,663 | |||||||||||||||
| Common shares issued (at period end) |
73,273 | 73,205 | 72,514 | 72,491 | 72,497 | |||||||||||||||
| Common shares outstanding (at period end) |
72,424 | 72,415 | 71,745 | 71,789 | 71,808 | |||||||||||||||
| Performance Ratios: |
||||||||||||||||||||
| Return on average assets |
0.55 | % | 0.46 | % | 0.36 | % | 0.44 | % | 0.29 | % | ||||||||||
| Return on average common equity |
5.18 | % | 4.04 | % | 2.86 | % | 3.80 | % | 2.18 | % | ||||||||||
| Net interest margin (1) (2) |
3.46 | % | 3.53 | % | 3.48 | % | 3.49 | % | 3.36 | % | ||||||||||
| Fee revenue as a percent of total revenue (1) |
20.12 | % | 20.79 | % | 19.55 | % | 18.71 | % | 17.23 | % | ||||||||||
| Non-interest income to average assets |
0.83 | % | 0.89 | % | 0.82 | % | 0.91 | % | 0.69 | % | ||||||||||
| Non-interest expense to average assets |
2.64 | % | 2.59 | % | 2.45 | % | 2.46 | % | 2.43 | % | ||||||||||
| Net overhead ratio (1) |
1.81 | % | 1.70 | % | 1.64 | % | 1.56 | % | 1.74 | % | ||||||||||
| Efficiency ratio (1) (2) |
63.39 | % | 60.52 | % | 59.07 | % | 57.98 | % | 61.61 | % | ||||||||||
| Selected Information: |
||||||||||||||||||||
| Assets under management and administration (AUMA) (1) |
$ | 4,738,973 | $ | 4,879,947 | $ | 4,303,547 | $ | 4,161,614 | $ | 4,395,516 | ||||||||||
| Custody assets included in AUMA |
$ | 2,073,777 | $ | 2,060,455 | $ | 1,599,528 | $ | 1,525,001 | $ | 1,623,190 | ||||||||||
| Credit valuation adjustment on capital markets derivatives (1) |
$ | (830 | ) | $ | 19 | $ | 244 | $ | (1,207 | ) | $ | (573 | ) | |||||||
| Balance Sheet Ratios: |
||||||||||||||||||||
| Loans to deposits (period end) (3) |
87.91 | % | 88.48 | % | 86.68 | % | 85.82 | % | 84.74 | % | ||||||||||
| Average interest-earning assets to average interest-bearing liabilities |
146.44 | % | 149.68 | % | 150.70 | % | 145.30 | % | 139.77 | % | ||||||||||
| Capital Ratios (period end): |
||||||||||||||||||||
| Total risk-based capital (1) |
14.12 | % | 14.20 | % | 14.28 | % | 14.82 | % | 15.12 | % | ||||||||||
| Tier 1 risk-based capital (1) |
12.25 | % | 12.31 | % | 12.38 | % | 12.89 | % | 12.95 | % | ||||||||||
| Leverage (1) |
11.20 | % | 11.35 | % | 11.33 | % | 11.48 | % | 11.00 | % | ||||||||||
| Tier 1 common capital (1) (2) |
8.05 | % | 8.04 | % | 8.04 | % | 8.34 | % | 8.34 | % | ||||||||||
| Tangible common equity to tangible assets (1) (2) |
7.67 | % | 7.69 | % | 7.69 | % | 7.86 | % | 7.58 | % | ||||||||||
| Total equity to total assets |
10.31 | % | 10.39 | % | 10.44 | % | 10.70 | % | 10.41 | % | ||||||||||
| (1) | Refer to Glossary of Terms for definition. |
| (2) | This is a non-U.S. GAAP financial measure, refer to Non-U.S. GAAP Financial Measures for a reconciliation from non-U.S. GAAP to U.S. GAAP. |
| (3) | Excludes covered assets. Refer to Glossary of Terms for definition. |
| Loan Composition (excluding covered assets(1)) (Dollars in thousands) |

|
| % of | % of | % of | % of | % of | ||||||||||||||||||||||||||||||||||||
| 06/30/12 | Total | 03/31/12 | Total | 12/31/11 | Total | 09/30/11 | Total | 06/30/11 | Total | |||||||||||||||||||||||||||||||
| unaudited | unaudited | audited | unaudited | unaudited | ||||||||||||||||||||||||||||||||||||
| Commercial and industrial |
$ | 4,523,780 | 48 | % | $ | 4,325,558 | 47 | % | $ | 4,192,842 | 46 | % | $ | 3,959,153 | 45 | % | $ | 3,886,555 | 46 | % | ||||||||||||||||||||
| Commercial - owner-occupied CRE |
1,384,831 | 15 | % | 1,175,729 | 13 | % | 1,130,932 | 13 | % | 1,070,340 | 12 | % | 986,602 | 11 | % | |||||||||||||||||||||||||
|
|
|
|
|
|
|
|
|
|
|
|
|
|
|
|
|
|
|
|
|
|||||||||||||||||||||
| Total commercial |
5,908,611 | 63 | % | 5,501,287 | 60 | % | 5,323,774 | 59 | % | 5,029,493 | 57 | % | 4,873,157 | 57 | % | |||||||||||||||||||||||||
|
|
|
|
|
|
|
|
|
|
|
|
|
|
|
|
|
|
|
|
|
|||||||||||||||||||||
| Commercial real estate |
2,124,492 | 23 | % | 2,378,640 | 26 | % | 2,233,851 | 25 | % | 2,156,621 | 25 | % | 2,280,961 | 26 | % | |||||||||||||||||||||||||
| Commercial real estate - multi-family |
499,250 | 5 | % | 493,218 | 5 | % | 452,595 | 5 | % | 445,908 | 5 | % | 416,459 | 5 | % | |||||||||||||||||||||||||
|
|
|
|
|
|
|
|
|
|
|
|
|
|
|
|
|
|
|
|
|
|||||||||||||||||||||
| Total commercial real estate |
2,623,742 | 28 | % | 2,871,858 | 31 | % | 2,686,446 | 30 | % | 2,602,529 | 30 | % | 2,697,420 | 31 | % | |||||||||||||||||||||||||
|
|
|
|
|
|
|
|
|
|
|
|
|
|
|
|
|
|
|
|
|
|||||||||||||||||||||
| Construction |
171,014 | 2 | % | 127,837 | 1 | % | 287,002 | 3 | % | 315,858 | 4 | % | 366,061 | 4 | % | |||||||||||||||||||||||||
| Residential real estate |
330,254 | 3 | % | 308,880 | 3 | % | 297,229 | 3 | % | 307,705 | 4 | % | 301,250 | 3 | % | |||||||||||||||||||||||||
| Home equity |
174,131 | 2 | % | 175,972 | 2 | % | 181,158 | 2 | % | 186,914 | 2 | % | 190,691 | 2 | % | |||||||||||||||||||||||||
| Personal |
228,483 | 2 | % | 236,419 | 3 | % | 232,952 | 3 | % | 232,456 | 3 | % | 244,063 | 3 | % | |||||||||||||||||||||||||
|
|
|
|
|
|
|
|
|
|
|
|
|
|
|
|
|
|
|
|
|
|||||||||||||||||||||
| Total loans |
$ | 9,436,235 | 100 | % | $ | 9,222,253 | 100 | % | $ | 9,008,561 | 100 | % | $ | 8,674,955 | 100 | % | $ | 8,672,642 | 100 | % | ||||||||||||||||||||
|
|
|
|
|
|
|
|
|
|
|
|
|
|
|
|
|
|
|
|
|
|||||||||||||||||||||
| (1) | Refer to Glossary of Terms for definition. |
| Loan Composition (excluding covered assets(1)) (Dollars in thousands) Unaudited |

|
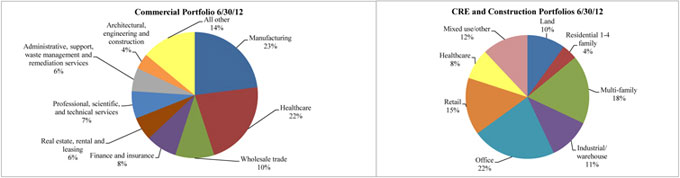
Commercial Loans Composition by Industry Segment
(Classified pursuant to the North American Industrial Classification System standard industry descriptions and represents our client's primary business activity)
| 06/30/12 | 03/31/12 | 12/31/11 | ||||||||||||||||||||||
| % of | % of | % of | ||||||||||||||||||||||
| Amount | Total | Amount | Total | Amount | Total | |||||||||||||||||||
| Manufacturing |
$ | 1,347,763 | 23 | % | $ | 1,301,681 | 24 | % | $ | 1,257,973 | 24 | % | ||||||||||||
| Healthcare |
1,290,219 | 22 | % | 1,343,017 | 24 | % | 1,218,205 | 23 | % | |||||||||||||||
| Wholesale trade |
588,666 | 10 | % | 506,840 | 9 | % | 482,386 | 9 | % | |||||||||||||||
| Finance and insurance |
492,367 | 8 | % | 493,103 | 9 | % | 454,830 | 8 | % | |||||||||||||||
| Real estate, rental and leasing |
333,393 | 6 | % | 269,647 | 5 | % | 342,860 | 6 | % | |||||||||||||||
| Professional, scientific and technical services |
410,156 | 7 | % | 348,907 | 6 | % | 350,677 | 7 | % | |||||||||||||||
| Administrative, support, waste management and remediation services |
351,447 | 6 | % | 328,370 | 6 | % | 321,912 | 6 | % | |||||||||||||||
| Architectural, engineering and construction |
257,529 | 4 | % | 209,998 | 4 | % | 195,875 | 4 | % | |||||||||||||||
| All other (2) |
837,071 | 14 | % | 699,724 | 13 | % | 699,056 | 13 | % | |||||||||||||||
|
|
|
|
|
|
|
|
|
|
|
|
|
|||||||||||||
| Total commercial (3) |
$ | 5,908,611 | 100 | % | $ | 5,501,287 | 100 | % | $ | 5,323,774 | 100 | % | ||||||||||||
|
|
|
|
|
|
|
|
|
|
|
|
|
|||||||||||||
Commercial Real Estate and Construction Loans Portfolio by Collateral Type
| 06/30/12 | 03/31/12 | 12/31/11 | ||||||||||||||||||||||||||||||||||||||
| Amount | Amount | |||||||||||||||||||||||||||||||||||||||
| % of | Non- | % Non- | % of | Non- | % Non- | % of | ||||||||||||||||||||||||||||||||||
| Amount | Total | performing | performing (4) | Amount | Total | performing | performing (4) | Amount | Total | |||||||||||||||||||||||||||||||
| Commercial Real Estate Portfolio |
||||||||||||||||||||||||||||||||||||||||
| Land |
$ | 225,810 | 9 | % | $ | 24,792 | 11 | % | $ | 238,326 | 8 | % | $ | 30,016 | 13 | % | $ | 230,579 | 9 | % | ||||||||||||||||||||
| Residential 1-4 family |
90,554 | 3 | % | 12,139 | 13 | % | 119,772 | 4 | % | 16,709 | 14 | % | 105,919 | 4 | % | |||||||||||||||||||||||||
| Multi-family |
499,250 | 19 | % | 8,752 | 2 | % | 493,218 | 17 | % | 5,983 | 1 | % | 452,595 | 17 | % | |||||||||||||||||||||||||
| Industrial/warehouse |
310,203 | 12 | % | 6,886 | 2 | % | 370,200 | 13 | % | 7,596 | 2 | % | 350,282 | 13 | % | |||||||||||||||||||||||||
| Office |
568,435 | 22 | % | 20,560 | 4 | % | 617,871 | 22 | % | 20,157 | 3 | % | 585,183 | 22 | % | |||||||||||||||||||||||||
| Retail |
401,888 | 15 | % | 37,730 | 9 | % | 489,960 | 17 | % | 60,006 | 12 | % | 431,200 | 16 | % | |||||||||||||||||||||||||
| Healthcare |
209,934 | 8 | % | — | — | 144,239 | 5 | % | — | — | 144,529 | 5 | % | |||||||||||||||||||||||||||
| Mixed use/other |
317,668 | 12 | % | 8,585 | 3 | % | 398,272 | 14 | % | 18,788 | 5 | % | 386,159 | 14 | % | |||||||||||||||||||||||||
|
|
|
|
|
|
|
|
|
|
|
|
|
|
|
|
|
|
|
|
|
|||||||||||||||||||||
| Total commercial real estate |
$ | 2,623,742 | 100 | % | $ | 119,444 | 5 | % | $ | 2,871,858 | 100 | % | $ | 159,255 | 6 | % | $ | 2,686,446 | 100 | % | ||||||||||||||||||||
|
|
|
|
|
|
|
|
|
|
|
|
|
|
|
|
|
|
|
|
|
|||||||||||||||||||||
| Construction Portfolio |
||||||||||||||||||||||||||||||||||||||||
| Land |
$ | 53,050 | 31 | % | $ | — | — | $ | 39,735 | 31 | % | $ | 369 | 1 | % | $ | 23,422 | 8 | % | |||||||||||||||||||||
| Residential 1-4 family |
14,785 | 9 | % | — | — | 19,033 | 15 | % | 1,223 | 6 | % | 21,906 | 8 | % | ||||||||||||||||||||||||||
| Multi-family |
11,950 | 7 | % | — | — | 10,793 | 8 | % | — | — | 64,892 | 23 | % | |||||||||||||||||||||||||||
| Industrial/warehouse |
4,870 | 3 | % | — | — | 2,861 | 2 | % | — | — | 15,216 | 5 | % | |||||||||||||||||||||||||||
| Office |
39,303 | 23 | % | 401 | 1 | % | 27,757 | 22 | % | 336 | 1 | % | 43,403 | 15 | % | |||||||||||||||||||||||||
| Retail |
11,736 | 7 | % | — | — | 4,687 | 4 | % | — | — | 61,469 | 21 | % | |||||||||||||||||||||||||||
| Mixed use/other |
35,320 | 20 | % | 154 | * | 22,971 | 18 | % | 852 | 4 | % | 56,694 | 20 | % | ||||||||||||||||||||||||||
|
|
|
|
|
|
|
|
|
|
|
|
|
|
|
|
|
|
|
|
|
|||||||||||||||||||||
| Total construction |
$ | 171,014 | 100 | % | $ | 555 | * | $ | 127,837 | 100 | % | $ | 2,780 | 2 | % | $ | 287,002 | 100 | % | |||||||||||||||||||||
|
|
|
|
|
|
|
|
|
|
|
|
|
|
|
|
|
|
|
|
|
|||||||||||||||||||||
| (1) | Refer to Glossary of Terms for definition. |
| (2) | All other consists of numerous smaller balances across a variety of industries. |
| (3) | Includes owner-occupied commercial real estate of $1.4 billion, $1.2 billion and $1.1 billion at June 30, 2012, March 31, 2012 and December 31, 2011, respectively. |
| (4) | Calculated as nonperforming loans in the respective collateral type divided by total loans of the corresponding collateral type presented above. |
| * | Less than 1%. |
Asset Quality (excluding covered assets(1))
| Unaudited |
| |
| (Dollars in thousands) |
| 2Q12 | 1Q12 | 4Q11 | 3Q11 | 2Q11 | ||||||||||||||||
| Credit Quality Key Ratios |
||||||||||||||||||||
| Net charge-offs (annualized) to average loans |
1.16 | % | 1.57 | % | 1.72 | % | 1.76 | % | 1.95 | % | ||||||||||
| Nonperforming loans to total loans |
2.22 | % | 2.53 | % | 2.88 | % | 3.51 | % | 3.81 | % | ||||||||||
| Nonperforming loans to total assets |
1.62 | % | 1.85 | % | 2.09 | % | 2.54 | % | 2.73 | % | ||||||||||
| Nonperforming assets to total assets |
2.47 | % | 2.83 | % | 3.11 | % | 3.50 | % | 3.75 | % | ||||||||||
| Allowance for loan losses to: |
||||||||||||||||||||
| Total loans |
1.85 | % | 1.99 | % | 2.13 | % | 2.31 | % | 2.38 | % | ||||||||||
| Nonperforming loans |
83 | % | 79 | % | 74 | % | 66 | % | 62 | % | ||||||||||
| Nonperforming assets |
||||||||||||||||||||
| Loans past due 90 days and accruing |
$ | — | $ | — | $ | — | $ | — | $ | — | ||||||||||
| Nonaccrual loans |
209,339 | 233,222 | 259,852 | 304,747 | 330,448 | |||||||||||||||
| OREO |
109,836 | 123,498 | 125,729 | 116,364 | 123,997 | |||||||||||||||
|
|
|
|
|
|
|
|
|
|
|
|||||||||||
| Total nonperforming assets |
$ | 319,175 | $ | 356,720 | $ | 385,581 | $ | 421,111 | $ | 454,445 | ||||||||||
|
|
|
|
|
|
|
|
|
|
|
|||||||||||
| Restructured loans accruing interest |
$ | 97,690 | $ | 136,521 | $ | 100,909 | $ | 106,330 | $ | 124,614 | ||||||||||
| Special mention loans |
$ | 108,052 | $ | 143,790 | $ | 204,965 | $ | 218,561 | $ | 227,413 | ||||||||||
| Potential problem loans |
$ | 164,077 | $ | 184,029 | $ | 177,095 | $ | 277,125 | $ | 392,019 | ||||||||||
| Nonperforming Loans Rollforward |
||||||||||||||||||||
| Beginning balance |
$ | 233,222 | $ | 259,852 | $ | 304,747 | $ | 330,448 | $ | 356,932 | ||||||||||
| Additions: |
||||||||||||||||||||
| New nonaccrual loans |
57,717 | 69,581 | 67,512 | 68,298 | 110,438 | |||||||||||||||
| Reductions: |
||||||||||||||||||||
| Return to performing status |
(1,953 | ) | (14,291 | ) | (2,072 | ) | (1,608 | ) | (2,781 | ) | ||||||||||
| Paydowns and payoffs, net of advances |
(9,961 | ) | (4,806 | ) | (8,950 | ) | (13,166 | ) | (8,258 | ) | ||||||||||
| Net sales |
(25,954 | ) | (27,479 | ) | (27,178 | ) | (20,432 | ) | (38,129 | ) | ||||||||||
| Transfer to OREO |
(9,968 | ) | (13,513 | ) | (33,695 | ) | (24,373 | ) | (49,667 | ) | ||||||||||
| Charge-offs, net |
(33,764 | ) | (36,122 | ) | (40,512 | ) | (34,420 | ) | (38,087 | ) | ||||||||||
|
|
|
|
|
|
|
|
|
|
|
|||||||||||
| Total reductions |
(81,600 | ) | (96,211 | ) | (112,407 | ) | (93,999 | ) | (136,922 | ) | ||||||||||
|
|
|
|
|
|
|
|
|
|
|
|||||||||||
| Balance at end of period |
$ | 209,339 | $ | 233,222 | $ | 259,852 | $ | 304,747 | $ | 330,448 | ||||||||||
|
|
|
|
|
|
|
|
|
|
|
|||||||||||
| OREO Rollforward |
||||||||||||||||||||
| Beginning balance |
$ | 123,498 | $ | 125,729 | $ | 116,364 | $ | 123,997 | $ | 93,770 | ||||||||||
| New foreclosed properties |
9,968 | 13,513 | 33,695 | 24,373 | 49,667 | |||||||||||||||
| Valuation adjustments |
(9,207 | ) | (4,522 | ) | (3,999 | ) | (1,175 | ) | (5,483 | ) | ||||||||||
| Disposals: |
||||||||||||||||||||
| Sales proceeds |
(13,517 | ) | (9,078 | ) | (18,085 | ) | (25,921 | ) | (13,615 | ) | ||||||||||
| Net loss on sale |
(906 | ) | (2,144 | ) | (2,246 | ) | (4,910 | ) | (342 | ) | ||||||||||
|
|
|
|
|
|
|
|
|
|
|
|||||||||||
| Balance at end of period |
$ | 109,836 | $ | 123,498 | $ | 125,729 | $ | 116,364 | $ | 123,997 | ||||||||||
|
|
|
|
|
|
|
|
|
|
|
|||||||||||
| Restructured Loans Accruing Interest Rollforward |
||||||||||||||||||||
| Beginning balance |
$ | 136,521 | $ | 100,909 | $ | 106,330 | $ | 124,614 | $ | 100,895 | ||||||||||
| Additions: |
||||||||||||||||||||
| New restructured loans accruing interest |
1,864 | 47,673 | 8,803 | 8,592 | 54,663 | |||||||||||||||
| Return to performing status |
157 | — | 1,099 | 1,029 | — | |||||||||||||||
| Reductions: |
||||||||||||||||||||
| Paydowns and payoffs, net of advances |
(14,593 | ) | (4,661 | ) | (3,334 | ) | (20,545 | ) | (7,915 | ) | ||||||||||
| Move to nonperforming loans |
(25,688 | ) | (6,665 | ) | (5,735 | ) | (4,716 | ) | (9,930 | ) | ||||||||||
| Net sales |
(170 | ) | — | — | (2,260 | ) | (9,600 | ) | ||||||||||||
| Removal of restructured loan status |
(401 | ) | (735 | ) | (6,254 | ) | (340 | ) | — | |||||||||||
| Charge-offs, net |
— | — | — | (44 | ) | (3,499 | ) | |||||||||||||
|
|
|
|
|
|
|
|
|
|
|
|||||||||||
| Balance at end of period |
$ | 97,690 | $ | 136,521 | $ | 100,909 | $ | 106,330 | $ | 124,614 | ||||||||||
|
|
|
|
|
|
|
|
|
|
|
|||||||||||
| (1) | Refer to Glossary of Terms for definition. |
| Asset Quality (excluding covered assets(1)) Unaudited (Dollars in thousands) |
| |
Credit Quality Indicators (1)
| Special | Potential | Non- | ||||||||||||||||||||||||||
| Mention | % of | Problem | % of | Performing | % of | Total | ||||||||||||||||||||||
| Loans | Loan Type | Loans | Loan Type | Loans | Loan Type | Loans | ||||||||||||||||||||||
| As of June 30, 2012 |
||||||||||||||||||||||||||||
| Transformational (1) |
||||||||||||||||||||||||||||
| Commercial |
$ | 50,348 | 0.9 | % | $ | 54,982 | 1.0 | % | $ | 45,464 | 0.8 | % | $ | 5,413,098 | ||||||||||||||
| Commercial real estate |
16,724 | 1.0 | % | 21,921 | 1.3 | % | 68,843 | 4.0 | % | 1,721,408 | ||||||||||||||||||
| Construction |
5,844 | 3.5 | % | — | — | — | — | 164,639 | ||||||||||||||||||||
| Residential real estate |
351 | 0.2 | % | 4,653 | 3.1 | % | 1,250 | 0.8 | % | 149,150 | ||||||||||||||||||
| Home equity |
— | — | 1,656 | 2.6 | % | 423 | 0.7 | % | 64,266 | |||||||||||||||||||
| Personal |
— | — | 51 | * | 1,010 | 0.6 | % | 158,378 | ||||||||||||||||||||
|
|
|
|
|
|
|
|
|
|
|
|
|
|
|
|||||||||||||||
| Total transformational |
$ | 73,267 | 1.0 | % | $ | 83,263 | 1.1 | % | $ | 116,990 | 1.5 | % | $ | 7,670,939 | ||||||||||||||
| Legacy (1) |
||||||||||||||||||||||||||||
| Commercial |
$ | 5,630 | 1.1 | % | $ | 7,940 | 1.6 | % | $ | 14,377 | 2.9 | % | $ | 495,513 | ||||||||||||||
| Commercial real estate |
26,254 | 2.9 | % | 52,943 | 5.9 | % | 50,601 | 5.6 | % | 902,334 | ||||||||||||||||||
| Construction |
— | — | — | — | 555 | 8.7 | % | 6,375 | ||||||||||||||||||||
| Residential real estate |
2,378 | 1.3 | % | 14,959 | 8.3 | % | 9,778 | 5.4 | % | 181,104 | ||||||||||||||||||
| Home equity |
516 | 0.5 | % | 4,200 | 3.8 | % | 11,640 | 10.6 | % | 109,865 | ||||||||||||||||||
| Personal |
7 | * | 772 | 1.1 | % | 5,398 | 7.7 | % | 70,105 | |||||||||||||||||||
|
|
|
|
|
|
|
|
|
|
|
|
|
|
|
|||||||||||||||
| Total legacy |
34,785 | 2.0 | % | 80,814 | 4.6 | % | 92,349 | 5.2 | % | 1,765,296 | ||||||||||||||||||
|
|
|
|
|
|
|
|
|
|
|
|
|
|
|
|||||||||||||||
| Total |
$ | 108,052 | 1.1 | % | $ | 164,077 | 1.7 | % | $ | 209,339 | 2.2 | % | $ | 9,436,235 | ||||||||||||||
|
|
|
|
|
|
|
|
|
|
|
|
|
|
|
|||||||||||||||
| As of March 31, 2012 |
||||||||||||||||||||||||||||
| Transformational (1) |
||||||||||||||||||||||||||||
| Commercial |
$ | 61,382 | 1.2 | % | $ | 49,229 | 1.0 | % | $ | 22,765 | 0.4 | % | $ | 5,065,103 | ||||||||||||||
| Commercial real estate |
26,466 | 1.5 | % | 33,251 | 1.9 | % | 87,228 | 4.9 | % | 1,782,434 | ||||||||||||||||||
| Construction |
7,272 | 6.1 | % | — | — | — | — | 118,394 | ||||||||||||||||||||
| Residential real estate |
4,309 | 2.9 | % | 5,983 | 4.0 | % | 1,057 | 0.7 | % | 149,639 | ||||||||||||||||||
| Home equity |
— | — | 1,659 | 2.8 | % | 424 | 0.7 | % | 59,946 | |||||||||||||||||||
| Personal |
— | — | 765 | 0.5 | % | 311 | 0.2 | % | 149,951 | |||||||||||||||||||
|
|
|
|
|
|
|
|
|
|
|
|
|
|
|
|||||||||||||||
| Total transformational |
$ | 99,429 | 1.4 | % | $ | 90,887 | 1.2 | % | $ | 111,785 | 1.5 | % | $ | 7,325,467 | ||||||||||||||
| Legacy (1) |
||||||||||||||||||||||||||||
| Commercial |
$ | 11,198 | 2.6 | % | $ | 8,557 | 2.0 | % | $ | 17,421 | 4.0 | % | $ | 436,184 | ||||||||||||||
| Commercial real estate |
30,355 | 2.8 | % | 62,880 | 5.8 | % | 72,027 | 6.6 | % | 1,089,424 | ||||||||||||||||||
| Construction |
— | — | — | — | 2,781 | 29.5 | % | 9,443 | ||||||||||||||||||||
| Residential real estate |
2,384 | 1.5 | % | 15,027 | 9.4 | % | 11,012 | 6.9 | % | 159,241 | ||||||||||||||||||
| Home equity |
420 | 0.4 | % | 5,613 | 4.8 | % | 9,954 | 8.6 | % | 116,026 | ||||||||||||||||||
| Personal |
4 | * | 1,065 | 1.2 | % | 8,242 | 9.5 | % | 86,468 | |||||||||||||||||||
|
|
|
|
|
|
|
|
|
|
|
|
|
|
|
|||||||||||||||
| Total legacy |
44,361 | 2.3 | % | 93,142 | 4.9 | % | 121,437 | 6.4 | % | 1,896,786 | ||||||||||||||||||
|
|
|
|
|
|
|
|
|
|
|
|
|
|
|
|||||||||||||||
| Total |
$ | 143,790 | 1.6 | % | $ | 184,029 | 2.0 | % | $ | 233,222 | 2.5 | % | $ | 9,222,253 | ||||||||||||||
|
|
|
|
|
|
|
|
|
|
|
|
|
|
|
|||||||||||||||
|
| (1) | Refer to Glossary of Terms for definition. |
| * | Less than 0.1%. |
Loan Portfolio Aging (excluding covered assets(1))
| Unaudited (Dollars in thousands) |

| |
| Current | 30-59 Days Past Due |
60-89 Days Past Due |
90 Days Past Due and Accruing |
Nonaccrual | Total Loans | |||||||||||||||||||
| As of June 30, 2012 |
||||||||||||||||||||||||
| Loan balances: |
||||||||||||||||||||||||
| Commercial |
$ | 5,842,805 | $ | 901 | $ | 5,064 | $ | — | $ | 59,841 | $ | 5,908,611 | ||||||||||||
| Commercial real estate |
2,500,441 | 1,314 | 2,543 | — | 119,444 | 2,623,742 | ||||||||||||||||||
| Construction |
170,459 | — | — | — | 555 | 171,014 | ||||||||||||||||||
| Residential real estate |
318,864 | 341 | 21 | — | 11,028 | 330,254 | ||||||||||||||||||
| Personal and home equity |
381,143 | 1,983 | 1,017 | — | 18,471 | 402,614 | ||||||||||||||||||
|
|
|
|
|
|
|
|
|
|
|
|
|
|||||||||||||
| Total loans |
$ | 9,213,712 | $ | 4,539 | $ | 8,645 | $ | — | $ | 209,339 | $ | 9,436,235 | ||||||||||||
|
|
|
|
|
|
|
|
|
|
|
|
|
|||||||||||||
| Aging as a percent of loan balance: |
||||||||||||||||||||||||
| Commercial |
98.89 | % | 0.01 | % | 0.09 | % | — | 1.01 | % | 100.00 | % | |||||||||||||
| Commercial real estate |
95.30 | % | 0.05 | % | 0.10 | % | — | 4.55 | % | 100.00 | % | |||||||||||||
| Construction |
99.68 | % | — | — | — | 0.32 | % | 100.00 | % | |||||||||||||||
| Residential real estate |
96.55 | % | 0.10 | % | 0.01 | % | — | 3.34 | % | 100.00 | % | |||||||||||||
| Personal and home equity |
94.67 | % | 0.49 | % | 0.25 | % | — | 4.59 | % | 100.00 | % | |||||||||||||
|
|
|
|
|
|
|
|
|
|
|
|
|
|||||||||||||
| Total loans |
97.64 | % | 0.05 | % | 0.09 | % | — | 2.22 | % | 100.00 | % | |||||||||||||
| 2Q12 | 1Q12 | 4Q11 | 3Q11 | 2Q11 | ||||||||||||||||
| Nonaccrual loans: |
||||||||||||||||||||
| Commercial |
$ | 59,841 | $ | 40,186 | $ | 65,958 | $ | 61,399 | $ | 51,634 | ||||||||||
| Commercial real estate |
119,444 | 159,255 | 133,257 | 168,078 | 192,778 | |||||||||||||||
| Construction |
555 | 2,781 | 21,879 | 29,997 | 37,140 | |||||||||||||||
| Residential real estate |
11,028 | 12,069 | 14,589 | 18,007 | 18,496 | |||||||||||||||
| Personal and home equity |
18,471 | 18,931 | 24,169 | 27,266 | 30,400 | |||||||||||||||
|
|
|
|
|
|
|
|
|
|
|
|||||||||||
| Total |
$ | 209,339 | $ | 233,222 | $ | 259,852 | $ | 304,747 | $ | 330,448 | ||||||||||
|
|
|
|
|
|
|
|
|
|
|
|||||||||||
| Nonaccrual loans as a percent of total loan type: |
||||||||||||||||||||
| Commercial |
1.01 | % | 0.73 | % | 1.24 | % | 1.22 | % | 1.06 | % | ||||||||||
| Commercial real estate |
4.55 | % | 5.55 | % | 4.96 | % | 6.46 | % | 7.15 | % | ||||||||||
| Construction |
0.32 | % | 2.18 | % | 7.62 | % | 9.50 | % | 10.15 | % | ||||||||||
| Residential real estate |
3.34 | % | 3.91 | % | 4.91 | % | 5.85 | % | 6.14 | % | ||||||||||
| Personal and home equity |
4.59 | % | 4.59 | % | 5.84 | % | 6.50 | % | 6.99 | % | ||||||||||
|
|
|
|
|
|
|
|
|
|
|
|||||||||||
| Total |
2.22 | % | 2.53 | % | 2.88 | % | 3.51 | % | 3.81 | % | ||||||||||
| Loans past due 60-89 days and still accruing: |
||||||||||||||||||||
| Commercial |
$ | 5,064 | $ | 3,963 | $ | 923 | $ | 101 | $ | 3,978 | ||||||||||
| Commercial real estate |
2,543 | 2,081 | 9,777 | 8,801 | 10,292 | |||||||||||||||
| Construction |
— | 68 | 2,381 | — | — | |||||||||||||||
| Residential real estate |
21 | 1,135 | 645 | 2,864 | 1,000 | |||||||||||||||
| Personal and home equity |
1,017 | 253 | 809 | 1,016 | 1,288 | |||||||||||||||
|
|
|
|
|
|
|
|
|
|
|
|||||||||||
| Total |
$ | 8,645 | $ | 7,500 | $ | 14,535 | $ | 12,782 | $ | 16,558 | ||||||||||
|
|
|
|
|
|
|
|
|
|
|
|||||||||||
| Loans past due 60-89 days and still accruing as a percent of total loan type: |
||||||||||||||||||||
| Commercial |
0.09 | % | 0.07 | % | 0.02 | % | * | 0.08 | % | |||||||||||
| Commercial real estate |
0.10 | % | 0.07 | % | 0.36 | % | 0.34 | % | 0.39 | % | ||||||||||
| Construction |
— | 0.05 | % | 0.83 | % | — | — | |||||||||||||
| Residential real estate |
0.01 | % | 0.37 | % | 0.22 | % | 0.93 | % | 0.33 | % | ||||||||||
| Personal and home equity |
0.25 | % | 0.06 | % | 0.20 | % | 0.24 | % | 0.30 | % | ||||||||||
|
|
|
|
|
|
|
|
|
|
|
|||||||||||
| Total |
0.09 | % | 0.08 | % | 0.16 | % | 0.15 | % | 0.19 | % | ||||||||||
| Loans past due 30-59 days and still accruing: |
||||||||||||||||||||
| Commercial |
$ | 901 | $ | 3,216 | $ | 6,018 | $ | 3,529 | $ | 1,723 | ||||||||||
| Commercial real estate |
1,314 | 6,590 | 3,523 | 5,884 | 3,384 | |||||||||||||||
| Construction |
— | — | — | 342 | — | |||||||||||||||
| Residential real estate |
341 | 4,960 | 3,800 | 7 | 392 | |||||||||||||||
| Personal and home equity |
1,983 | 1,754 | 446 | 776 | 2,803 | |||||||||||||||
|
|
|
|
|
|
|
|
|
|
|
|||||||||||
| Total |
$ | 4,539 | $ | 16,520 | $ | 13,787 | $ | 10,538 | $ | 8,302 | ||||||||||
|
|
|
|
|
|
|
|
|
|
|
|||||||||||
| Loans past due 30-59 days and still accruing as a percent of total loan type: |
||||||||||||||||||||
| Commercial |
0.01 | % | 0.06 | % | 0.11 | % | 0.07 | % | 0.03 | % | ||||||||||
| Commercial real estate |
0.05 | % | 0.23 | % | 0.13 | % | 0.23 | % | 0.13 | % | ||||||||||
| Construction |
— | — | — | 0.11 | % | — | ||||||||||||||
| Residential real estate |
0.10 | % | 1.61 | % | 1.28 | % | * | 0.13 | % | |||||||||||
| Personal and home equity |
0.49 | % | 0.43 | % | 0.11 | % | 0.19 | % | 0.64 | % | ||||||||||
|
|
|
|
|
|
|
|
|
|
|
|||||||||||
| Total |
0.05 | % | 0.18 | % | 0.15 | % | 0.12 | % | 0.10 | % | ||||||||||
| (1) | Refer to Glossary of Terms for definition. |
| * | Less than 0.01%. |
Asset Quality (excluding covered assets(1))
| Unaudited (Dollars in thousands) |

| |
Nonaccrual Loans Stratification
| $10.0 Million or More |
$5.0 to $9.9 Million |
$3.0 to $4.9 Million |
$1.5 to $2.9 Million |
Under $1.5 Million |
Total | |||||||||||||||||||
| As of June 30, 2012 |
||||||||||||||||||||||||
| Amount: |
||||||||||||||||||||||||
| Commercial |
$ | 31,535 | $ | — | $ | 11,407 | $ | 8,792 | $ | 8,107 | $ | 59,841 | ||||||||||||
| Commercial real estate |
63,709 | 6,409 | 6,984 | 12,220 | 30,122 | 119,444 | ||||||||||||||||||
| Construction |
— | — | — | — | 555 | 555 | ||||||||||||||||||
| Residential real estate |
— | — | 4,789 | — | 6,239 | 11,028 | ||||||||||||||||||
| Personal and home equity |
— | — | 3,848 | — | 14,623 | 18,471 | ||||||||||||||||||
|
|
|
|
|
|
|
|
|
|
|
|
|
|||||||||||||
| Total |
$ | 95,244 | $ | 6,409 | $ | 27,028 | $ | 21,012 | $ | 59,646 | $ | 209,339 | ||||||||||||
|
|
|
|
|
|
|
|
|
|
|
|
|
|||||||||||||
| Number of borrowers: |
||||||||||||||||||||||||
| Commercial |
2 | — | 3 | 4 | 30 | 39 | ||||||||||||||||||
| Commercial real estate |
4 | 1 | 2 | 5 | 48 | 60 | ||||||||||||||||||
| Construction |
— | — | — | — | 2 | 2 | ||||||||||||||||||
| Residential real estate |
— | — | 1 | — | 21 | 22 | ||||||||||||||||||
| Personal and home equity |
— | — | 1 | — | 43 | 44 | ||||||||||||||||||
|
|
|
|
|
|
|
|
|
|
|
|
|
|||||||||||||
| Total |
6 | 1 | 7 | 9 | 144 | 167 | ||||||||||||||||||
|
|
|
|
|
|
|
|
|
|
|
|
|
|||||||||||||
| As of March 31, 2012 |
||||||||||||||||||||||||
| Amount: |
||||||||||||||||||||||||
| Commercial |
$ | — | $ | 14,164 | $ | 7,737 | $ | 5,751 | $ | 12,534 | $ | 40,186 | ||||||||||||
| Commercial real estate |
77,770 | 19,374 | 11,493 | 25,689 | 24,929 | 159,255 | ||||||||||||||||||
| Construction |
— | — | — | — | 2,781 | 2,781 | ||||||||||||||||||
| Residential real estate |
— | — | 4,789 | — | 7,280 | 12,069 | ||||||||||||||||||
| Personal and home equity |
— | 5,827 | — | 1,615 | 11,489 | 18,931 | ||||||||||||||||||
|
|
|
|
|
|
|
|
|
|
|
|
|
|||||||||||||
| Total |
$ | 77,770 | $ | 39,365 | $ | 24,019 | $ | 33,055 | $ | 59,013 | $ | 233,222 | ||||||||||||
|
|
|
|
|
|
|
|
|
|
|
|
|
|||||||||||||
| Number of borrowers: |
||||||||||||||||||||||||
| Commercial |
— | 2 | 2 | 3 | 35 | 42 | ||||||||||||||||||
| Commercial real estate |
5 | 3 | 3 | 12 | 48 | 71 | ||||||||||||||||||
| Construction |
— | — | — | — | 6 | 6 | ||||||||||||||||||
| Residential real estate |
— | — | 1 | — | 20 | 21 | ||||||||||||||||||
| Personal and home equity |
— | 1 | — | 1 | 31 | 33 | ||||||||||||||||||
|
|
|
|
|
|
|
|
|
|
|
|
|
|||||||||||||
| Total |
5 | 6 | 6 | 16 | 140 | 173 | ||||||||||||||||||
|
|
|
|
|
|
|
|
|
|
|
|
|
|||||||||||||
Restructured Loans Accruing Interest Stratification
| $10.0 Million or More |
$5.0 to
$9.9 Million |
$3.0 to $4.9 Million |
$1.5 to $2.9 Million |
Under $1.5 Million |
Total | |||||||||||||||||||
| As of June 30, 2012 |
||||||||||||||||||||||||
| Amount: |
||||||||||||||||||||||||
| Commercial |
$ | 60,733 | $ | 14,190 | $ | — | $ | 2,799 | $ | 4,496 | $ | 82,218 | ||||||||||||
| Commercial real estate |
— | 5,157 | — | 4,211 | 3,609 | 12,977 | ||||||||||||||||||
| Construction |
— | — | — | — | — | — | ||||||||||||||||||
| Residential real estate |
— | — | — | — | 874 | 874 | ||||||||||||||||||
| Personal and home equity |
— | — | — | — | 1,621 | 1,621 | ||||||||||||||||||
|
|
|
|
|
|
|
|
|
|
|
|
|
|||||||||||||
| Total |
$ | 60,733 | $ | 19,347 | $ | — | $ | 7,010 | $ | 10,600 | $ | 97,690 | ||||||||||||
|
|
|
|
|
|
|
|
|
|
|
|
|
|||||||||||||
| Number of borrowers: |
||||||||||||||||||||||||
| Commercial |
4 | 2 | — | 1 | 10 | 17 | ||||||||||||||||||
| Commercial real estate |
— | 1 | — | 2 | 8 | 11 | ||||||||||||||||||
| Construction |
— | — | — | — | — | — | ||||||||||||||||||
| Residential real estate |
— | — | — | — | 3 | 3 | ||||||||||||||||||
| Personal and home equity |
— | — | — | — | 2 | 2 | ||||||||||||||||||
|
|
|
|
|
|
|
|
|
|
|
|
|
|||||||||||||
| Total |
4 | 3 | — | 3 | 23 | 33 | ||||||||||||||||||
|
|
|
|
|
|
|
|
|
|
|
|
|
|||||||||||||
| As of March 31, 2012 |
||||||||||||||||||||||||
| Amount: |
||||||||||||||||||||||||
| Commercial |
$ | 55,205 | $ | 20,050 | $ | 3,259 | $ | — | $ | 4,155 | $ | 82,669 | ||||||||||||
| Commercial real estate |
20,576 | 5,178 | — | 7,217 | 4,586 | 37,557 | ||||||||||||||||||
| Construction |
— | — | — | — | — | — | ||||||||||||||||||
| Residential real estate |
— | — | — | — | 1,115 | 1,115 | ||||||||||||||||||
| Personal and home equity |
12,593 | — | — | — | 2,587 | 15,180 | ||||||||||||||||||
|
|
|
|
|
|
|
|
|
|
|
|
|
|||||||||||||
| Total |
$ | 88,374 | $ | 25,228 | $ | 3,259 | $ | 7,217 | $ | 12,443 | $ | 136,521 | ||||||||||||
|
|
|
|
|
|
|
|
|
|
|
|
|
|||||||||||||
| Number of borrowers: |
||||||||||||||||||||||||
| Commercial |
4 | 3 | 1 | — | 10 | 18 | ||||||||||||||||||
| Commercial real estate |
1 | 1 | — | 3 | 9 | 14 | ||||||||||||||||||
| Construction |
— | — | — | — | — | — | ||||||||||||||||||
| Residential real estate |
— | — | — | — | 4 | 4 | ||||||||||||||||||
| Personal and home equity |
1 | — | — | — | 4 | 5 | ||||||||||||||||||
|
|
|
|
|
|
|
|
|
|
|
|
|
|||||||||||||
| Total |
6 | 4 | 1 | 3 | 27 | 41 | ||||||||||||||||||
|
|
|
|
|
|
|
|
|
|
|
|
|
|||||||||||||
| (1) | Refer to Glossary of Terms for definition. |
Foreclosed Real Estate (OREO), excluding covered assets(1)
| Unaudited (Dollars in thousands) |
| |

OREO Properties by Type
| June 30, 2012 | March 31, 2012 | December 31, 2011 | ||||||||||||||||||||||||||||||||||
| Number of | % of | Number of | % of | Number of | % of | |||||||||||||||||||||||||||||||
| Properties | Amount | Total | Properties | Amount | Total | Properties | Amount | Total | ||||||||||||||||||||||||||||
| Single-family homes |
58 | $ | 17,734 | 16 | % | 69 | $ | 21,074 | 17 | % | 71 | $ | 26,866 | 21 | % | |||||||||||||||||||||
| Land parcels |
273 | 43,367 | 39 | % | 260 | 49,706 | 40 | % | 262 | 51,465 | 41 | % | ||||||||||||||||||||||||
| Multi-family |
8 | 2,026 | 2 | % | 13 | 4,665 | 4 | % | 14 | 3,327 | 3 | % | ||||||||||||||||||||||||
| Office/industrial |
45 | 34,912 | 32 | % | 47 | 39,983 | 32 | % | 44 | 37,019 | 29 | % | ||||||||||||||||||||||||
| Retail |
23 | 11,797 | 11 | % | 11 | 8,070 | 7 | % | 9 | 7,052 | 6 | % | ||||||||||||||||||||||||
|
|
|
|
|
|
|
|
|
|
|
|
|
|
|
|
|
|
|
|||||||||||||||||||
| Total |
407 | $ | 109,836 | 100 | % | 400 | $ | 123,498 | 100 | % | 400 | $ | 125,729 | 100 | % | |||||||||||||||||||||
|
|
|
|
|
|
|
|
|
|
|
|
|
|
|
|
|
|
|
|||||||||||||||||||
OREO Property Type by Location
| South | Mid | |||||||||||||||||||||||||||
| Illinois | Georgia | Michigan | Eastern (2) | Western (3) | Other | Total | ||||||||||||||||||||||
| June 30, 2012 |
||||||||||||||||||||||||||||
| Single-family homes |
$ | 16,431 | $ | — | $ | — | $ | — | $ | 1,062 | $ | 241 | $ | 17,734 | ||||||||||||||
| Land parcels |
24,104 | 2,996 | 1,956 | 8,133 | 6,178 | — | 43,367 | |||||||||||||||||||||
| Multi-family |
1,918 | — | — | — | 108 | — | 2,026 | |||||||||||||||||||||
| Office/industrial |
18,720 | 1,058 | 1,181 | 3,762 | 8,140 | 2,051 | 34,912 | |||||||||||||||||||||
| Retail |
8,946 | 2,851 | — | — | — | — | 11,797 | |||||||||||||||||||||
|
|
|
|
|
|
|
|
|
|
|
|
|
|
|
|||||||||||||||
| Total |
$ | 70,119 | $ | 6,905 | $ | 3,137 | $ | 11,895 | $ | 15,488 | $ | 2,292 | $ | 109,836 | ||||||||||||||
|
|
|
|
|
|
|
|
|
|
|
|
|
|
|
|||||||||||||||
| % of Total |
64 | % | 6 | % | 3 | % | 11 | % | 14 | % | 2 | % | 100 | % | ||||||||||||||
| March 31, 2012 |
||||||||||||||||||||||||||||
| Single-family homes |
$ | 18,497 | $ | — | $ | 1,718 | $ | — | $ | 618 | $ | 241 | $ | 21,074 | ||||||||||||||
| Land parcels |
27,487 | 3,438 | 2,137 | 9,568 | 7,076 | — | 49,706 | |||||||||||||||||||||
| Multi-family |
1,335 | — | — | 460 | 2,870 | — | 4,665 | |||||||||||||||||||||
| Office/industrial |
19,670 | 1,058 | 1,197 | 6,411 | 8,253 | 3,394 | 39,983 | |||||||||||||||||||||
| Retail |
4,872 | 2,262 | 936 | — | — | — | 8,070 | |||||||||||||||||||||
|
|
|
|
|
|
|
|
|
|
|
|
|
|
|
|||||||||||||||
| Total |
$ | 71,861 | $ | 6,758 | $ | 5,988 | $ | 16,439 | $ | 18,817 | $ | 3,635 | $ | 123,498 | ||||||||||||||
|
|
|
|
|
|
|
|
|
|
|
|
|
|
|
|||||||||||||||
| % of Total |
58 | % | 6 | % | 5 | % | 13 | % | 15 | % | 3 | % | 100 | % | ||||||||||||||
| December 31, 2011 |
||||||||||||||||||||||||||||
| Single family homes |
$ | 23,277 | $ | 385 | $ | 1,718 | $ | — | $ | 608 | $ | 878 | $ | 26,866 | ||||||||||||||
| Land parcels |
29,370 | 2,898 | 3,171 | 9,568 | 6,458 | — | 51,465 | |||||||||||||||||||||
| Multi-family |
3,327 | — | — | — | — | — | 3,327 | |||||||||||||||||||||
| Office/industrial |
18,430 | 1,656 | 548 | 3,762 | 9,228 | 3,395 | 37,019 | |||||||||||||||||||||
| Retail |
4,501 | 1,615 | 936 | — | — | — | 7,052 | |||||||||||||||||||||
|
|
|
|
|
|
|
|
|
|
|
|
|
|
|
|||||||||||||||
| Total |
$ | 78,905 | $ | 6,554 | $ | 6,373 | $ | 13,330 | $ | 16,294 | $ | 4,273 | $ | 125,729 | ||||||||||||||
|
|
|
|
|
|
|
|
|
|
|
|
|
|
|
|||||||||||||||
| % of Total |
63 | % | 5 | % | 5 | % | 11 | % | 13 | % | 3 | % | 100 | % | ||||||||||||||
| (1) | Refer to Glossary of Terms for definition. |
| (2) | Represents the southeastern states of Arkansas and Florida. |
| (3) | Represents the midwestern states of Kansas, Missouri, Wisconsin, Indiana and Ohio. |
Allowance for Loan Losses (excluding covered assets(1))
| Unaudited (Dollars in thousands) |

| |
| 2Q12 | 1Q12 | 4Q11 | 3Q11 | 2Q11 | ||||||||||||||||
| Change in allowance for loan losses: |
||||||||||||||||||||
| Balance at beginning of period |
$ | 183,844 | $ | 191,594 | $ | 200,041 | $ | 206,286 | $ | 218,237 | ||||||||||
| Loans charged-off: |
||||||||||||||||||||
| Commercial |
$ | (7,769 | ) | $ | (9,549 | ) | $ | (12,991 | ) | $ | (5,039 | ) | $ | (10,512 | ) | |||||
| Commercial real estate |
(17,924 | ) | (25,280 | ) | (24,083 | ) | (29,920 | ) | (25,402 | ) | ||||||||||
| Construction |
(828 | ) | (1,245 | ) | (1,526 | ) | (1,419 | ) | (8,275 | ) | ||||||||||
| Residential real estate |
(1,006 | ) | (1,084 | ) | (1,203 | ) | (234 | ) | (186 | ) | ||||||||||
| Home equity |
(4 | ) | (483 | ) | (1,340 | ) | (3,291 | ) | (508 | ) | ||||||||||
| Personal |
(6,341 | ) | (2,085 | ) | (290 | ) | (2,083 | ) | (434 | ) | ||||||||||
|
|
|
|
|
|
|
|
|
|
|
|||||||||||
| Total charge-offs |
(33,872 | ) | (39,726 | ) | (41,433 | ) | (41,986 | ) | (45,317 | ) | ||||||||||
|
|
|
|
|
|
|
|
|
|
|
|||||||||||
| Recoveries on loans previously charged-off: |
||||||||||||||||||||
| Commercial |
$ | 634 | $ | 1,679 | $ | 830 | $ | 2,278 | $ | 707 | ||||||||||
| Commercial real estate |
4,150 | 1,882 | 1,410 | 969 | 511 | |||||||||||||||
| Construction |
1,664 | 41 | 109 | 29 | 56 | |||||||||||||||
| Residential real estate |
2 | 11 | 10 | 9 | 40 | |||||||||||||||
| Home equity |
314 | 26 | 300 | 12 | 15 | |||||||||||||||
| Personal |
163 | 702 | 544 | 103 | 312 | |||||||||||||||
|
|
|
|
|
|
|
|
|
|
|
|||||||||||
| Total recoveries |
6,927 | 4,341 | 3,203 | 3,400 | 1,641 | |||||||||||||||
|
|
|
|
|
|
|
|
|
|
|
|||||||||||
| Net charge-offs |
(26,945 | ) | (35,385 | ) | (38,230 | ) | (38,586 | ) | (43,676 | ) | ||||||||||
| Provisions charged to operating expense |
17,403 | 27,635 | 29,783 | 32,341 | 31,725 | |||||||||||||||
|
|
|
|
|
|
|
|
|
|
|
|||||||||||
| Balance at end of period |
$ | 174,302 | $ | 183,844 | $ | 191,594 | $ | 200,041 | $ | 206,286 | ||||||||||
|
|
|
|
|
|
|
|
|
|
|
|||||||||||
| Allocation of allowance for loan losses: |
||||||||||||||||||||
| General allocated reserve: |
||||||||||||||||||||
| Commercial |
$ | 47,210 | $ | 45,850 | $ | 46,500 | $ | 45,000 | $ | 46,000 | ||||||||||
| Commercial real estate |
53,700 | 57,750 | 56,000 | 60,000 | 67,000 | |||||||||||||||
| Construction |
2,635 | 1,900 | 7,650 | 10,450 | 9,600 | |||||||||||||||
| Residential real estate |
5,200 | 5,400 | 5,400 | 5,800 | 5,400 | |||||||||||||||
| Home equity |
4,200 | 4,700 | 2,750 | 3,500 | 3,500 | |||||||||||||||
| Personal |
3,260 | 3,295 | 3,350 | 3,100 | 3,100 | |||||||||||||||
|
|
|
|
|
|
|
|
|
|
|
|||||||||||
| Total allocated |
$ | 116,205 | $ | 118,895 | $ | 121,650 | $ | 127,850 | $ | 134,600 | ||||||||||
| Specific reserve |
58,097 | 64,949 | 69,944 | 72,191 | 71,686 | |||||||||||||||
|
|
|
|
|
|
|
|
|
|
|
|||||||||||
| Total |
$ | 174,302 | $ | 183,844 | $ | 191,594 | $ | 200,041 | $ | 206,286 | ||||||||||
|
|
|
|
|
|
|
|
|
|
|
|||||||||||
| Allocation of reserve by a percent of total allowance for loan losses: |
||||||||||||||||||||
| General allocated reserve: |
||||||||||||||||||||
| Commercial |
27 | % | 25 | % | 24 | % | 22 | % | 22 | % | ||||||||||
| Commercial real estate |
31 | % | 31 | % | 29 | % | 30 | % | 32 | % | ||||||||||
| Construction |
2 | % | 1 | % | 4 | % | 5 | % | 5 | % | ||||||||||
| Residential real estate |
3 | % | 3 | % | 3 | % | 3 | % | 3 | % | ||||||||||
| Home equity |
2 | % | 3 | % | 1 | % | 2 | % | 2 | % | ||||||||||
| Personal |
2 | % | 2 | % | 2 | % | 2 | % | 2 | % | ||||||||||
|
|
|
|
|
|
|
|
|
|
|
|||||||||||
| Total allocated |
67 | % | 65 | % | 63 | % | 64 | % | 66 | % | ||||||||||
| Specific reserve |
33 | % | 35 | % | 37 | % | 36 | % | 34 | % | ||||||||||
|
|
|
|
|
|
|
|
|
|
|
|||||||||||
| Total |
100 | % | 100 | % | 100 | % | 100 | % | 100 | % | ||||||||||
|
|
|
|
|
|
|
|
|
|
|
|||||||||||
| Allowance for loan losses to: |
||||||||||||||||||||
| Total loans |
1.85 | % | 1.99 | % | 2.13 | % | 2.31 | % | 2.38 | % | ||||||||||
| Nonperforming loans |
83 | % | 79 | % | 74 | % | 66 | % | 62 | % | ||||||||||
| (1) | Refer to Glossary of Terms for definition. |
| Deposits (Dollars in thousands) |

|
| % of | % of | % of | % of | % of | ||||||||||||||||||||||||||||||||||||
| 06/30/12 | Total | 03/31/12 | Total | 12/31/11 | Total | 09/30/11 | Total | 06/30/11 | Total | |||||||||||||||||||||||||||||||
| unaudited | unaudited | audited | unaudited | unaudited | ||||||||||||||||||||||||||||||||||||
| Noninterest-bearing deposits |
$ | 2,920,182 | 27 | % | $ | 3,054,536 | 29 | % | $ | 3,244,307 | 31 | % | $ | 2,832,481 | 28 | % | $ | 2,527,230 | 25 | % | ||||||||||||||||||||
| Interest-bearing demand deposits |
785,879 | 7 | % | 714,522 | 7 | % | 595,238 | 6 | % | 611,293 | 6 | % | 531,107 | 5 | % | |||||||||||||||||||||||||
| Savings deposits |
221,816 | 2 | % | 225,300 | 2 | % | 210,138 | 2 | % | 214,610 | 2 | % | 202,427 | 2 | % | |||||||||||||||||||||||||
| Money market accounts |
3,924,206 | 37 | % | 4,122,532 | 40 | % | 4,168,082 | 40 | % | 4,178,087 | 41 | % | 4,294,870 | 42 | % | |||||||||||||||||||||||||
| Brokered deposits: |
||||||||||||||||||||||||||||||||||||||||
| Traditional |
667,454 | 6 | % | 191,023 | 2 | % | 20,499 | * | 60,665 | 1 | % | 277,628 | 3 | % | ||||||||||||||||||||||||||
| Client CDARS (1) |
762,231 | 7 | % | 695,458 | 6 | % | 795,452 | 8 | % | 841,337 | 8 | % | 956,094 | 9 | % | |||||||||||||||||||||||||
| Non-client CDARS (1) |
54,750 | 1 | % | 75,000 | 1 | % | — | — | — | — | 108,700 | 1 | % | |||||||||||||||||||||||||||
|
|
|
|
|
|
|
|
|
|
|
|
|
|
|
|
|
|
|
|
|
|||||||||||||||||||||
| Total brokered deposits |
1,484,435 | 14 | % | 961,481 | 9 | % | 815,951 | 8 | % | 902,002 | 9 | % | 1,342,422 | 13 | % | |||||||||||||||||||||||||
| Time deposits |
1,398,012 | 13 | % | 1,344,341 | 13 | % | 1,359,138 | 13 | % | 1,370,190 | 14 | % | 1,336,212 | 13 | % | |||||||||||||||||||||||||
|
|
|
|
|
|
|
|
|
|
|
|
|
|
|
|
|
|
|
|
|
|||||||||||||||||||||
| Total deposits |
$ | 10,734,530 | 100 | % | $ | 10,422,712 | 100 | % | $ | 10,392,854 | 100 | % | $ | 10,108,663 | 100 | % | $ | 10,234,268 | 100 | % | ||||||||||||||||||||
|
|
|
|
|
|
|
|
|
|
|
|
|
|
|
|
|
|
|
|
|
|||||||||||||||||||||
| Client deposits (1) |
$ | 10,012,326 | 93 | % | $ | 10,156,689 | 97 | % | $ | 10,372,355 | 100 | % | $ | 10,047,998 | 99 | % | $ | 9,847,940 | 96 | % | ||||||||||||||||||||
|
|
|
|
|
|
|
|
|
|
|
|
|
|
|
|
|
|
|
|
|
|||||||||||||||||||||
| * | Less than 1%. |
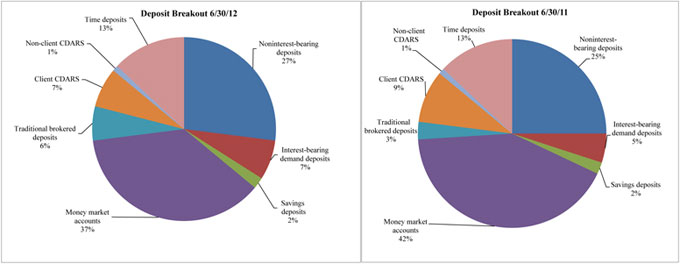
| (1) | Refer to Glossary of Terms for definition. |
| Net Interest Margin Unaudited
(Dollars in thousands) |

|
| Three Months Ended June 30, | ||||||||||||||||||||||||
| 2012 | 2011 | |||||||||||||||||||||||
| Average Balance |
Interest (1) | Yield/ Rate |
Average Balance |
Interest (1) | Yield/ Rate |
|||||||||||||||||||
| Assets: |
||||||||||||||||||||||||
| Federal funds sold and other short-term investments |
$ | 210,756 | $ | 133 | 0.25 | % | $ | 631,725 | $ | 399 | 0.25 | % | ||||||||||||
| Securities: |
||||||||||||||||||||||||
| Taxable |
2,126,446 | 14,854 | 2.79 | % | 1,826,537 | 15,568 | 3.41 | % | ||||||||||||||||
| Tax-exempt (2) |
171,426 | 2,035 | 4.75 | % | 139,620 | 2,103 | 6.02 | % | ||||||||||||||||
|
|
|
|
|
|
|
|
|
|
|
|
|
|||||||||||||
| Total securities |
2,297,872 | 16,889 | 2.94 | % | 1,966,157 | 17,671 | 3.59 | % | ||||||||||||||||
|
|
|
|
|
|
|
|
|
|
|
|
|
|||||||||||||
| Loans, excluding covered assets: |
||||||||||||||||||||||||
| Commercial |
5,704,843 | 65,535 | 4.54 | % | 5,098,199 | 58,667 | 4.55 | % | ||||||||||||||||
| Commercial real estate |
2,778,787 | 28,586 | 4.07 | % | 2,719,370 | 28,348 | 4.12 | % | ||||||||||||||||
| Construction |
152,891 | 1,536 | 3.97 | % | 413,049 | 3,640 | 3.49 | % | ||||||||||||||||
| Residential |
347,922 | 3,630 | 4.17 | % | 314,362 | 3,424 | 4.36 | % | ||||||||||||||||
| Personal and home equity |
417,427 | 3,666 | 3.53 | % | 441,100 | 4,023 | 3.66 | % | ||||||||||||||||
|
|
|
|
|
|
|
|
|
|
|
|
|
|||||||||||||
| Total loans, excluding covered assets (3) |
9,401,870 | 102,953 | 4.34 | % | 8,986,080 | 98,102 | 4.32 | % | ||||||||||||||||
|
|
|
|
|
|
|
|
|
|
|
|
|
|||||||||||||
| Total interest-earning assets before covered assets (2) |
11,910,498 | 119,975 | 3.99 | % | 11,583,962 | 116,172 | 3.98 | % | ||||||||||||||||
| Covered assets (4) |
237,781 | 2,189 | 3.66 | % | 332,076 | 4,289 | 5.12 | % | ||||||||||||||||
|
|
|
|
|
|
|
|
|
|
|
|
|
|||||||||||||
| Total interest-earning assets (2) |
12,148,279 | $ | 122,164 | 3.99 | % | 11,916,038 | $ | 120,461 | 4.01 | % | ||||||||||||||
|
|
|
|
|
|
|
|
|
|||||||||||||||||
| Cash and due from banks |
148,174 | 156,678 | ||||||||||||||||||||||
| Allowance for loan and covered loan losses |
(218,798 | ) | (245,608 | ) | ||||||||||||||||||||
| Other assets |
702,533 | 672,575 | ||||||||||||||||||||||
|
|
|
|
|
|||||||||||||||||||||
| Total assets |
$ | 12,780,188 | $ | 12,499,683 | ||||||||||||||||||||
|
|
|
|
|
|||||||||||||||||||||
| Liabilities and Equity: |
||||||||||||||||||||||||
| Interest-bearing demand deposits |
$ | 795,833 | $ | 799 | 0.40 | % | $ | 553,328 | $ | 587 | 0.42 | % | ||||||||||||
| Savings deposits |
225,335 | 161 | 0.29 | % | 204,794 | 209 | 0.41 | % | ||||||||||||||||
| Money market accounts |
3,920,627 | 4,104 | 0.42 | % | 4,560,816 | 5,873 | 0.52 | % | ||||||||||||||||
| Time deposits |
1,341,312 | 3,862 | 1.16 | % | 1,333,194 | 4,289 | 1.29 | % | ||||||||||||||||
| Brokered deposits |
1,382,207 | 1,532 | 0.45 | % | 1,393,661 | 2,239 | 0.64 | % | ||||||||||||||||
|
|
|
|
|
|
|
|
|
|
|
|
|
|||||||||||||
| Total interest-bearing deposits |
7,665,314 | 10,458 | 0.55 | % | 8,045,793 | 13,197 | 0.66 | % | ||||||||||||||||
| Short-term borrowings |
250,774 | 123 | 0.19 | % | 70,045 | 566 | 3.20 | % | ||||||||||||||||
| Long-term debt |
379,463 | 5,538 | 5.82 | % | 409,793 | 5,479 | 5.33 | % | ||||||||||||||||
|
|
|
|
|
|
|
|
|
|
|
|
|
|||||||||||||
| Total interest-bearing liabilities |
8,295,551 | 16,119 | 0.78 | % | 8,525,631 | 19,242 | 0.90 | % | ||||||||||||||||
|
|
|
|
|
|
|
|
|
|||||||||||||||||
| Noninterest-bearing demand deposits |
2,995,802 | 2,556,527 | ||||||||||||||||||||||
| Other liabilities |
156,656 | 158,773 | ||||||||||||||||||||||
| Equity |
1,332,179 | 1,258,752 | ||||||||||||||||||||||
|
|
|
|
|
|||||||||||||||||||||
| Total liabilities and equity |
$ | 12,780,188 | $ | 12,499,683 | ||||||||||||||||||||
|
|
|
|
|
|||||||||||||||||||||
| Net interest spread (2) (5) |
3.21 | % | 3.11 | % | ||||||||||||||||||||
| Effect of noninterest-bearing funds |
0.25 | % | 0.25 | % | ||||||||||||||||||||
|
|
|
|
|
|||||||||||||||||||||
| Net interest income/margin (2) (5) |
$ | 106,045 | 3.46 | % | $ | 101,219 | 3.36 | % | ||||||||||||||||
|
|
|
|
|
|
|
|
|
|||||||||||||||||
| (1) | Interest income included $6.3 million and $5.5 million in loan fees for the three months ended June 30, 2012 and 2011, respectively. |
| (2) | Interest income and yields are presented on a tax-equivalent basis, assuming a federal income tax rate of 35%. This is a non-U.S. GAAP financial measure. Refer to Non-U.S. GAAP Financial Measures for a reconciliation of the effect of the tax-equivalent adjustment. |
| (3) | Average loans on a nonaccrual basis for the recognition of interest income totaled $222.1 million and $357.2 million for the three months ended June 30, 2012 and 2011, respectively, and are included in loans for purposes of this analysis. Interest foregone on impaired loans was estimated to be approximately $2.3 million and $3.7 million for the three months ended June 30, 2012 and 2011, respectively, and was based on the average loan portfolio yield for the respective period. |
| (4) | Covered interest-earning assets consist of loans acquired through an FDIC-assisted transaction that are subject to a loss share agreement and the related indemnification asset. |
| (5) | Refer to Glossary of Terms for definition. |
| Net Interest Margin Unaudited
(Dollars in thousands) |

|
| Three Months Ended June 30, | Three Months Ended March 31, | |||||||||||||||||||||||
| 2012 | 2012 | |||||||||||||||||||||||
| Average Balance |
Interest (1) | Yield/ Rate |
Average Balance |
Interest (1) | Yield/ Rate |
|||||||||||||||||||
| Assets: |
||||||||||||||||||||||||
| Federal funds sold and other short-term investments |
$ | 210,756 | $ | 133 | 0.25 | % | $ | 211,343 | $ | 132 | 0.25 | % | ||||||||||||
| Securities: |
||||||||||||||||||||||||
| Taxable |
2,126,446 | 14,854 | 2.79 | % | 2,097,422 | 15,380 | 2.93 | % | ||||||||||||||||
| Tax-exempt (2) |
171,426 | 2,035 | 4.75 | % | 152,412 | 1,980 | 5.20 | % | ||||||||||||||||
|
|
|
|
|
|
|
|
|
|
|
|
|
|||||||||||||
| Total securities |
2,297,872 | 16,889 | 2.94 | % | 2,249,834 | 17,360 | 3.09 | % | ||||||||||||||||
|
|
|
|
|
|
|
|
|
|
|
|
|
|||||||||||||
| Loans, excluding covered assets: |
||||||||||||||||||||||||
| Commercial |
5,704,843 | 65,535 | 4.54 | % | 5,443,925 | 63,910 | 4.64 | % | ||||||||||||||||
| Commercial real estate |
2,778,787 | 28,586 | 4.07 | % | 2,598,139 | 27,715 | 4.22 | % | ||||||||||||||||
| Construction |
152,891 | 1,536 | 3.97 | % | 279,343 | 2,611 | 3.70 | % | ||||||||||||||||
| Residential |
347,922 | 3,630 | 4.17 | % | 338,144 | 3,619 | 4.28 | % | ||||||||||||||||
| Personal and home equity |
417,427 | 3,666 | 3.53 | % | 411,152 | 3,732 | 3.65 | % | ||||||||||||||||
|
|
|
|
|
|
|
|
|
|
|
|
|
|||||||||||||
| Total loans, excluding covered assets (3) |
9,401,870 | 102,953 | 4.34 | % | 9,070,703 | 101,587 | 4.44 | % | ||||||||||||||||
|
|
|
|
|
|
|
|
|
|
|
|
|
|||||||||||||
| Total interest-earning assets before covered assets (2) |
11,910,498 | 119,975 | 3.99 | % | 11,531,880 | 119,079 | 4.10 | % | ||||||||||||||||
| Covered assets (4) |
237,781 | 2,189 | 3.66 | % | 264,619 | 1,952 | 2.93 | % | ||||||||||||||||
|
|
|
|
|
|
|
|
|
|
|
|
|
|||||||||||||
| Total interest-earning assets (2) |
12,148,279 | $ | 122,164 | 3.99 | % | 11,796,499 | $ | 121,031 | 4.07 | % | ||||||||||||||
|
|
|
|
|
|
|
|
|
|||||||||||||||||
| Cash and due from banks |
148,174 | 141,317 | ||||||||||||||||||||||
| Allowance for loan and covered loan losses |
(218,798 | ) | (224,071 | ) | ||||||||||||||||||||
| Other assets |
702,533 | 731,771 | ||||||||||||||||||||||
|
|
|
|
|
|||||||||||||||||||||
| Total assets |
$ | 12,780,188 | $ | 12,445,516 | ||||||||||||||||||||
|
|
|
|
|
|||||||||||||||||||||
| Liabilities and Equity: |
||||||||||||||||||||||||
| Interest-bearing demand deposits |
$ | 795,833 | $ | 799 | 0.40 | % | $ | 654,791 | $ | 636 | 0.39 | % | ||||||||||||
| Savings deposits |
225,335 | 161 | 0.29 | % | 218,145 | 156 | 0.29 | % | ||||||||||||||||
| Money market accounts |
3,920,627 | 4,104 | 0.42 | % | 4,199,855 | 4,446 | 0.43 | % | ||||||||||||||||
| Time deposits |
1,341,312 | 3,862 | 1.16 | % | 1,352,361 | 3,933 | 1.17 | % | ||||||||||||||||
| Brokered deposits |
1,382,207 | 1,532 | 0.45 | % | 811,069 | 1,084 | 0.54 | % | ||||||||||||||||
|
|
|
|
|
|
|
|
|
|
|
|
|
|||||||||||||
| Total interest-bearing deposits |
7,665,314 | 10,458 | 0.55 | % | 7,236,221 | 10,255 | 0.57 | % | ||||||||||||||||
| Short-term borrowings |
250,774 | 123 | 0.19 | % | 265,205 | 142 | 0.21 | % | ||||||||||||||||
| Long-term debt |
379,463 | 5,538 | 5.82 | % | 379,793 | 5,578 | 5.85 | % | ||||||||||||||||
|
|
|
|
|
|
|
|
|
|
|
|
|
|||||||||||||
| Total interest-bearing liabilities |
8,295,551 | 16,119 | 0.78 | % | 7,881,219 | 15,975 | 0.81 | % | ||||||||||||||||
|
|
|
|
|
|
|
|
|
|||||||||||||||||
| Noninterest-bearing demand deposits |
2,995,802 | 3,054,679 | ||||||||||||||||||||||
| Other liabilities |
156,656 | 194,262 | ||||||||||||||||||||||
| Equity |
1,332,179 | 1,315,356 | ||||||||||||||||||||||
|
|
|
|
|
|||||||||||||||||||||
| Total liabilities and equity |
$ | 12,780,188 | $ | 12,445,516 | ||||||||||||||||||||
|
|
|
|
|
|||||||||||||||||||||
| Net interest spread (2) (5) |
3.21 | % | 3.26 | % | ||||||||||||||||||||
| Effect of noninterest-bearing funds |
0.25 | % | 0.27 | % | ||||||||||||||||||||
|
|
|
|
|
|||||||||||||||||||||
| Net interest income/margin (2) (5) |
$ | 106,045 | 3.46 | % | $ | 105,056 | 3.53 | % | ||||||||||||||||
|
|
|
|
|
|
|
|
|
|||||||||||||||||
| (1) | Interest income included $6.3 million and $7.2 million in loan fees for the three months ended June 30, 2012 and March 31, 2012, respectively. |
| (2) | Interest income and yields are presented on a tax-equivalent basis, assuming a federal income tax rate of 35%. This is a non-U.S. GAAP financial measure. Refer to Non-U.S. GAAP Financial Measures for a reconciliation of the effect of the tax-equivalent adjustment. |
| (3) | Average loans on a nonaccrual basis for the recognition of interest income totaled $222.1 million and $256.8 million for the three months ended June 30, 2012 and March 31, 2012, respectively, and are included in loans for purposes of this analysis. Interest foregone on impaired loans was estimated to be approximately $2.3 million and $2.8 million for the three months ended June 30, 2012 and March 31, 2012, respectively, and was based on the average loan portfolio yield for the respective period. |
| (4) | Covered interest-earning assets consist of loans acquired through an FDIC-assisted transaction that are subject to a loss share agreement and the related indemnification asset. |
| (5) | Refer to Glossary of Terms for definition. |
| Net Interest Margin Unaudited
(Dollars in thousands) |

|
| Six Months Ended June 30, | ||||||||||||||||||||||||
| 2012 | 2011 | |||||||||||||||||||||||
| Average Balance |
Interest (1) | Yield/ Rate |
Average Balance |
Interest (1) | Yield/ Rate |
|||||||||||||||||||
| Assets: |
||||||||||||||||||||||||
| Fed funds sold and other short-term investments |
$ | 211,050 | $ | 265 | 0.25 | % | $ | 574,998 | $ | 735 | 0.25 | % | ||||||||||||
| Securities: |
||||||||||||||||||||||||
| Taxable |
2,111,934 | 30,234 | 2.86 | % | 1,780,697 | 30,958 | 3.48 | % | ||||||||||||||||
| Tax-exempt (2) |
161,919 | 4,015 | 4.96 | % | 144,413 | 4,380 | 6.07 | % | ||||||||||||||||
|
|
|
|
|
|
|
|
|
|
|
|
|
|||||||||||||
| Total securities |
2,273,853 | 34,249 | 3.01 | % | 1,925,110 | 35,338 | 3.67 | % | ||||||||||||||||
|
|
|
|
|
|
|
|
|
|
|
|
|
|||||||||||||
| Loans, excluding covered assets: |
||||||||||||||||||||||||
| Commercial |
5,573,826 | 129,444 | 4.59 | % | 5,060,294 | 116,412 | 4.58 | % | ||||||||||||||||
| Commercial real estate |
2,688,545 | 56,301 | 4.14 | % | 2,780,249 | 58,277 | 4.17 | % | ||||||||||||||||
| Construction |
228,601 | 4,147 | 3.59 | % | 464,498 | 8,525 | 3.65 | % | ||||||||||||||||
| Residential |
333,940 | 7,249 | 4.34 | % | 321,562 | 7,209 | 4.48 | % | ||||||||||||||||
| Personal and home equity |
412,269 | 7,398 | 3.61 | % | 453,866 | 8,089 | 3.59 | % | ||||||||||||||||
|
|
|
|
|
|
|
|
|
|
|
|
|
|||||||||||||
| Total loans, excluding covered assets (3) |
9,237,181 | 204,539 | 4.38 | % | 9,080,469 | 198,512 | 4.35 | % | ||||||||||||||||
|
|
|
|
|
|
|
|
|
|
|
|
|
|||||||||||||
| Total interest-earning assets before covered assets (2) |
11,722,084 | 239,053 | 4.04 | % | 11,580,577 | 234,585 | 4.03 | % | ||||||||||||||||
| Covered assets (4) |
251,200 | 4,142 | 3.28 | % | 342,668 | 9,526 | 5.54 | % | ||||||||||||||||
|
|
|
|
|
|
|
|
|
|
|
|
|
|||||||||||||
| Total interest-earning assets (2) |
11,973,284 | $ | 243,195 | 4.03 | % | 11,923,245 | $ | 244,111 | 4.08 | % | ||||||||||||||
|
|
|
|
|
|
|
|
|
|||||||||||||||||
| Cash and due from banks |
144,741 | 163,802 | ||||||||||||||||||||||
| Allowance for loan and covered loan losses |
(221,434 | ) | (247,825 | ) | ||||||||||||||||||||
| Other assets |
705,779 | 663,580 | ||||||||||||||||||||||
|
|
|
|
|
|||||||||||||||||||||
| Total assets |
$ | 12,602,370 | $ | 12,502,802 | ||||||||||||||||||||
|
|
|
|
|
|||||||||||||||||||||
| Liabilities and Equity: |
||||||||||||||||||||||||
| Interest-bearing demand deposits |
$ | 725,312 | $ | 1,435 | 0.40 | % | $ | 576,216 | $ | 1,229 | 0.43 | % | ||||||||||||
| Savings deposits |
221,740 | 317 | 0.29 | % | 201,168 | 408 | 0.41 | % | ||||||||||||||||
| Money market accounts |
4,060,241 | 8,550 | 0.42 | % | 4,612,237 | 12,336 | 0.54 | % | ||||||||||||||||
| Time deposits |
1,346,836 | 7,795 | 1.16 | % | 1,356,068 | 8,807 | 1.31 | % | ||||||||||||||||
| Brokered deposits |
1,096,638 | 2,616 | 0.48 | % | 1,435,683 | 4,413 | 0.62 | % | ||||||||||||||||
|
|
|
|
|
|
|
|
|
|
|
|
|
|||||||||||||
| Total interest-bearing deposits |
7,450,767 | 20,713 | 0.56 | % | 8,181,372 | 27,193 | 0.67 | % | ||||||||||||||||
| Short-term borrowings |
257,990 | 265 | 0.20 | % | 92,377 | 1,393 | 3.00 | % | ||||||||||||||||
| Long-term debt |
379,628 | 11,116 | 5.81 | % | 410,870 | 10,962 | 5.32 | % | ||||||||||||||||
|
|
|
|
|
|
|
|
|
|
|
|
|
|||||||||||||
| Total interest-bearing liabilities |
8,088,385 | 32,094 | 0.79 | % | 8,684,619 | 39,548 | 0.91 | % | ||||||||||||||||
|
|
|
|
|
|
|
|
|
|||||||||||||||||
| Noninterest-bearing demand deposits |
3,025,241 | 2,411,118 | ||||||||||||||||||||||
| Other liabilities |
164,977 | 157,315 | ||||||||||||||||||||||
| Equity |
1,323,767 | 1,249,750 | ||||||||||||||||||||||
|
|
|
|
|
|||||||||||||||||||||
| Total liabilities and equity |
$ | 12,602,370 | $ | 12,502,802 | ||||||||||||||||||||
|
|
|
|
|
|||||||||||||||||||||
| Net interest spread (2) (5) |
3.24 | % | 3.17 | % | ||||||||||||||||||||
| Effect of non interest-bearing funds |
0.25 | % | 0.24 | % | ||||||||||||||||||||
|
|
|
|
|
|||||||||||||||||||||
| Net interest income/margin (2) (5) |
$ | 211,101 | 3.49 | % | $ | 204,563 | 3.41 | % | ||||||||||||||||
|
|
|
|
|
|
|
|
|
|||||||||||||||||
| (1) | Interest income included $13.6 million and $11.5 million in loan fees for the six months ended June 30, 2012 and 2011, respectively. |
| (2) | Interest income and yields are presented on a tax-equivalent basis, assuming a federal income tax rate of 35%. This is a non-U.S. GAAP measure. Refer to Non-U.S. GAAP Measures for a reconciliation of the effect of the tax-equivalent adjustment. |
| (3) | Average loans on a nonaccrual basis for the recognition of interest income totaled $240.3 million and $368.7 million for the six months ended June 30, 2012 and 2011, respectively, and are included in loans for purposes of this analysis. Interest foregone on impaired loans was estimated to be approximately $5.1 million and $7.7 million for the six months ended June 30, 2012 and 2011, respectively, and was based on the average loan portfolio yield for the respective period. |
| (4) | Covered interest-earning assets consist of loans acquired through an FDIC-assisted transaction that are subject to a loss share agreement and the related indemnification asset. |
| (5) | Refer to Glossary of Terms for definition. |
| Non-U.S. GAAP Financial Measures Unaudited
(Amounts in thousands) |

|
This press release contains both financial measures based on accounting principles generally accepted in the United States (U.S. GAAP) and non-U.S. GAAP based financial measures. These non-U.S. GAAP measures include net interest income, net interest margin, net revenue, operating profit and efficiency ratio all on a fully taxable-equivalent basis; tier 1 common equity to risk-weighted assets, tangible equity to tangible assets, tangible equity to risk-weighted assets, tangible common equity to tangible assets, and tangible book value. We believe that presenting these non-U.S. GAAP financial measures will provide information useful to investors in understanding our underlying operational performance, our business, and performance trends and facilitates comparisons with the performance of others in the banking industry.
We use net interest income on a taxable-equivalent basis in calculating various performance measures by increasing the interest income earned on tax-exempt assets to make it fully equivalent to interest income earned on taxable investments assuming a 35% tax rate. Management believes this measure to be the preferred industry measurement of net interest income as it enhances comparability to net interest income arising from taxable and tax-exempt sources, and accordingly believes that providing this measure may be useful for peer comparison purposes.
We also consider various measures when evaluating capital utilization and adequacy, including tier 1 common equity to risk-weighted assets, tangible equity to tangible assets, tangible equity to risk-weighted assets, tangible common equity to tangible assets, and tangible book value. These calculations are intended to complement the capital ratios defined by banking regulators for both absolute and comparative purposes. All of these measures exclude from capital the ending balances of goodwill and other intangibles while certain of these ratios exclude preferred capital components. Because U.S. GAAP does not include capital ratio measures, we believe there are no comparable U.S. GAAP financial measures to these ratios. We believe these non-U.S. GAAP financial measures are relevant because they provide information that is helpful in assessing the level of capital available to withstand unexpected market conditions. Additionally, presentation of these measures allows readers to compare certain aspects of our capitalization to other companies. However, because there are no standardized definitions for these ratios, our calculations may not be comparable with other companies, and the usefulness of these measures to investors may be limited.
Non-U.S. GAAP financial measures have inherent limitations, are not required to be uniformly applied, and are not audited. Although these non-U.S. GAAP financial measures are frequently used by stakeholders in the evaluation of a company, they have limitations as analytical tools, and should not be considered in isolation or as a substitute for analyses of results as reported under U.S. GAAP. As a result, we encourage readers to consider our Consolidated Financial Statements in their entirety and not to rely on any single financial measure. The following table reconciles Non-U.S. GAAP financial measures to U.S. GAAP:
| Quarters Ended | ||||||||||||||||||||
| 2Q12 | 1Q12 | 4Q11 | 3Q11 | 2Q11 | ||||||||||||||||
| Taxable-equivalent interest income |
||||||||||||||||||||
| U.S. GAAP net interest income |
$ | 105,346 | $ | 104,376 | $ | 102,982 | $ | 101,089 | $ | 100,503 | ||||||||||
| Taxable-equivalent adjustment |
699 | 680 | 671 | 680 | 716 | |||||||||||||||
|
|
|
|
|
|
|
|
|
|
|
|||||||||||
| Taxable-equivalent net interest income (a) |
$ | 106,045 | $ | 105,056 | $ | 103,653 | $ | 101,769 | $ | 101,219 | ||||||||||
|
|
|
|
|
|
|
|
|
|
|
|||||||||||
| Average Earning Assets (b) |
$ | 12,148,279 | $ | 11,796,499 | $ | 11,696,741 | $ | 11,446,323 | $ | 11,916,038 | ||||||||||
| Net Interest Margin ((a) annualized) / (b) |
3.46 | % | 3.53 | % | 3.48 | % | 3.49 | % | 3.36 | % | ||||||||||
| Net Revenue |
||||||||||||||||||||
| Taxable-equivalent net interest income (a) |
$ | 106,045 | $ | 105,056 | $ | 103,653 | $ | 101,769 | $ | 101,219 | ||||||||||
| U.S. GAAP non-interest income |
26,246 | 27,504 | 25,393 | 27,635 | 21,592 | |||||||||||||||
|
|
|
|
|
|
|
|
|
|
|
|||||||||||
| Net revenue |
$ | 132,291 | $ | 132,560 | $ | 129,046 | $ | 129,404 | $ | 122,811 | ||||||||||
|
|
|
|
|
|
|
|
|
|
|
|||||||||||
| Operating Profit |
||||||||||||||||||||
| U.S. GAAP income before income taxes |
$ | 30,696 | $ | 23,950 | $ | 20,534 | $ | 21,075 | $ | 15,338 | ||||||||||
| Provision for loan and covered loan losses |
17,038 | 27,701 | 31,611 | 32,615 | 31,093 | |||||||||||||||
| Taxable-equivalent adjustment |
699 | 680 | 671 | 680 | 716 | |||||||||||||||
|
|
|
|
|
|
|
|
|
|
|
|||||||||||
| Operating profit |
$ | 48,433 | $ | 52,331 | $ | 52,816 | $ | 54,370 | $ | 47,147 | ||||||||||
|
|
|
|
|
|
|
|
|
|
|
|||||||||||
| Efficiency Ratio |
||||||||||||||||||||
| U.S. GAAP non-interest expense (c) |
$ | 83,858 | $ | 80,229 | $ | 76,230 | $ | 75,034 | $ | 75,664 | ||||||||||
| Taxable-equivalent net interest income (a) |
$ | 106,045 | $ | 105,056 | $ | 103,653 | $ | 101,769 | $ | 101,219 | ||||||||||
| U.S. GAAP non-interest income |
26,246 | 27,504 | 25,393 | 27,635 | 21,592 | |||||||||||||||
|
|
|
|
|
|
|
|
|
|
|
|||||||||||
| Net revenue (d) |
$ | 132,291 | $ | 132,560 | $ | 129,046 | $ | 129,404 | $ | 122,811 | ||||||||||
|
|
|
|
|
|
|
|
|
|
|
|||||||||||
| Efficiency ratio (c) / (d) |
63.39 | % | 60.52 | % | 59.07 | % | 57.98 | % | 61.61 | % | ||||||||||
| Non-U.S. GAAP Financial Measures (continued) Unaudited (Amounts in thousands, except per share data) |
| |
| Six Months Ended June 30, | ||||||||
| 2012 | 2011 | |||||||
| Taxable-equivalent interest income |
||||||||
| U.S. GAAP net interest income |
$ | 209,722 | $ | 203,056 | ||||
| Taxable-equivalent adjustment |
1,379 | 1,507 | ||||||
|
|
|
|
|
|||||
| Taxable-equivalent net interest income (a) |
$ | 211,101 | $ | 204,563 | ||||
|
|
|
|
|
|||||
| Average Earning Assets (b) |
$ | 11,973,284 | $ | 11,923,245 | ||||
| Net Interest Margin ((a) annualized) / (b) |
3.49 | % | 3.41 | % | ||||
| Net Revenue |
||||||||
| Taxable-equivalent net interest income (a) |
$ | 211,101 | $ | 204,563 | ||||
| U.S. GAAP non-interest income |
53,750 | 45,219 | ||||||
|
|
|
|
|
|||||
| Net revenue |
$ | 264,851 | $ | 249,782 | ||||
|
|
|
|
|
|||||
| Operating Profit |
||||||||
| U.S. GAAP income before income taxes |
$ | 54,646 | $ | 28,591 | ||||
| Provision for loan and covered loan losses |
44,739 | 68,671 | ||||||
| Taxable-equivalent adjustment |
1,379 | 1,507 | ||||||
|
|
|
|
|
|||||
| Operating profit |
$ | 100,764 | $ | 98,769 | ||||
|
|
|
|
|
|||||
| Efficiency Ratio |
||||||||
| U.S. GAAP non-interest expense (c) |
$ | 164,087 | $ | 151,013 | ||||
| Taxable-equivalent net interest income (a) |
$ | 211,101 | $ | 204,563 | ||||
| U.S. GAAP non-interest income |
53,750 | 45,219 | ||||||
|
|
|
|
|
|||||
| Net revenue (d) |
$ | 264,851 | $ | 249,782 | ||||
|
|
|
|
|
|||||
| Efficiency ratio (c) / (d) |
61.95 | % | 60.46 | % | ||||
| Quarters Ended | ||||||||||||||||||||
| 2Q12 | 1Q12 | 4Q11 | 3Q11 | 2Q11 | ||||||||||||||||
| Tier 1 Common Capital |
||||||||||||||||||||
| U.S. GAAP total equity |
$ | 1,334,154 | $ | 1,312,154 | $ | 1,296,752 | $ | 1,286,176 | $ | 1,260,648 | ||||||||||
| Trust preferred securities |
244,793 | 244,793 | 244,793 | 244,793 | 244,793 | |||||||||||||||
| Less: accumulated other comprehensive income, net of tax |
50,987 | 47,152 | 46,697 | 46,051 | 32,535 | |||||||||||||||
| Less: goodwill |
94,546 | 94,559 | 94,571 | 94,584 | 94,596 | |||||||||||||||
| Less: other intangibles |
14,152 | 14,683 | 15,353 | 15,715 | 16,089 | |||||||||||||||
|
|
|
|
|
|
|
|
|
|
|
|||||||||||
| Tier 1 risk-based capital |
1,419,262 | 1,400,553 | 1,384,924 | 1,374,619 | 1,362,221 | |||||||||||||||
| Less: preferred stock |
241,185 | 240,791 | 240,403 | 240,020 | 239,642 | |||||||||||||||
| Less: trust preferred securities |
244,793 | 244,793 | 244,793 | 244,793 | 244,793 | |||||||||||||||
| Less: noncontrolling interests |
— | — | — | — | 163 | |||||||||||||||
|
|
|
|
|
|
|
|
|
|
|
|||||||||||
| Tier 1 common capital (e) |
$ | 933,284 | $ | 914,969 | $ | 899,728 | $ | 889,806 | $ | 877,623 | ||||||||||
|
|
|
|
|
|
|
|
|
|
|
|||||||||||
| Tangible Common Equity |
||||||||||||||||||||
| U.S. GAAP total equity |
$ | 1,334,154 | $ | 1,312,154 | $ | 1,296,752 | $ | 1,286,176 | $ | 1,260,648 | ||||||||||
| Less: goodwill |
94,546 | 94,559 | 94,571 | 94,584 | 94,596 | |||||||||||||||
| Less: other intangibles |
14,152 | 14,683 | 15,353 | 15,715 | 16,089 | |||||||||||||||
|
|
|
|
|
|
|
|
|
|
|
|||||||||||
| Tangible equity (f) |
1,225,456 | 1,202,912 | 1,186,828 | 1,175,877 | 1,149,963 | |||||||||||||||
| Less: preferred stock |
241,185 | 240,791 | 240,403 | 240,020 | 239,642 | |||||||||||||||
|
|
|
|
|
|
|
|
|
|
|
|||||||||||
| Tangible common equity (g) |
$ | 984,271 | $ | 962,121 | $ | 946,425 | $ | 935,857 | $ | 910,321 | ||||||||||
|
|
|
|
|
|
|
|
|
|
|
|||||||||||
| Tangible Assets |
||||||||||||||||||||
| U.S. GAAP total assets |
$ | 12,942,176 | $ | 12,623,164 | $ | 12,416,870 | $ | 12,019,861 | $ | 12,115,377 | ||||||||||
| Less: goodwill |
94,546 | 94,559 | 94,571 | 94,584 | 94,596 | |||||||||||||||
| Less: other intangibles |
14,152 | 14,683 | 15,353 | 15,715 | 16,089 | |||||||||||||||
|
|
|
|
|
|
|
|
|
|
|
|||||||||||
| Tangible assets (h) |
$ | 12,833,478 | $ | 12,513,922 | $ | 12,306,946 | $ | 11,909,562 | $ | 12,004,692 | ||||||||||
|
|
|
|
|
|
|
|
|
|
|
|||||||||||
| Risk-weighted Assets (i) (1) |
$ | 11,588,371 | $ | 11,374,212 | $ | 11,191,298 | $ | 10,665,256 | $ | 10,518,850 | ||||||||||
| Period-end Common Shares Outstanding (j) |
72,424 | 72,415 | 71,745 | 71,789 | 71,808 | |||||||||||||||
| Ratios: |
||||||||||||||||||||
| Tier 1 common equity to risk-weighted assets (e) / (i) (1) |
8.05 | % | 8.04 | % | 8.04 | % | 8.34 | % | 8.34 | % | ||||||||||
| Tangible equity to tangible assets (f) / (h) |
9.55 | % | 9.61 | % | 9.64 | % | 9.87 | % | 9.58 | % | ||||||||||
| Tangible equity to risk-weighted assets (f) / (i) (1) |
10.57 | % | 10.58 | % | 10.60 | % | 11.03 | % | 10.93 | % | ||||||||||
| Tangible common equity to tangible assets (g) / (h) |
7.67 | % | 7.69 | % | 7.69 | % | 7.86 | % | 7.58 | % | ||||||||||
| Tangible book value (g) / (j) |
$ | 13.59 | $ | 13.29 | $ | 13.19 | $ | 13.04 | $ | 12.68 | ||||||||||

Glossary of Terms
Assets under management and administration (“AUMA”)—Assets held in trust where we serve as trustee or in accounts where we make investment decisions on behalf of clients. AUMA also includes non-managed assets we hold in custody for clients or for which we receive fees for advisory or brokerage services. We do not include these assets on our Consolidated Balance Sheets.
Book value—Total common equity divided by outstanding shares of common stock at end of period.
CDARS® deposit program—is a deposit services arrangement that effectively achieves FDIC deposit insurance for jumbo deposit relationships. These deposits are classified as brokered deposits for regulatory reporting purposes; however, we classify these deposits as client CDARS® due to the source being our client relationships and are, therefore, not traditional ‘brokered’ deposits. We also participate in a non-client CDARS® program that is more like a traditional brokered deposit program in that our relationship is not with the underlying depositor.
Client deposits—Total deposits less brokered deposits plus client CDARS®.
Common equity—Total equity less preferred stock.
Covered assets—Assets acquired through an FDIC-assisted transaction that are subject to a loss share agreement and are presented separately on the Consolidated Balance Sheets.
Credit quality indicators—The Company has adopted an internal risk rating policy in which each loan is rated for credit quality with a numerical rating of 1 through 8. Loans rated 5 and better (1-5 ratings, inclusive) are credits that exhibit acceptable financial performance, cash flow, and leverage. If any risk exists, we attempt to mitigate by structure, collateral, monitoring, or other meaningful controls. Credits rated 6 are considered special mention as these credits demonstrate potential weakness and that if left unresolved, may result in deterioration in the Company’s credit position and/or the repayment prospects for the credit. Borrowers rated special mention may exhibit adverse operating trends, high leverage, tight liquidity or other credit concerns. Potential problem loans have a risk rating of 7 and are considered inadequately protected by the current net worth and paying capacity of the obligor, the collateral pledged, or guarantors. These loans generally have a well defined weakness or weaknesses that may jeopardize liquidation of the debt and are characterized by the distinct possibility that the Company will sustain some loss if the deficiencies are not resolved. Nonperforming loans include nonaccrual loans risk rated 7 or 8 and have all the weaknesses inherent in a 7-rated potential problem loan with the added characteristic that the weaknesses make collection or liquidation in full, on the basis of currently existing facts, conditions and values, highly questionable and improbable. Special mention, potential problem and nonperforming loans are reviewed at minimum on a quarterly basis, while all other rated credits are reviewed as the situation warrants.
Credit valuation adjustment (“CVA”)—An adjustment may need to be incorporated into the valuation of derivative instruments for nonperformance risk to include the counterparty’s credit risk and the Company’s own credit risk. This adjustment is referred to as the CVA. The CVA represents the credit component of fair value with regard to both client-based trades and the related matched trades with interbank dealer counterparties.
Efficiency ratio—Total non-interest expense divided by the sum of net interest income on a tax equivalent basis and non-interest income. This is a non-U.S. GAAP financial measure.
Fee revenue as percent of total revenue ratio—Total non-interest income less net securities gains (losses) divided by the sum of net interest income and non-interest income less net securities gains (losses).
U.S. GAAP—Accounting principles generally accepted in the United States of America.
Net interest margin—Expressed as a percentage, net interest margin is a ratio computed as annualized taxable-equivalent net interest income divided by average interest-earning assets. The annualization of net interest income for the quarterly yield takes into consideration the interest payment convention at the product level. This is a non-U.S. GAAP financial measure.
Net interest spread—The difference between the average yield earned on interest-earning assets on a taxable-equivalent basis and the average rate paid for interest-bearing liabilities.
Net overhead ratio—Total non-interest expense less non-interest income divided by average total assets.
Net revenue—The sum of taxable equivalent net interest income and non-interest income. This is a non-U.S. GAAP financial measure.
Non-U.S. GAAP—Certain financial measures within this document that are not formally defined by U.S. GAAP or codified in the federal banking regulations. A reconciliation of these non-U.S. GAAP financial measures may be found on the previous pages.
Operating profit—The sum of U.S. GAAP income before income taxes, provision for loan and covered loan losses and taxable-equivalent adjustment. This is a non-U.S. GAAP financial measure.
Risk-weighted assets—Computed by the assignment of specific risk-weights (as defined by the Board of Governors of the Federal Reserve System) to assets and off-balance sheet instruments.
Tangible book value—Total common equity less goodwill and other intangibles divided by outstanding shares of common stock at end of period. This is a non-U.S. GAAP financial measure.
Tangible common equity to tangible assets ratio—Tangible common equity divided by tangible assets, where tangible common equity equals total equity less preferred stock, goodwill and other intangible assets and tangible assets equals total assets less goodwill and other intangible assets. This is a non-U.S. GAAP financial measure.
Glossary of Terms (continued)
Taxable-equivalent interest income—The interest income earned on certain assets is completely or partially exempt from Federal income tax. As such, these tax-exempt instruments typically yield lower returns than taxable investments. To provide more meaningful comparisons of yields and margins for all interest-earning assets, we use interest income on a taxable-equivalent basis in calculating average yields and net interest margins by increasing the interest income earned on tax-exempt assets to make it fully equivalent to interest income earned on other taxable investments. This adjustment is not permitted under U.S. GAAP on the Consolidated Income Statement.
Tier 1 common capital—Tier 1 risk-based capital, less preferred equity, less trust preferred capital securities, and less noncontrolling interests.
Tier 1 common capital ratio—Tier 1 common capital divided by period-end risk-weighted assets. This is a non-U.S. GAAP financial measure.
Tier 1 risk-based capital—Total equity, plus trust preferred capital securities, plus certain noncontrolling interests that are held by others; less goodwill and certain other intangible assets, less equity investments in nonfinancial companies, less ineligible servicing assets, less disallowed deferred tax assets and less net unrealized holding gains (losses) on available for sale equity securities, available for sale debt securities, and cash flow hedge derivatives.
Tier 1 risk-based capital ratio—Tier 1 risk-based capital divided by period-end risk-weighted assets.
Leverage ratio—Tier 1 risk-based capital divided by adjusted average total assets.
Total risk-based capital—Tier 1 risk-based capital plus qualifying subordinated debt, other noncontrolling interest not qualified as Tier 1, eligible gains on available-for-sale equity securities and the allowance for loan and lease losses, subject to certain limitations.
Total risk-based capital ratio—Total risk-based capital divided by period-end risk-weighted assets.
Transformational and legacy portfolios—We aggregate loans by originating line of business for reserve purposes because of observable similarities in the performance experience of loans underwritten by the business units. Loans originated by the business units that existed prior to the strategic changes in 2007 are considered “legacy” loans. Loans originated by a business unit that was established in connection with or following the business transformation plan are considered “transformational” loans. Renewals or restructurings of legacy loans may continue to be evaluated as legacy loans depending on the structure or defining characteristics of the new transaction. The Company has implemented a line of business model that has reorganized the legacy business units so that after 2009, all new loan originations are considered transformational.