Attached files
| file | filename |
|---|---|
| 8-K - FORM 8-K - TOYOTA MOTOR CREDIT CORP | dp31628_8k.htm |
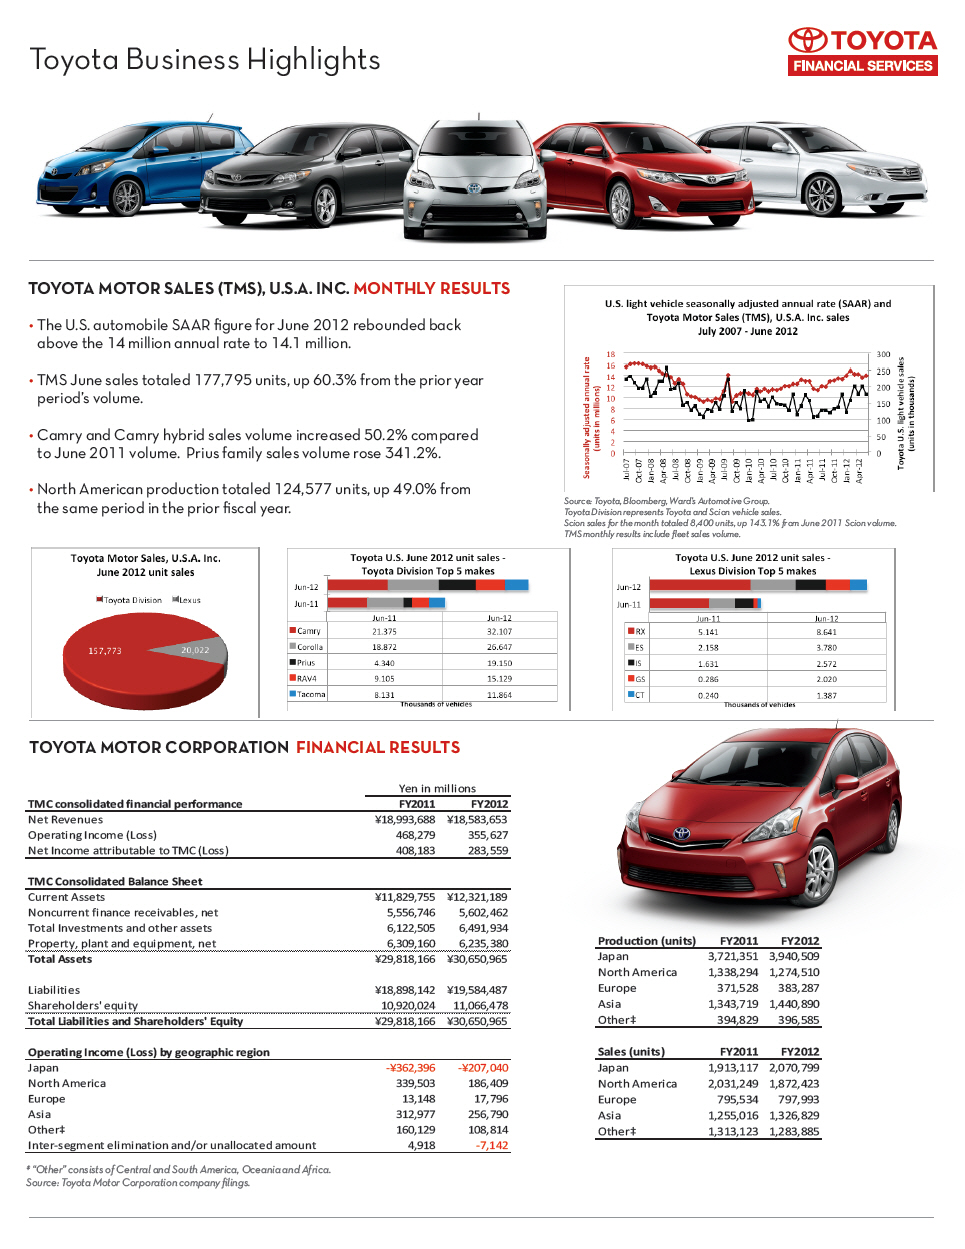 |
Toyota Business Highlights

TOYOTA MOTOR SALES (TMS), U.S.A. INC. MONTHLY RESULTS

[] The U.S. automobile SAAR figure for June 2012 rebounded back above the 14
million annual rate to 14.1 million.

[] TMS June sales totaled 177,795 units, up 60.3% from the prior year period's
volume.

[] Camry and Camry hybrid sales volume increased 50.2% compared to June 2011
volume. Prius family sales volume rose 341.2% .

[] North American production totaled 124,577 units, up 49.0% from the same
period in the prior fiscal year.


[GRAPHIC OMITTED]

[GRAPHIC OMITTED]

TOYOTA MOTOR CORPORATION FINANCIAL RESULTS


                                                                Yen in millions
                                                            =================================
TMC consolidated financial performance                        FY2011           FY2012
=========================================================== ================ ================
Net Revenues                                                 18,993,688       18,583,653
Operating Income (Loss)                                         468,279          355,627
Net Income attributable to TMC (Loss)                           408,183          283,559
=========================================================== ================ ================
TMC Consolidated Balance Sheet
=========================================================== ================ ================
Current Assets                                               11,829,755       12,321,189
Noncurrent finance receivables, net                           5,556,746        5,602,462
Total Investments and other assets                            6,122,505        6,491,934
Property, plant and equipment, net                            6,309,160        6,235,380
=========================================================== ================ ================
Total Assets                                                 29,818,166       30,650,965
Liabilities                                                  18,898,142       19,584,487
Shareholders' equity                                         10,920,024       11,066,478
=========================================================== ================ ================
Total Liabilities and Shareholders' Equity                   29,818,166       30,650,965
=========================================================== ================ ================
Operating Income (Loss) by geographic region
=========================================================== ================ ================
Japan                                                          -362,396         -207,040
North America                                                   339,503          186,409
Europe                                                           13,148           17,796
Asia                                                            312,977          256,790
Other[]                                                         160,129          108,814
Inter-segment elimination and/or unallocated amount               4,918           -7,142
=========================================================== ================ ================

* "Other" consists of Central and South America, Oceania and Africa.
Source: Toyota Motor Corporation company filings.


[GRAPHIC OMITTED]

[GRAPHIC OMITTED]


Production    (units)   FY2011    FY2012
====================== ========= =========
Japan                  3,721,351 3,940,509
North America          1,338,294 1,274,510
Europe                   371,528   383,287
Asia                   1,343,719 1,440,890
Other[]                  394,829   396,585
====================== ========= =========
Sales     (units)        FY2011    FY2012
====================== ========= =========
Japan                  1,913,117 2,070,799
North     America      2,031,249 1,872,423
Europe                   795,534   797,993
Asia                   1,255,016 1,326,829
Other[]                1,313,123 1,283,885
====================== ========= =========
|
 |
TOYOTA MOTOR CREDIT CORPORATION FINANCIAL RESULTS


[] Operating results declined from fiscal 2011 primarily due to decreases in
total financing revenue, partially offset by declines in interest expense and
operating and administrative expenses.

[] Lower volume and market share were driven primarily by decreased supply of
new Toyota and Lexus vehicles and lower level of TMS subvention programs.

[] The overall credit quality of our consumer portfolio in fiscal 2012
continued to benefit from our focus on purchasing practices and collection
efforts.

[] Strength in used vehicle values also contributed to the portfolio's strong
performance.


[GRAPHIC OMITTED]

[GRAPHIC OMITTED]

(1)TFS market share represents the percentage of total domestic TMS sales of
new Toyota and Lexus vehicles financed by us, excluding non-Toyota/Lexus sales,
sales under dealer rental car and commercial fleet programs and sales of a
private Toyota distributor.


TMCC LIQUIDITY and CAPITAL RESOURCES

[] TMCC maintains direct relationships with institutional commercial paper
investors through its Sales and Trading team, awarding TMCC access to a variety
of domestic and global markets.

[] TMCC's financial liabilities composition is provided in the adjacent chart.
For the past fiscal year, commercial paper across all programs ranged from
approximately $16.1 billion to $21.7 billion with an average outstanding
balance of $19.0 billion. As of March 31, 2012, commercial paper had an average
remaining maturity of 82 days.

[] Commercial Paper is issued direct under three, distinct 3(a)(3) programs:
Toyota Motor Credit Corp, Toyota Credit de Puerto Rico, and Toyota Credit
Canada Inc.


[GRAPHIC OMITTED]

[GRAPHIC OMITTED]

MOVING FORWARD IN 2012

[]   Toyota will launch 19 new or updated models this year, including 7 from
     Toyota, 9 from Lexus and 3 from Scion

[]   Continued industry leader in power-train, safety and production with the
     most fuel-efficient line-up of any full-line OEM

[]   10 hybrid models currently sold in the U.S. with a 72% share of the U.S.
     hybrid market as of May 2012

[]   Toyota has recently created the Toyota in Action website highlighting the
     company's operations, innovations, community, and people across the United
     States. Please visit www.toyotainaction.com, to learn more about our U.S.
     activities and impact.

Forward looking statements are subject to risks and uncertainties that could
cause actual results to fall short of current expectations.
Toyota and its affiliates discuss these risks and uncertainties in filings they
make with the Securities and Exchange Commission.


[GRAPHIC OMITTED]

[GRAPHIC OMITTED]
|