Attached files
| file | filename |
|---|---|
| 8-K - 8-K - Solera National Bancorp, Inc. | a12-15189_28k.htm |
| EX-99.1 - EX-99.1 - Solera National Bancorp, Inc. | a12-15189_2ex99d1.htm |
Exhibit 99.2
|
|
Solera National Bancorp, Inc. 2012 Annual Meeting |
|
|
This presentation contains forward-looking statements within the meaning of the Private Securities Litigation Reform Act of 1995. The statements contained in this release, which are not historical facts and that relate to future plans or projected results of Solera National Bancorp, Inc. (“Company”) and its wholly-owned subsidiary, Solera National Bank (“Bank”), are forward-looking statements within the meaning of Section 27A of the Securities Act of 1933 and Section 21E of the Securities Exchange Act of 1934. These forward-looking statements are subject to risks and uncertainties that could cause actual results to differ materially from those projected, anticipated or implied. These risks and uncertainties can include the risks associated with the ability to grow the Bank and the services it provides, the ability to successfully integrate new business lines and expand into new markets, competition in the marketplace, general economic conditions and many other risks described in the Company’s Securities and Exchange Commission filings. The most significant of these uncertainties are described in our 2011 Annual Report on Form 10-K and Quarterly Reports on Form 10-Q all of which any reader is encouraged to study (including all amendments to those reports) and exhibits to those reports. We undertake no obligation to update or revise any forward-looking statement. Safe Harbor Statement Page 2 |
|
|
Mission and Vision Mission Solera National Bank is committed to providing exceptional value and service to our customers, shareholders, employees and the communities we serve. We are dedicated to delivering high-quality financial products and services that meet the unique needs of small to medium-sized businesses, professionals, consumers, foundations and non-profit organizations. Vision Solera National Bank strives to become a premier, independent community bank in its markets. We desire to be top of mind for banking services to the Hispanic community and other minority communities. Page 3 |
|
|
Core Values Best Employees — To attract and retain educated, motivated and qualified people who are excited to come to work and fully embrace the mission and vision of Solera National Bank. Satisfied Customers — We achieve satisfaction for our customers and earn their loyalty by adding value to each interaction. Our relationship with the client takes precedence over any transaction. Hispanic Market — To treat our Hispanic customers, prospects and friends with the same high respect and dignity afforded all. Shareholders — To build long-term shareholder value and to keep owners engaged in our business as enthusiastic supporters and referral sources for the Bank. Community — Solera National Bank is deeply rooted in its communities and we strive to provide quality banking and financial services and to assist in the financial education and integration of the unbanked and under-banked in the communities we serve. Risk Management — We maintain a strong control environment by operating within established policies and procedures. Page 4 |
|
|
Overview Solera is expanding and moving forward. Loan activity is picking up. Solera came through the recession as a very strong company. We are building on our “Community Spirit.” Best of all, quoted share price is improving. Page 5 |
|
|
Solera is Expanding and Moving Forward We are adding Residential Mortgage Lending as a major line of business in addition to Small Business Lending. This winter we launched a new residential mortgage loan product to be held in our portfolio. We intend to significantly expand this business line. Page 6 |
|
|
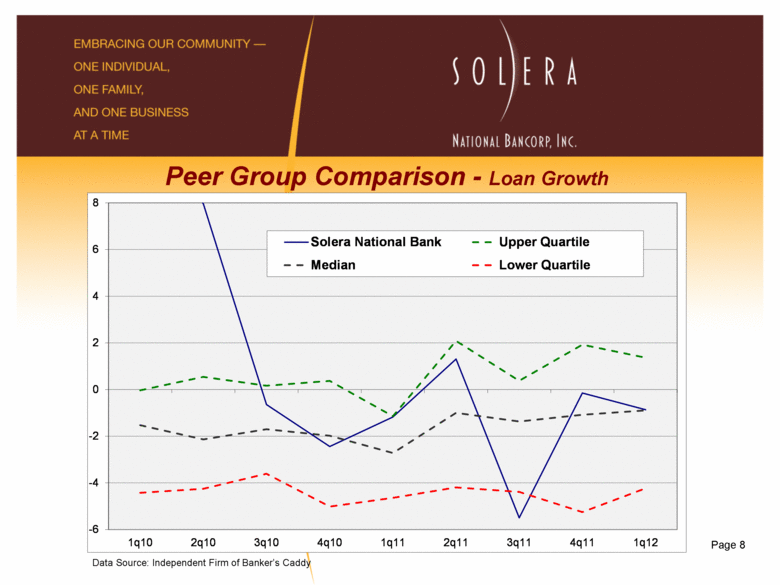
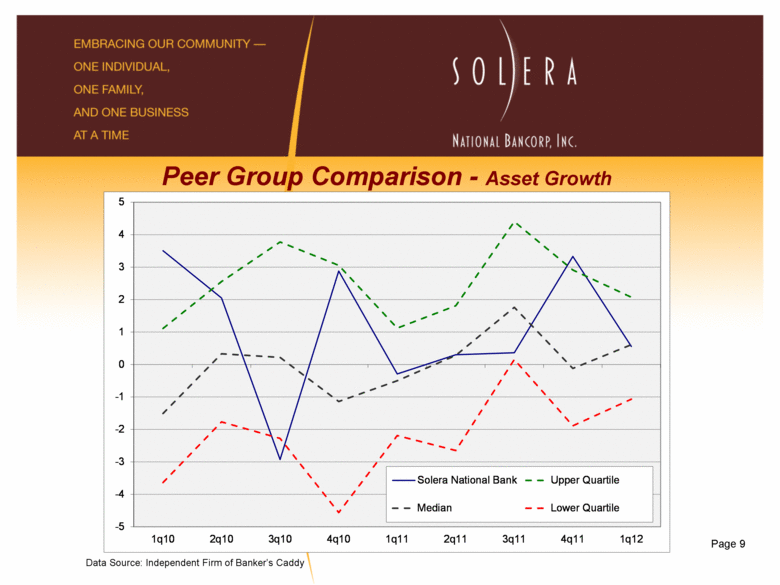
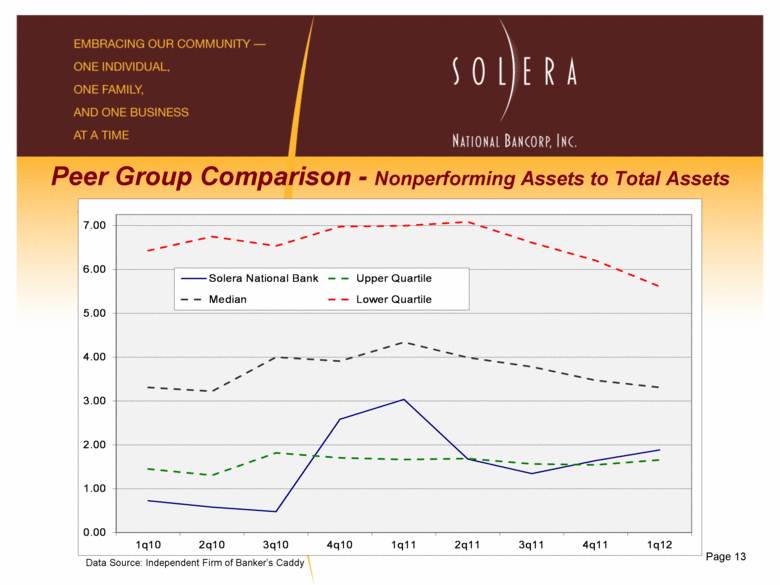
Loan Activity is Picking Up Volume of loans booked is increasing and we expect to show growth during the second quarter 2012. Booking Small Business Administration 7(a) loans for the first time this year. Loan portfolio and total asset growth has exceeded the median of our Colorado peers for four of the last five quarters. Page 7 |
|
|
Peer Group Comparison - Loan Growth Data Source: Independent Firm of Banker’s Caddy Page 8 -6 -4 -2 0 2 4 6 8 1q10 2q10 3q10 4q10 1q11 2q11 3q11 4q11 1q12 Solera National Bank Upper Quartile Median Lower Quartile |
|
|
Peer Group Comparison - Asset Growth Data Source: Independent Firm of Banker’s Caddy Page 9 -5 -4 -3 -2 -1 0 1 2 3 4 5 1q10 2q10 3q10 4q10 1q11 2q11 3q11 4q11 1q12 Solera National Bank Upper Quartile Median Lower Quartile |
|
|
Solera Remains a Very Strong Company Despite the Economic Recession Extremely well capitalized: Preserved capital without resorting to a dilutive capital raise in a severely depressed market for community bank stocks Ample liquidity Well capitalized and ample liquidity = platform for growth Asset quality vastly improved Loan portfolio is well-diversified Page 10 |
|
|
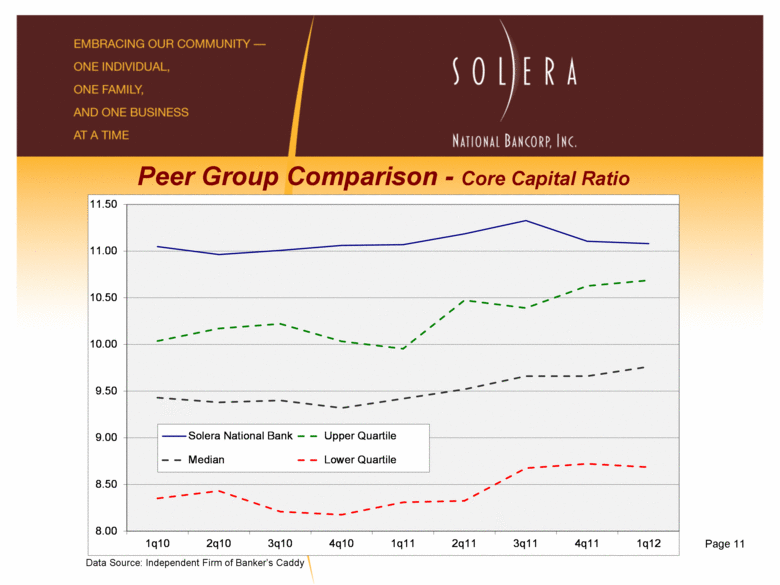
Peer Group Comparison - Core Capital Ratio Data Source: Independent Firm of Banker’s Caddy Page 11 8.00 8.50 9.00 9.50 10.00 10.50 11.00 11.50 1q10 2q10 3q10 4q10 1q11 2q11 3q11 4q11 1q12 Solera National Bank Upper Quartile Median Lower Quartile |
|
|
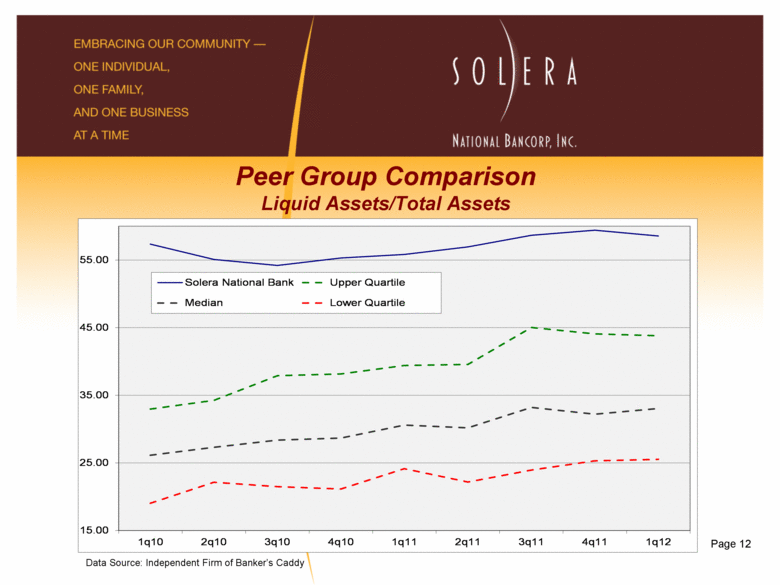
Peer Group Comparison Liquid Assets/Total Assets Data Source: Independent Firm of Banker’s Caddy Page 12 15.00 25.00 35.00 45.00 55.00 1q10 2q10 3q10 4q10 1q11 2q11 3q11 4q11 1q12 Solera National Bank Upper Quartile Median Lower Quartile |
|
|
Page 13 Peer Group Comparison - Nonperforming Assets to Total Assets Data Source: Independent Firm of Banker’s Caddy 0.00 1.00 2.00 3.00 4.00 5.00 6.00 7.00 1q10 2q10 3q10 4q10 1q11 2q11 3q11 4q11 1q12 Solera National Bank Upper Quartile Median Lower Quartile |
|
|
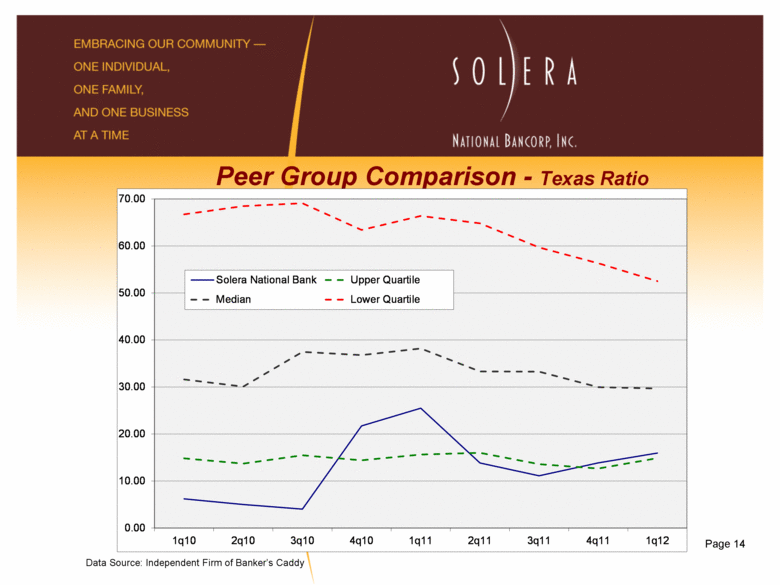
Peer Group Comparison - Texas Ratio Data Source: Independent Firm of Banker’s Caddy Page 14 0.00 10.00 20.00 30.00 40.00 50.00 60.00 70.00 1q10 2q10 3q10 4q10 1q11 2q11 3q11 4q11 1q12 Solera National Bank Upper Quartile Median Lower Quartile |
|
|
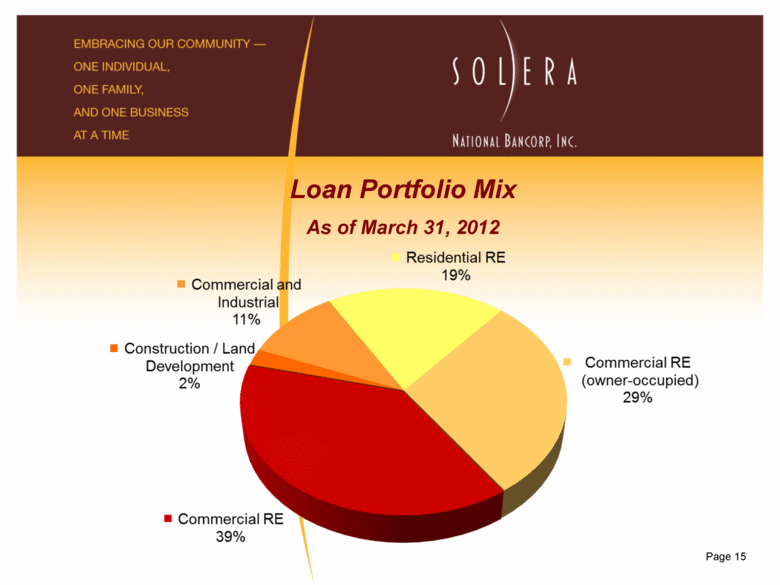
Page 15 Loan Portfolio Mix As of March 31, 2012 |
|
|
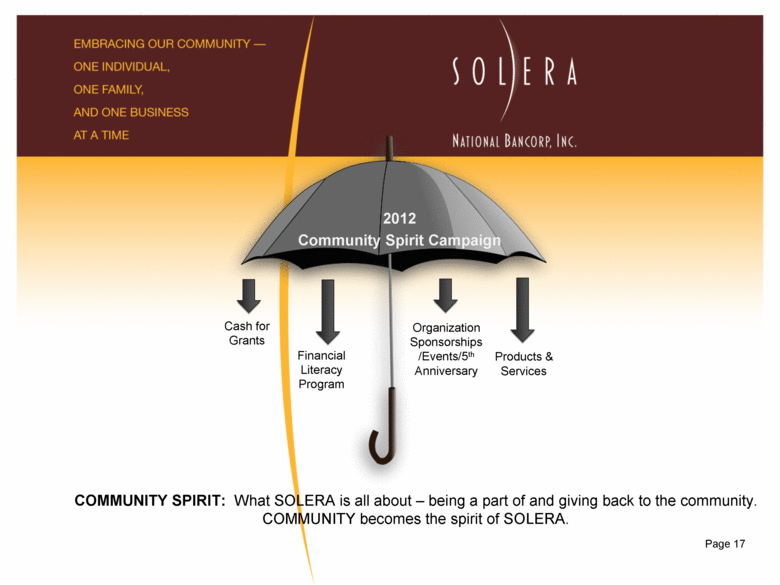
We are Building on our “Community Spirit” Launching “Community Spirit” campaign in July. Expands our support of non-profit community and financial literacy programs. Our social media effort, events, and sponsorships help to build community spirit. Page 16 |
|
|
2012 Community Spirit Campaign Cash for Grants Financial Literacy Program Organization Sponsorships /Events/5th Anniversary Products & Services COMMUNITY SPIRIT: What SOLERA is all about – being a part of and giving back to the community. COMMUNITY becomes the spirit of SOLERA. Page 17 |
|
|
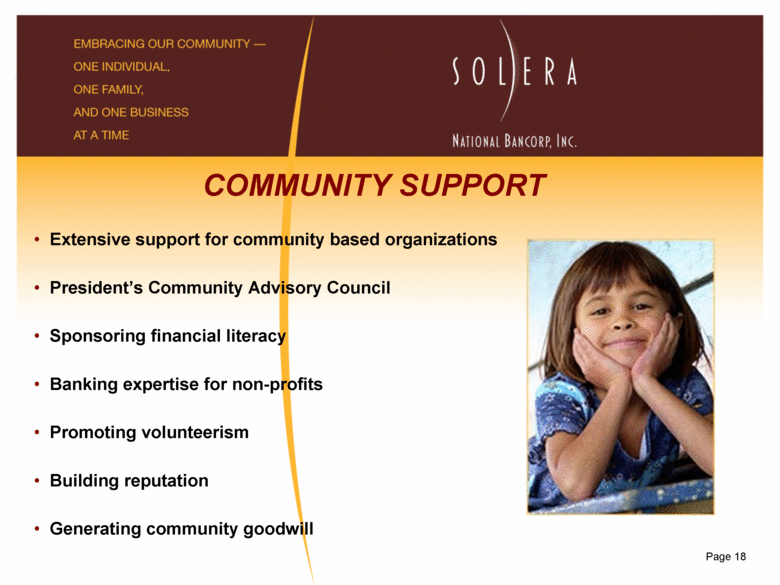
Page 18 COMMUNITY SUPPORT Extensive support for community based organizations President’s Community Advisory Council Sponsoring financial literacy Banking expertise for non-profits Promoting volunteerism Building reputation Generating community goodwill |
|
|
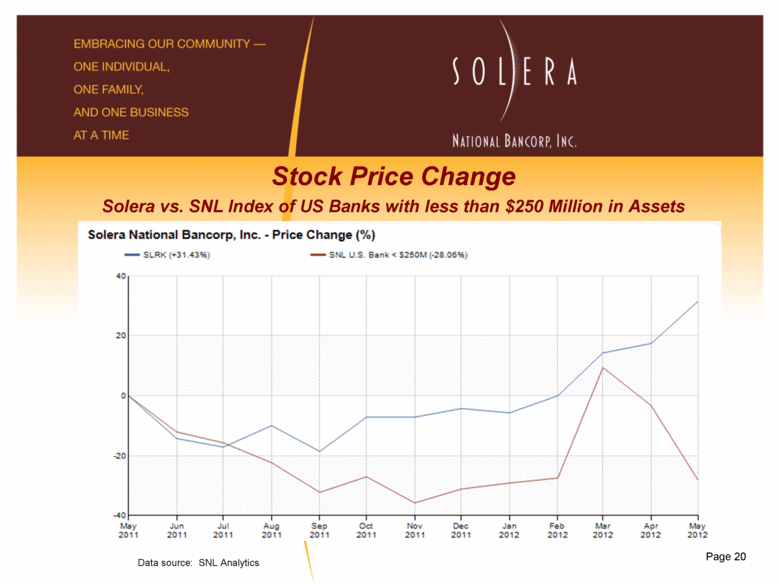
Positive Trends Board and Management took aggressive and decisive action to satisfy all elements of our Consent Order with regulators. The regulatory environment is improving and the number of consent orders being lifted is outpacing new enforcement actions. Our stock price has rebounded from a low of $2.75 per share to $4.40 per share over this past year. As depicted in the next slide, Solera’s stock price has been outperforming the average United States bank of similar size (less than $250 million in total assets) especially during April and May 2012. Page 19 |
|
|
Page 20 Stock Price Change Solera vs. SNL Index of US Banks with less than $250 Million in Assets Data source: SNL Analytics |
|
|
2011 Highlights Second consecutive full year of profitability. Total assets increased 4% to $145.4 million. Improvement in asset quality, with a $1.6 million decrease in non-performing assets. Total deposits increased 7%, with noninterest-bearing deposits growing 88% from December 31, 2010. Capital ratios well exceed regulatory requirements with total risk-based capital at 20.5%. Strong liquidity to fund future loan growth. Page 21 |
|
|
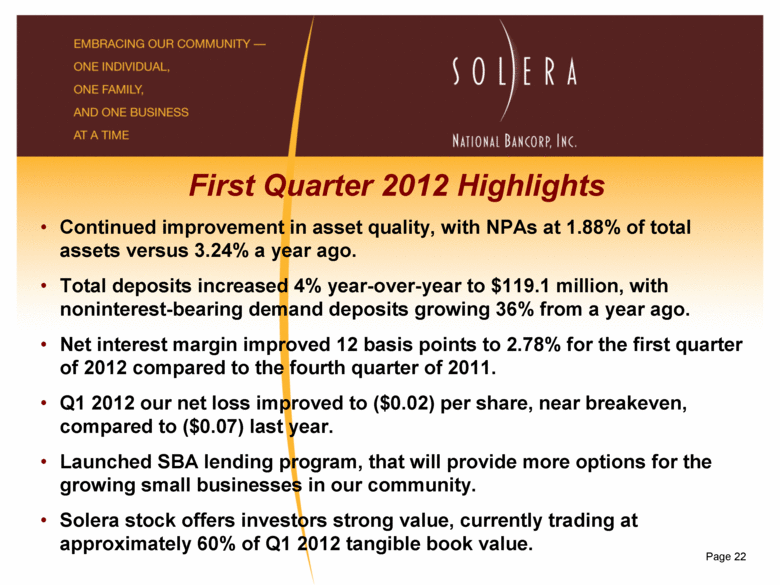
Page 22 First Quarter 2012 Highlights Continued improvement in asset quality, with NPAs at 1.88% of total assets versus 3.24% a year ago. Total deposits increased 4% year-over-year to $119.1 million, with noninterest-bearing demand deposits growing 36% from a year ago. Net interest margin improved 12 basis points to 2.78% for the first quarter of 2012 compared to the fourth quarter of 2011. Q1 2012 our net loss improved to ($0.02) per share, near breakeven, compared to ($0.07) last year. Launched SBA lending program, that will provide more options for the growing small businesses in our community. Solera stock offers investors strong value, currently trading at approximately 60% of Q1 2012 tangible book value. |
|
|
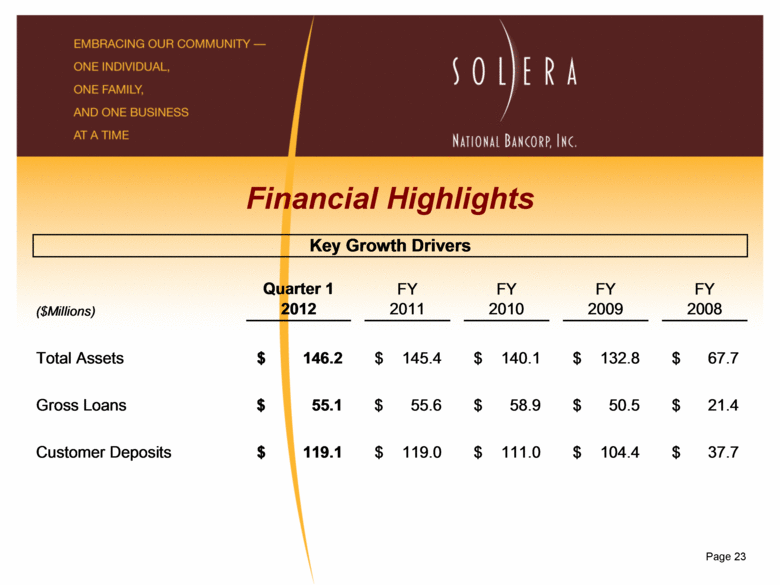
Financial Highlights Page 23 ($Millions) Quarter 1 2012 FY 2011 FY 2010 FY 2009 FY 2008 Total Assets 146.2 $ 145.4 $ 140.1 $ 132.8 $ 67.7 $ Gross Loans 55.1 $ 55.6 $ 58.9 $ 50.5 $ 21.4 $ Customer Deposits 119.1 $ 119.0 $ 111.0 $ 104.4 $ 37.7 $ Key Growth Drivers |
|
|
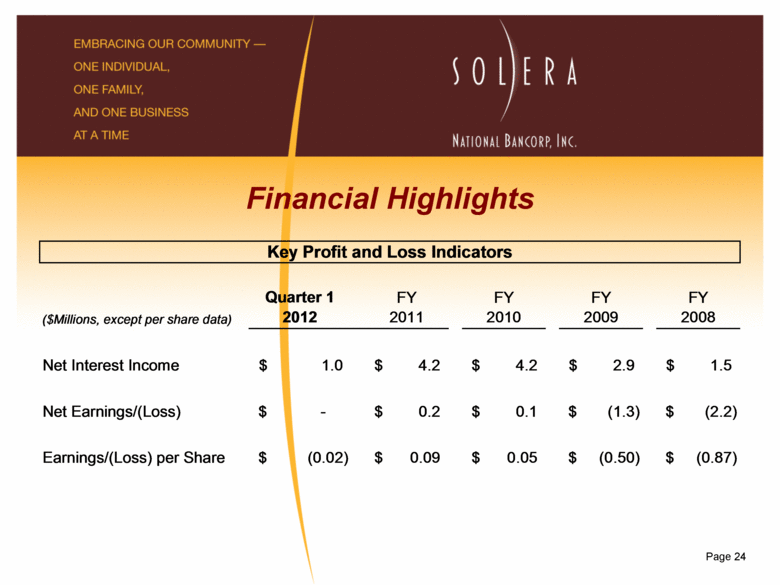
Financial Highlights Page 24 ($Millions, except per share data) Quarter 1 2012 FY 2011 FY 2010 FY 2009 FY 2008 Net Interest Income 1.0 $ 4.2 $ 4.2 $ 2.9 $ 1.5 $ Net Earnings/(Loss) - $ 0.2 $ 0.1 $ (1.3) $ (2.2) $ Earnings/(Loss) per Share (0.02) $ 0.09 $ 0.05 $ (0.50) $ (0.87) $ Key Profit and Loss Indicators |
|
|
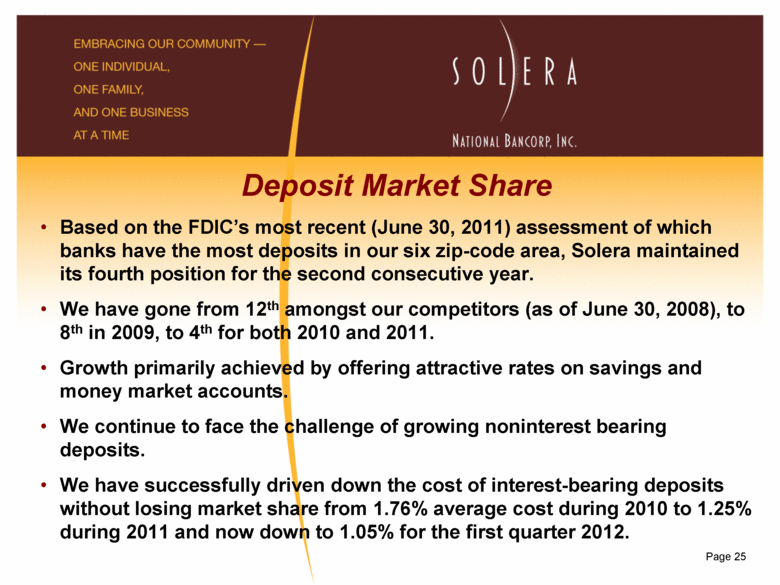
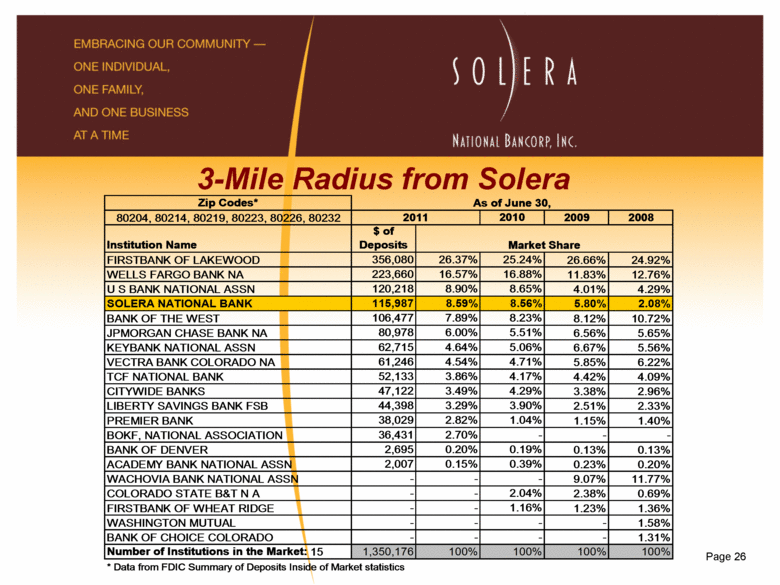
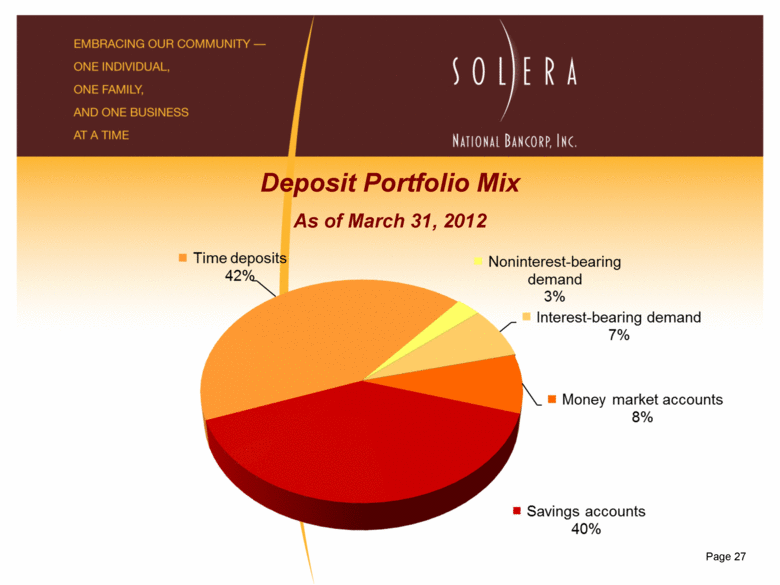
Page 25 Deposit Market Share Based on the FDIC’s most recent (June 30, 2011) assessment of which banks have the most deposits in our six zip-code area, Solera maintained its fourth position for the second consecutive year. We have gone from 12th amongst our competitors (as of June 30, 2008), to 8th in 2009, to 4th for both 2010 and 2011. Growth primarily achieved by offering attractive rates on savings and money market accounts. We continue to face the challenge of growing noninterest bearing deposits. We have successfully driven down the cost of interest-bearing deposits without losing market share from 1.76% average cost during 2010 to 1.25% during 2011 and now down to 1.05% for the first quarter 2012. |
|
|
Page 26 3-Mile Radius from Solera Zip Codes* 80204, 80214, 80219, 80223, 80226, 80232 2010 2009 2008 Institution Name $ of Deposits FIRSTBANK OF LAKEWOOD 356,080 26.37% 25.24% 26.66% 24.92% WELLS FARGO BANK NA 223,660 16.57% 16.88% 11.83% 12.76% U S BANK NATIONAL ASSN 120,218 8.90% 8.65% 4.01% 4.29% SOLERA NATIONAL BANK 115,987 8.59% 8.56% 5.80% 2.08% BANK OF THE WEST 106,477 7.89% 8.23% 8.12% 10.72% JPMORGAN CHASE BANK NA 80,978 6.00% 5.51% 6.56% 5.65% KEYBANK NATIONAL ASSN 62,715 4.64% 5.06% 6.67% 5.56% VECTRA BANK COLORADO NA 61,246 4.54% 4.71% 5.85% 6.22% TCF NATIONAL BANK 52,133 3.86% 4.17% 4.42% 4.09% CITYWIDE BANKS 47,122 3.49% 4.29% 3.38% 2.96% LIBERTY SAVINGS BANK FSB 44,398 3.29% 3.90% 2.51% 2.33% PREMIER BANK 38,029 2.82% 1.04% 1.15% 1.40% BOKF, NATIONAL ASSOCIATION 36,431 2.70% - - - BANK OF DENVER 2,695 0.20% 0.19% 0.13% 0.13% ACADEMY BANK NATIONAL ASSN 2,007 0.15% 0.39% 0.23% 0.20% WACHOVIA BANK NATIONAL ASSN - - - 9.07% 11.77% COLORADO STATE B&T N A - - 2.04% 2.38% 0.69% FIRSTBANK OF WHEAT RIDGE - - 1.16% 1.23% 1.36% WASHINGTON MUTUAL - - - - 1.58% BANK OF CHOICE COLORADO - - - - 1.31% Number of Institutions in the Market: 15 1,350,176 100% 100% 100% 100% * Data from FDIC Summary of Deposits Inside of Market statistics 2011 As of June 30, Market Share |
|
|
Page 27 Deposit Portfolio Mix As of March 31, 2012 |
|
|
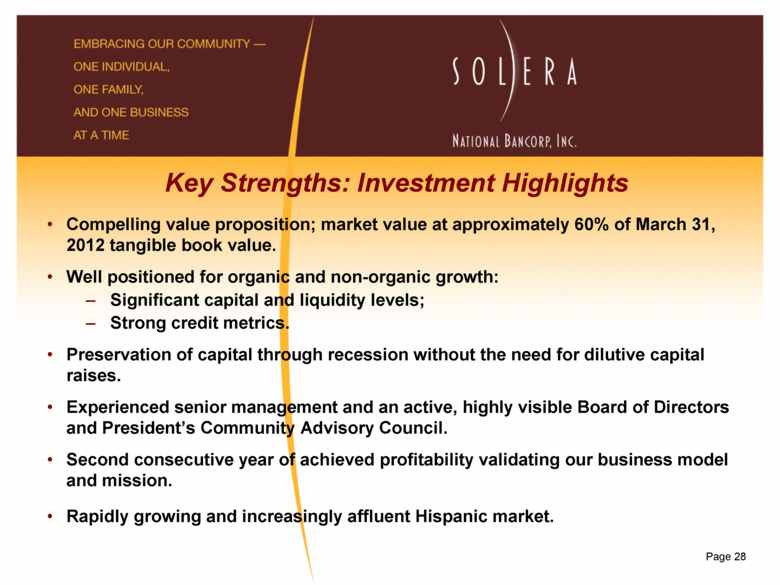
Page 28 Key Strengths: Investment Highlights Compelling value proposition; market value at approximately 60% of March 31, 2012 tangible book value. Well positioned for organic and non-organic growth: Significant capital and liquidity levels; Strong credit metrics. Preservation of capital through recession without the need for dilutive capital raises. Experienced senior management and an active, highly visible Board of Directors and President’s Community Advisory Council. Second consecutive year of achieved profitability validating our business model and mission. Rapidly growing and increasingly affluent Hispanic market. |
|
|
Page 29 The Light of a New Banking Era® Thank you for your time and interest! |

