Attached files
| file | filename |
|---|---|
| 8-K - FORM 8-K - P F CHANGS CHINA BISTRO INC | d368727d8k.htm |
Exhibit 99.1
SUMMARY
The following summary highlights some of the information in this offering memorandum and does not contain all of the information that may be important to you. Before deciding to invest in the notes, you should read the entire offering memorandum carefully, including the historical consolidated financial statements and the related notes contained elsewhere in this offering memorandum. Investing in the notes involves significant risks, as described in the “Risk Factors” section. This offering memorandum contains forward-looking statements that involve risks and uncertainties. Our actual results may differ based on certain factors, including those set forth in “Risk Factors” and “Cautionary Note Regarding Forward-Looking Statements.”
In this offering memorandum, unless otherwise indicated or the context otherwise requires, references to the terms “the Company,” “our company,” “we,” “us,” “our,” or “P.F. Chang’s” refer to P.F. Chang’s China Bistro, Inc. and its direct and indirect subsidiaries. Additionally, references to “Bistro” refer to P.F. Chang’s China Bistro and references to “Pei Wei” refers to Pei Wei Asian Diner. The term “Issuer” refers only to (i) prior to the consummation of the Transactions described herein, Wok Acquisition Corp. and (ii) from and after the consummation of the Transactions, P.F. Chang’s, as the surviving corporation of the merger that will assume the obligations of the Issuer under the notes and the related indenture by operation of law. The term “Wok Holdings” refers to Wok Holdings Inc., a direct parent company of P.F. Chang’s. The term “Parent” refers to Wok Parent LLC, the direct parent company of Wok Holdings and an indirect parent company of P.F. Chang’s. Except as otherwise indicated, any references in this offering memorandum to “Centerbridge,” “the Sponsor” or “our sponsor” refer to Centerbridge Partners, L.P., its affiliates and funds or investment vehicles managed or advised by Centerbridge Partners, L.P. or its affiliates. Unless we indicate otherwise or the context otherwise requires, information identified in this offering memorandum as “pro forma” gives effect to the consummation of the Transactions, including the issuance of the notes hereby and application of net proceeds therefrom, as described under “The Transactions,” as if they had occurred, with respect to the unaudited pro forma condensed consolidated statements of income information, on January 3, 2011 and, with respect to the unaudited pro forma condensed consolidated balance sheet information, on April 1, 2012.
We operate on a 52- or 53-week fiscal year ending on the Sunday closest to December 31. Fiscal 2009, comprised of 53 weeks, ended on January 3, 2010, while fiscal 2010 and fiscal 2011, both of which comprised of 52 weeks, ended on January 2, 2011 and January 1, 2012, respectively. Our first fiscal quarter of fiscal 2011 consisted of a thirteen-week period that ended on April 3, 2011 and our first fiscal quarter of fiscal 2012 consisted of a thirteen-week period that ended on April 1, 2012. As used in this offering memorandum, the last twelve months (“LTM”) period ended April 1, 2012 refers to the 52-week period ended on April 1, 2012.
Leading Asian-Inspired Restaurant Brands
We own and operate two leading domestic Asian-inspired restaurant brands: a full-service dining concept called P.F. Chang’s China Bistro and a limited-service dining concept called Pei Wei Asian Diner. The Bistro is a polished casual restaurant concept offering consumers Chinese-inspired menu items in restaurants with unique contemporary bistro decor. The Bistro is designed to provide a full-service dining experience for couples, families, business guests and social groups. Pei Wei is a less formal fast-casual dining concept with limited table service. It offers pan-Asian dishes to consumers seeking high-quality, freshly-prepared cuisine with dine-in or take-away flexibility at lower prices and faster speed of service than offered in a full-service
1
restaurant. Through our Global Brand Development business, we have extended these brands into international markets, domestic airports and domestic retail grocery frozen food products through brand licensing agreements.
We began operations in 1993 in Scottsdale, Arizona when our co-founders, restaurateur Paul Fleming and chef Philip Chiang, opened the first Bistro restaurant. We were incorporated in 1996 and became a publicly-traded company in 1998. In 2000, we launched the Pei Wei concept to respond to what we believed to be a growing customer interest in fresh, made-to-order pan-Asian food with a less formal setting, faster speed of service, lower price points and greater take-away flexibility. In 2009, we launched our Global Brand Development business to license the Bistro and Pei Wei brands in international markets, domestic airports locations, and domestic retail grocery channels.
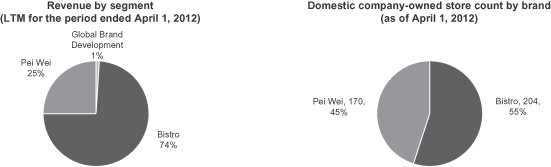
Bistro
Bistro is a full-service, polished casual restaurant concept offering consumers Chinese-inspired menu items in restaurants with unique contemporary bistro decor. Bistro caters to full-service dining experiences for couples, families, business guests and social groups. As of April 1, 2012, we owned and operated 204 domestic company-owned Bistro restaurants. Our Bistro restaurants are leased and most are located in high-traffic shopping malls and upper-end lifestyle centers. We have a nationwide footprint with restaurants in 39 states. The average check per guest at the Bistro is typically between $21 and $22. In fiscal 2011, approximately 32% of the revenues at domestic company-owned stores were generated at lunch, and approximately 68% of the revenues were generated at dinner. Bistro restaurants typically range in size from 6,000 to 7,500 square feet and require an average invested capital of approximately $2.0 million to $2.5 million per restaurant (net of landlord incentives and excluding pre-opening expenses). Average unit volume for each of the LTM period ended April 1, 2012 and fiscal 2011 was $4.6 million for our domestic company-owned Bistro locations.
Pei Wei
Pei Wei is a fast-casual dining concept with limited table service that offers pan-Asian dishes to consumers seeking high-quality, freshly-prepared cuisine with dine-in or take-away flexibility. Pei Wei offers the same spirit of hospitality and commitment to providing fresh, high-quality Asian food at a great value that has made the Bistro restaurants successful but does so in a limited service format that offers lower price points and a more casual setting. We believe the price points and speed of service fall between that of a full-service restaurant and a fast food restaurant. As of April 1, 2012, we owned and operated 170 domestic company-owned Pei Wei restaurants. Pei Wei is a more regionally-focused concept with a significant number of
2
restaurants located in Arizona, Texas, Florida, and California. Restaurants are leased and typically located in in-line or end-cap locations in strip or power centers frequently anchored by national chain retailers. The average check per guest at Pei Wei is typically between $9 and $10. In fiscal 2011, approximately 42% of the revenues at domestic company-owned stores were generated at lunch, and approximately 58% of the revenues were generated at dinner. Take-away sales typically comprise approximately 41% of total Pei Wei revenue. Pei Wei restaurants typically range in size from 2,800 to 3,400 square feet and require an average invested capital of approximately $750,000 to $850,000 per restaurant (net of landlord incentives and excluding pre-opening expenses). Average unit volume for each of the LTM period ended April 1, 2012 and fiscal 2011 was $1.8 million for our domestic company-owned Pei Wei locations.
Global Brand Development
Restaurant Licensing
We are pursuing expansion of our brands internationally through licensing arrangements with established, capable restaurant and retail operators in attractive international markets. Our licensing agreements with these international partners typically allow us to receive an initial territory fee, store opening fees and ongoing royalty revenues based on a percentage of restaurant sales. We conduct rigorous training on the execution of our brands for these international operators, provide them with considerable pre-opening support and closely monitor their execution quality to ensure our high standards are maintained in licensing arrangements. Our partners generally reimburse us for the training and support we provide.
As of April 1, 2012, there were 16 international Bistro restaurants open in Mexico, the Middle East, Puerto Rico and the Philippines. There were also two Bistro restaurants located in Hawaii which operate under a joint venture arrangement in which we own a noncontrolling interest.
In addition to pursuing Bistro licensing in international markets, we are entering licensing arrangements for the Pei Wei brand in international markets and domestic airport locations. During the fourth quarter of fiscal 2011, the first international Pei Wei opened in Mexico and the first two Pei Wei airport locations opened in John Wayne Orange County Airport and Minneapolis—St. Paul Airport.
Retail Licensing
In 2010, through an exclusive brand licensing arrangement with Unilever, we launched a premium line of P.F. Chang’s branded frozen Asian-inspired meals into numerous retail grocery outlets throughout the United States. Currently, twelve frozen Asian-style meals are available. During April 2012, five new frozen Asian-style appetizers were launched. We receive ongoing royalty revenues based on a percentage of Unilever’s product sales. Unilever is responsible for marketing and production costs. We closely collaborate with Unilever on product development.
True Food Kitchen
During 2009, we entered into an agreement with FRC Balance LLC (“FRC”), doing business as True Food Kitchen, to provide debt capital for the early-stage development of a healthy, organic and locally-sourced restaurant concept called True Food Kitchen. The agreement provides a $10.0 million loan facility, of which $7.0 million was drawn as of April 1, 2012, to develop True Food
3
Kitchen restaurants. Under certain conditions, we can convert the outstanding loan amount into a majority equity position in FRC. As of April 1, 2012, FRC was operating four True Food Kitchen restaurants. In February 2012, we and the FRC partners agreed to exercise our conversion option. We are in ongoing discussions with the FRC partners regarding the terms and the timing of the conversion. Upon completion of the conversion, we would expect to own 51% of FRC with potential rights and obligations that could enable us to increase our ownership to 90% or more in the future. See “Management’s Discussion and Analysis of Financial Condition and Results of Operations—Summary Disclosures about Contractual Obligations—Other Commitments.”
Industry Trends
The commercial restaurant industry is comprised of two main sectors, full-service and limited-service, which together account for 86% of the industry’s total revenue, according to the National Restaurant Association. The full-service sector, which includes casual and fine dining, is characterized by longer, seated dining experiences, attentive wait service and after dinner billing. According to the National Restaurant Association, in 2011, the full-service sector generated $196 billion in sales and is estimated to grow at a rate of 2.9% in 2012 to $201 billion. Given the high number of family-run Asian full-service restaurants, the Asian segment remains heavily fragmented, particularly on the full-service side. According to The NPD Group, Inc., for 2011, chains accounted for only 12% of Asian full-service restaurants compared to 21% and 19% of the Italian and Mexican full-service restaurants, respectively. In 2011, sales for the top 500 chains full-service Asian segment were $1.8 billion, an increase of 2.7% from 2010 in which sales were $1.7 billion, according to Technomic.
The limited-service sector, which includes fast-casual and quick-service restaurants, features ordering at a cash register or takeout window, payment before eating, and limited or no table service. 2012 sales for the limited-service sector are expected to grow 3.1%, from $169 billion in 2011 to $174 billion in 2012, according to the National Restaurant Association. Within the Asian limited-service segment, chain restaurant growth has been outpacing independent restaurant growth. We believe that Pei Wei is ideally situated at the intersection of two of the fastest growing segments in the overall restaurant industry: Asian cuisine and fast-casual restaurants. According to Technomic, in 2011, sales for the overall limited-service restaurant (“LSR”) industry totaled $200.9 billion, while Asian LSRs sales totaled $3.2 billion. In 2011, sales of the top 500 Asian LSR chains grew by 5.5%. Mintel forecasts that the fast-casual segment will grow between 5% to 6% per year from 2011 through 2014.
A Strong, Competitively Well-Positioned Company
Premier Restaurant Brands. Both Bistro and Pei Wei are well-recognized and well-regarded brands in the restaurant industry. The Bistro brand was ranked as the Most Popular Full Service Restaurant in both 2011 and 2010 by Zagat, a U.S. restaurant guide with a large following, and “Highest Rated” full-service varied menu restaurant chain by Nation’s Restaurant News in 2011. According to consumers polled through customer surveys, Bistro’s brand awareness is over 50% greater than the median of a broad casual dining brand peer group, and its brand awareness is comparable to casual dining concepts with considerably larger footprints that spend significantly more on advertising. The same customer surveys found that Bistro and Pei Wei earn industry-leading brand loyalty scores from their respective customers that were over 30% and 50% higher, respectively, than the median of their respective peers.
4
Category Leading, Differentiated Concepts. We have built our Bistro brand into the leading Asian full-service restaurant chain in the United States. Bistro is approximately three times larger, by revenue, than its largest Asian full-service competitor. Within the fragmented Asian category, Bistro is the only nationwide full-service restaurant chain focused on Chinese-inspired cuisine. Like Bistro, we believe Pei Wei leads its category as the largest Asian-inspired fast-casual restaurant chain in the United States.
Diversified National Footprint of Well-Maintained Restaurants in Attractive Real Estate Sites. We have grown to 374 domestic company-owned restaurants, and our Bistro and Pei Wei restaurants are spread across 39 states in the continental United States. We have a disciplined policy of regularly maintaining and, with appropriate frequency, renovating our restaurants. Historically, we have made consistent and steady capital expenditures on the upkeep of our restaurant base. Customer surveys suggest Bistro and Pei Wei are among the leaders in their respective casual dining and fast-casual dining peer groups in consumer perceptions of restaurant maintenance. Most Bistro restaurants are located in high-traffic shopping malls and upper-end lifestyle centers that garner consumer traffic, and landlords often actively seek out the Bistro as a tenant for those centers. Pei Wei restaurants, on the other hand, are typically located in in-line or end-cap locations in strip or power centers frequently anchored by national chain retailers.
Stable Profitability and Strong Operating Cash Flows. The diversity of our restaurant footprint, coupled with our strong brands, have resulted in durable sales performance, as evidenced by our consistent revenues during the recent challenging recessionary environment. From 2009 to 2011, we were also successful in maintaining Adjusted EBITDA margins in the range of 10.5% to 12.0% during the same period. Our well-maintained restaurants have substantial average unit volumes, but modest ongoing maintenance and remodel capital expenditure requirements, which represented between 1.9% and 2.0% of revenues from 2009 to 2011. Our stable profitability and manageable capital expenditure requirements have resulted in strong operating cash flow. From 2009 to 2011, net cash provided by operating activities averaged $128 million per year, of which $177 million, in the aggregate, was returned to shareholders in the form of dividends and share buybacks.
Attractive and Improving Industry Fundamentals. We expect to benefit from improving restaurant industry fundamentals. Following a challenging recessionary period, the restaurant industry is growing again. Total industry sales increased 4.0% to $610 billion in 2011 from $587 billion in 2010 and are projected to grow by an additional 3.5% in 2012, according to the National Restaurant Association. We believe our Pei Wei brand is particularly well-positioned, sitting in two of the fastest-growing segments of the restaurant industry: fast-casual and Asian. According to Technomic, U.S. fast-casual chain restaurant sales of the top 500 chains grew 8.6% from 2010 to 2011, while quick-service chain restaurant sales and full-service chain restaurant sales grew 3.1% and 2.8%, respectively. The U.S. Asian LSR segment of the top 500 chains grew 5.5% during the same period. According to Mintel, sales at fast-casual restaurants are estimated to grow between 5% to 6% per year from 2011 through 2014.
Proven Management Team. We have a seasoned executive team with extensive experience in restaurant and retail operations and management. Richard Federico, our Chairman and Chief Executive Officer, and President of the Bistro brand, joined the Company in 1996 when there were four Bistro restaurants and has led the growth of Bistro to 204 restaurants and the subsequent launch and growth of Pei Wei. He is surrounded by a strong executive team with an average of 19 years of experience in the restaurant and retail industries.
5
Our Business Strategy
We believe there are significant opportunities to further strengthen our business, enhance our profitability and execute disciplined growth.
Continue to Offer High Quality Food with Excellent Customer Service. We are dedicated to maintaining the quality and consistency of the dining experience at each of our restaurants to generate frequent customer visits and further enhance customer loyalty. We use high quality ingredients, optimal cooking methods and carefully-tested new menu items to maintain and improve the guest experience. We employ a rigorous quality assurance process utilizing field as well as home office research and development personnel that conduct in-restaurant and vendor inspections on a regular basis.
Grow Same Store Sales Through Low-Cost Innovations that Improve the Consumer Experience. Based on consumer research, our management team has been implementing new programs over the past several quarters to improve customer traffic and same store sales. These initiatives include a new lunch program at Bistro, with a simplified one page menu containing classic Bistro menu favorites in lunch size portions with soup or salad at prices more appropriate for lunch (20 items under $10.00). At Bistro, we are working to continue to update the menu to include a greater variety of pan-Asian items beyond our core Chinese offerings to expand the flavor palette available to our guests. Additionally, we launched a new Warrior Card Loyalty Program, which rewards member customers with offers for use on a future visit. We have also introduced a Diner Selects menu option at Pei Wei, with moderated portions at lower price points more suitable for lunch or for individual diners. In the first fiscal quarter of 2012, we saw sequential improvement over the previous quarter in our Bistro same store sales relative to the casual dining industry’s Knapp-Track index and expect to see continued improvement from the previously mentioned initiatives, many of which launched in the second fiscal quarter of 2012.
Improve our Store-Level Operating Margins. In 2011, our store-level operating margins compressed due to higher hourly labor costs incurred because of temporary workforce issues and a temporary revision to the Bistro labor staffing model, and challenging same store sales results. We are undertaking efforts to restore our store-level operating profitability through stabilization of same store sales, labor management efforts, strategic sourcing initiatives to improve food costs through more competitive supply dynamics and various other operational efficiencies. Actions recently taken by management with respect to strategic sourcing initiatives are expected to result in annualized savings of approximately $9.1 million. We believe all of our margin restoration plans will have a neutral to positive impact on the guest experience.
Grow our Royalty Stream from Restaurant Licensing and Retail Licensing. We intend to continue to execute on a significant opportunity to extend our brands into international markets, domestic airports and the retail grocery channel. Our licensing partners in these markets are reputable, experienced and leading global companies, including for example, Alsea in Latin America, M.H. Alshaya in the Middle East, HMSHost in some domestic airports and Unilever in branded retail grocery frozen foods. All of the licensing arrangements in our Global Brand Development business generate high-margin royalty streams and do not require us to put capital at risk. Our small, dedicated team overseeing our Global Brand Development business will continue to work closely with these partners to execute on the substantial pipeline of international Bistro and Pei Wei restaurant locations, to build a presence in domestic airports and to grow the retail grocery frozen food offerings under the P.F. Chang’s brand.
6
Maintain a Strong Balance Sheet and Reduce Debt. We are committed to maintaining a sound capital structure, keeping healthy liquidity and using our cash flow to reduce our outstanding debt. Our aggregate capital expenditures required to maintain and routinely remodel our existing restaurant base, which ranged between 1.9% and 2.0% of revenues from 2009 to 2011, support our strong operating cash flow generation. Our objective is to use the cash flow we generate to reduce leverage and pursue disciplined domestic restaurant unit growth.
Disciplined Investment in New Pei Wei Restaurants. Our restaurant concepts have attractive unit economics. We believe there is an opportunity to expand the footprint of Pei Wei, and we plan to employ a disciplined, high confidence “in-fill” unit expansion strategy to more fully penetrate regional markets in which we already have a strong presence. We will also closely monitor the performance of new domestic restaurants and adjust future expansion plans accordingly. We generally require approximately six months of lead time to adjust restaurant development plans which allows us to react quickly to changes in the external environment. Bistro is now a relatively mature restaurant concept, and we expect to open a limited number of new units each year when real estate sites of appropriate quality become available.
Recent Developments
Over the last few months, we have continued our efforts to improve our store-level operating profitability through the stabilization of same store sales, labor management efforts, a strategic sourcing initiative to improve food costs through more competitive supply dynamics and various other operational efficiencies. Actions recently undertaken by management with respect to strategic sourcing initiatives are expected to result in annualized savings of approximately $9.1 million. This reflects sourcing improvements in various food items and selected supplies.
Additionally, in the first fiscal quarter of 2012, we experienced sequential improvement over the previous quarter in our Bistro same store sales relative to the casual dining industry’s Knapp-Track index and expect to see continued improvement from initiatives (many of which launched in the second fiscal quarter of 2012) such as a new lunch program at Bistro, an update of the menu at Bistro for greater variety of pan-Asian items, the launch of a new Warrior Card Loyalty Program and the introduction of a Diner Selects menu option at Pei Wei.
The Transactions
On May 1, 2012, we entered into a merger agreement pursuant to which the Issuer will, subject to certain terms and conditions referred to below, merge with and into the Company, with the Company continuing as the surviving corporation and an indirect wholly-owned subsidiary of Parent and assuming the obligations of the Issuer under the notes and the related indenture by operation of law (the “Acquisition”).
In accordance with the terms of the merger agreement, the Issuer has commenced a tender offer (the “Offer”) to acquire all of our outstanding shares of common stock, $0.001 par value per share, at a cash purchase price of $51.50 per share, net to the holder in cash, without interest thereon and less any required withholding of taxes. As a condition, among others, to the closing of the Offer, at least 83% of our common stock must be validly tendered and not validly withdrawn prior to the expiration of the Offer. The Offer was initially scheduled to expire at 12:00 midnight (New York City time) on June 12, 2012, but was extended on June 8, 2012 to
7
5:00 pm (New York City time) on June 20, 2012. The Offer may be extended further by the Issuer under certain circumstances. We have certain termination rights as more fully described in the merger agreement and the section in this offering memorandum entitled “The Transactions.”
We have granted to the Issuer an irrevocable right (the “Top-Up Option”), which the Issuer shall exercise immediately following consummation of the Offer, if necessary, to purchase from us the number of shares that, when added to the shares already owned by Parent or any of its subsidiaries following consummation of the Offer, constitutes at least 90% of the then outstanding shares, which will allow the Issuer to complete the Acquisition through the “short-form” procedures available under Delaware law. The closing of the merger will be consummated immediately following the successful closing of the Offer and exercise of the Top-Up Option (if necessary), subject to certain closing conditions.
The merger agreement provides that the closing of the merger will be consummated immediately following the successful closing of the Offer and exercise of the Top-Up Option (if necessary), subject to certain closing conditions. In the event that the Offer has not been consummated, and in certain other circumstances, the Issuer, Parent and the Company have agreed to complete the Acquisition through a one-step merger, whereby the Acquisition may only be consummated after our stockholders have adopted the merger agreement at a meeting of its stockholders and the satisfaction of certain other closing conditions.
As a result of the merger, each outstanding share of our common stock (other than certain shares of our common stock) will be converted into the right to receive cash in an amount equal to the offer price, without interest thereon and less any required withholding of taxes.
Prior to or substantially concurrently with the consummation of the Acquisition, we will restructure our equity ownership in Pei Wei, pursuant to which each of Pei Wei and its wholly-owned corporate subsidiaries will be converted into a limited liability company, and the equity we hold in the newly-converted Pei Wei LLC will each be recapitalized into participating preferred units. Concurrent with the recapitalization, new Pei Wei LLC will issue all of its common units to Parent in exchange for cash. After the restructuring, Pei Wei LLC will be an indirect wholly-owned subsidiary of Parent. We refer to these transactions and the related transactions as the “restructuring transactions.”
We refer to the Acquisition and the related transactions, including the offer and sale of notes offered hereby, the Offer, the merger, the restructuring transactions, the borrowings under our Senior Credit Facilities and the equity investments that form a portion of the consideration for the Acquisition as the “Transactions.”
Upon consummation of the Transactions, all of our issued and outstanding capital stock will be held indirectly by Parent, and the Sponsor will indirectly control us through their ownership of Parent.
For a more complete description of the Transactions, see “The Transactions.”
8
Our Corporate Structure
Following consummation of the Transactions, our corporate structure will be as follows:
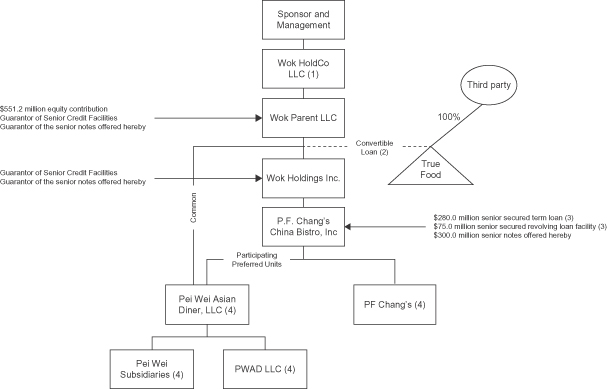
| (1) | Wok HoldCo LLC may become a guarantor of the Senior Credit Facilities on or after the closing of this offering. |
| (2) | As of April 1, 2012, represents a $7.0 million convertible loan to FRC held by Parent. Under certain conditions, we can convert the outstanding loan amount into a majority equity position in FRC. In February 2012, we and the FRC partners agreed to exercise our conversion option. We are in ongoing discussions with the FRC partners regarding the terms and the timing of the conversion. Upon conversion of the loan, we expect to own 51% of FRC with potential rights and obligations that could enable us to increase our ownership to 90% or more in the future. See “—Leading Asian-Inspired Restaurant Brands—True Food Kitchen.” |
| (3) | Our new senior credit facilities (the “Senior Credit Facilities”) will be comprised of a $280.0 million senior secured term loan and a $75.0 million senior secured revolving loan facility, which we expect to be undrawn at closing. See “Description of Other Indebtedness.” |
| (4) | The wholly-owned domestic subsidiaries of Parent that guarantee the Senior Credit Facilities will guarantee the notes on the closing date. Not all of our subsidiaries will guarantee the notes offered hereby. After giving effect to the Transactions, Parent’s subsidiaries that do not guarantee the notes would have represented approximately 0.5% and 0.6% of our total revenues and Adjusted EBITDA, respectively, for fiscal 2011. In addition, these non-guarantor subsidiaries would have represented approximately less than 0.1% and 0.1% of our total assets and total liabilities, respectively, as of April 1, 2012 (excluding, in each case, intercompany amounts). See “Description of Notes—Guarantees.” |
9
Estimated Sources and Uses
The following table summarizes the estimated sources of funds and uses of funds in connection with the Transactions as if they had been completed on April 1, 2012. The actual amounts set forth in the table and in the accompanying footnotes are subject to adjustment and may differ at the time of the consummation of the Transactions depending on several factors, including the amounts available under our Senior Credit Facilities and differences from our estimation of fees and expenses and cash available at closing. You should read the following together with the information included under the headings “The Transactions” and “Unaudited Pro Forma Condensed Consolidated Financial Information” included elsewhere in this offering memorandum.
| Sources of funds (in millions) |
Uses of funds (in millions) |
|||||||||
| Senior Credit Facilities(a): |
Cash purchase of equity |
$ | 1,123.9 | |||||||
| Senior secured term loan(b) |
$ | 280.0 | Transaction fees and expenses(f) |
58.0 | ||||||
| Senior secured revolving loan facility(c) |
— | |||||||||
| Notes offered hereby(b) |
300.0 | |||||||||
| Equity contribution(d) |
551.2 | |||||||||
| Cash on hand(e) |
50.7 | |||||||||
|
|
|
|
|
|||||||
| Total sources of funds |
$ | 1,181.9 | Total uses of funds |
$ | 1,181.9 | |||||
|
|
|
|
|
|||||||
| (a) | The Senior Credit Facilities will be comprised of a $280.0 million senior secured term loan and a $75.0 million senior secured revolving loan facility, none of which is expected to be drawn at the closing date. The Senior Credit Facilities will also allow an aggregate of $75.0 million (or a greater amount if we meet certain specified financial ratios) in uncommitted incremental facilities, the availability of which will be subject to our meeting certain conditions. Under certain circumstances, we may increase the amount of borrowings under the senior secured term loan facility if necessary to fund original issue discount or upfront payments at or within a specified period of time after closing. See “Description of Other Indebtedness.” |
| (b) | Excludes potential original issue discount or upfront payments with respect to the notes offered hereby and the senior secured term loan, other than as described in footnote (c) below. |
| (c) | Amounts available under the senior secured revolving loan facility will be reduced by letters of credit utilization. We expect approximately $22.6 million of letters of credit to be outstanding on the closing date. We may further draw up to $10.0 million on the senior secured revolving loan facility at closing in certain cases to fund original issue discount or upfront payments, if any, on the senior secured term loan. If original issue discount or upfront payments on the senior secured term loan exceed $10.0 million, such excess amounts may be funded by additional borrowings under the senior secured term loan facility provided by the lenders under our Senior Credit Facilities. See “Description of Other Indebtedness.” |
| (d) | Represents cash to be invested in the capital stock of Wok HoldCo LLC by the Sponsor and certain members of management. |
| (e) | Represents a portion of $57.0 million of estimated cash and cash equivalents on the Company’s balance sheet at closing. If there is not enough cash on hand available at closing, we may draw up to $10.0 million on the senior secured revolving loan facility (to the extent permitted), increase the amount of borrowings under the senior secured term loan facility (to the extent permitted), increase the equity contribution or reduce the cash left on the balance sheet at closing to fund the shortfall. If there is additional cash available at closing, we expect the equity contribution will decrease accordingly. |
| (f) | Represents estimated fees and expenses associated with the Transactions, including commitment, placement and other financing fees, original issue discount or upfront payments, financial advisory costs and other transaction costs and professional fees. See “Certain Relationships and Related Party Transactions.” |
Our Sponsor
Centerbridge Partners, L.P., which was established in 2005 and commenced operations in 2006, is a private investment firm focused on traditional private equity and credit investing and headquartered in New York City. The firm employs over 50 investment professionals and manages
10
approximately $20.0 billion in capital. Centerbridge’s investment in the Company will be funded by Centerbridge Capital Partners II, L.P., a $4.5 billion fund closed in July 2011, and its affiliates.
The Centerbridge team has in-depth industry experience across a variety of sectors, including restaurants, retail, consumer, hospitality, business services, communications, financial institutions, healthcare, industrial, media, real estate, and transportation. Centerbridge seeks to partner with world-class management teams to help businesses achieve their operating and financial objectives. Limited partners in the Sponsor’s funds include many of the world’s most prominent university endowments, state and corporate pension funds and charitable trusts.
Additional Information
P.F. Chang’s China Bistro, Inc. was incorporated in January 1996 as a Delaware corporation. We conducted our initial public offering in December 1998. We incorporated our subsidiary, Pei Wei Asian Diner, Inc., in December 1999 as a Delaware corporation. Our principal executive offices are located at 7676 East Pinnacle Peak Road, Scottsdale, AZ 85255. Our telephone number at our principal executive offices is 480-888-3000. We maintain a website at www.pfcb.com. The information on our website is not part of this offering memorandum.
11
SUMMARY HISTORICAL AND UNAUDITED PRO FORMA
CONSOLIDATED FINANCIAL AND OTHER DATA
The following tables set forth certain summary historical consolidated financial and other data for P.F. Chang’s China Bistro, Inc. and unaudited pro forma condensed consolidated financial and other data for Wok Parent LLC as of the dates and for the periods indicated. We derived the summary historical consolidated financial and other data as of January 2, 2011 and January 1, 2012 and for fiscal 2009, fiscal 2010 and fiscal 2011 from the audited consolidated financial statements of P.F. Chang’s China Bistro, Inc. that are included elsewhere in this offering memorandum. We derived the summary historical consolidated financial and other data as of April 1, 2012 and for the 13 weeks ended April 3, 2011 and April 1, 2012 from our unaudited consolidated financial statements that are included elsewhere in this offering memorandum. We derived the summary historical consolidated financial and other data as of January 3, 2010 and April 3, 2011 from our audited and unaudited consolidated financial statements, respectively, that are not included in this offering memorandum. We derived the summary historical consolidated financial and other data for the 52 weeks ended April 1, 2012 by taking the summary historical consolidated financial and other data for fiscal 2011, plus the summary historical consolidated financial and other data for the 13 weeks ended April 1, 2012, less the summary historical consolidated financial and other data for the 13 weeks ended April 3, 2011.
The summary unaudited pro forma condensed consolidated financial data presented below have been derived from the unaudited pro forma condensed consolidated financial information of Wok Parent LLC that are included elsewhere in this offering memorandum and give effect to the Transactions, using the acquisition method of accounting, as if they had occurred on April 1, 2012 for purposes of the unaudited pro forma condensed consolidated balance sheet and as of January 3, 2011 for purposes of the unaudited pro forma condensed consolidated statement of income, as more fully described in the assumptions and adjustments set forth under the section entitled “Unaudited Pro Forma Condensed Consolidated Financial Information.”
The summary historical and unaudited pro forma consolidated financial and other data for the 52 weeks ended April 1, 2012 has been included in this offering memorandum in order to provide investors with historical and pro forma information for the latest practicable 52 week period. The pro forma adjustments are based upon available information and certain assumptions that we believe are reasonable. The actual adjustments will be made on the closing date of the Transactions and may differ from those reflected in the summary unaudited pro forma condensed consolidated financial data presented below. Such differences may be material. The summary unaudited pro forma condensed consolidated financial data is for informational purposes only and does not purport to represent what our results of operations or financial position actually would have been if the Transactions had occurred at any date, nor does such data purport to project the results of operations for any future period.
12
The summary historical consolidated financial and other data included below are not necessarily indicative of our future performance. The following information is only a summary and should be read in conjunction with “Use of Proceeds,” “Capitalization,” “Unaudited Pro Forma Condensed Consolidated Financial Information,” “Selected Historical Consolidated Financial Data,” “Management’s Discussion and Analysis of Financial Condition and Results of Operations” and our consolidated financial statements and the related notes thereto contained elsewhere in this offering memorandum.
| 13 Weeks Ended | 52 Weeks Ended | |||||||||||||||||||||||||||
| (in thousands) | Fiscal 2009 (53 weeks) |
Fiscal 2010 (52 weeks) |
Fiscal 2011 (52 weeks) |
April 3, 2011 |
April 1, 2012 |
P.F.
Chang’s Historical April 1, 2012 |
Parent Pro Forma April 1, 2012 |
|||||||||||||||||||||
| (unaudited) | (unaudited) | (unaudited) | (unaudited) | |||||||||||||||||||||||||
| Statements of Income: |
||||||||||||||||||||||||||||
| Revenues |
||||||||||||||||||||||||||||
| Bistro |
$ | 925,321 | $ | 929,372 | $ | 921,379 | $ | 235,782 | $ | 237,976 | $ | 923,573 | $ | 923,573 | ||||||||||||||
| Pei Wei |
302,724 | 310,131 | 311,697 | 80,522 | 79,180 | 310,355 | 310,355 | |||||||||||||||||||||
| Global Brand Development |
134 | 3,296 | 5,679 | 1,065 | 1,752 | 6,366 | 6,366 | |||||||||||||||||||||
|
|
|
|
|
|
|
|
|
|
|
|
|
|
|
|||||||||||||||
| Total revenues |
1,228,179 | 1,242,799 | 1,238,755 | 317,369 | 318,908 | 1,240,294 | 1,240,294 | |||||||||||||||||||||
|
|
|
|
|
|
|
|
|
|
|
|
|
|
|
|||||||||||||||
| Costs and expenses |
||||||||||||||||||||||||||||
| Cost of sales |
326,421 | 324,731 | 325,771 | 83,322 | 86,681 | 329,130 | 329,130 | |||||||||||||||||||||
| Labor |
401,583 | 410,000 | 419,302 | 106,464 | 110,010 | 422,848 | 422,848 | |||||||||||||||||||||
| Operating |
203,859 | 208,294 | 214,050 | 53,807 | 54,286 | 214,529 | 214,529 | |||||||||||||||||||||
| Occupancy |
70,635 | 73,707 | 75,864 | 18,425 | 18,799 | 76,238 | 91,966 | |||||||||||||||||||||
| General and administrative(1) |
82,749 | 81,883 | 70,088 | 20,280 | 22,481 | 72,289 | 72,547 | |||||||||||||||||||||
| Depreciation and amortization |
74,429 | 77,486 | 80,355 | 19,698 | 20,817 | 81,474 | 72,722 | |||||||||||||||||||||
| Asset impairment charges(2) |
— | — | 10,486 | — | — | 10,486 | 10,486 | |||||||||||||||||||||
| Preopening expense |
3,919 | 1,976 | 2,048 | 398 | 494 | 2,144 | 2,144 | |||||||||||||||||||||
| Partner investment expense |
(629 | ) | (318 | ) | (236 | ) | (126 | ) | (330 | ) | (440 | ) | (440 | ) | ||||||||||||||
|
|
|
|
|
|
|
|
|
|
|
|
|
|
|
|||||||||||||||
| Total cost and expenses |
1,162,966 | 1,177,759 | 1,197,728 | 302,268 | 313,238 | 1,208,698 | 1,215,932 | |||||||||||||||||||||
|
|
|
|
|
|
|
|
|
|
|
|
|
|
|
|||||||||||||||
| Income from operations |
65,213 | 65,040 | 41,027 | 15,101 | 5,670 | 31,596 | 24,362 | |||||||||||||||||||||
| Interest and other income (expense), net |
(1,637 | ) | (572 | ) | (288 | ) | 204 | 313 | (179 | ) | (51,313 | ) | ||||||||||||||||
|
|
|
|
|
|
|
|
|
|
|
|
|
|
|
|||||||||||||||
| Income (loss) from continuing operations before taxes |
63,576 | 64,468 | 40,739 | 15,305 | 5,983 | 31,417 | (26,951 | ) | ||||||||||||||||||||
| (Provision) benefit for income taxes |
(18,492 | ) | (17,122 | ) | (10,253 | ) | (4,555 | ) | 322 | (5,376 | ) | 18,129 | ||||||||||||||||
|
|
|
|
|
|
|
|
|
|
|
|
|
|
|
|||||||||||||||
| Income (loss) from continuing operations, net of tax |
45,084 | 47,346 | 30,486 | 10,750 | 6,305 | 26,041 | (8,822 | ) | ||||||||||||||||||||
| Income (loss) from discontinued operations, net of tax(3) |
(479 | ) | 46 | (63 | ) | 3 | — | (66 | ) | — | ||||||||||||||||||
|
|
|
|
|
|
|
|
|
|
|
|
|
|
|
|||||||||||||||
| Net income (loss) |
44,605 | 47,392 | 30,423 | 10,753 | 6,305 | 25,975 | (8,822 | ) | ||||||||||||||||||||
| Less net income attributable to noncontrolling interests |
1,408 | 784 | 346 | 157 | 29 | 218 | 218 | |||||||||||||||||||||
|
|
|
|
|
|
|
|
|
|
|
|
|
|
|
|||||||||||||||
| Net income (loss) attributable to P.F. Chang’s |
$ | 43,197 | $ | 46,608 | $ | 30,077 | $ | 10,596 | $ | 6,276 | $ | 25,757 | $ | (9,040 | ) | |||||||||||||
|
|
|
|
|
|
|
|
|
|
|
|
|
|
|
|||||||||||||||
13
| 13 Weeks Ended | 52 Weeks Ended | |||||||||||||||||||||||||||
| (in thousands) | Fiscal 2009 (53 weeks) |
Fiscal 2010 (52 weeks) |
Fiscal 2011 (52 weeks) |
April 3, 2011 |
April 1, 2012 |
P.F.
Chang’s Historical April 1, 2012 |
Parent Pro Forma April 1, 2012 |
|||||||||||||||||||||
| (unaudited) | (unaudited) | (unaudited) | (unaudited) | |||||||||||||||||||||||||
| Balance Sheet Data (at period end): |
||||||||||||||||||||||||||||
| Cash and cash equivalents |
$ | 63,499 | $ | 71,452 | $ | 50,011 | $ | 72,523 | $ | 55,685 | $ | 55,685 | $ | 4,985 | ||||||||||||||
| Total assets |
652,150 | 634,689 | 576,075 | 612,980 | 563,517 | 563,517 | 1,521,558 | |||||||||||||||||||||
| Long-term debt (including current portion)(4) |
42,448 | 1,258 | 1,240 | 1,269 | 1,276 | 1,276 | 575,476 | |||||||||||||||||||||
| Total P.F. Chang’s common shareholders’ equity |
335,349 | 359,494 | 311,530 | 359,207 | 313,698 | 313,698 | 521,185 | |||||||||||||||||||||
| Net working capital deficit(5) |
(90,617 | ) | (80,103 | ) | (75,276 | ) | (81,298 | ) | (76,577 | ) | (76,577 | ) | (72,635 | ) | ||||||||||||||
| Other Financial Data: |
||||||||||||||||||||||||||||
| Existing unit and corporate capital expenditures |
$ | 25,173 | $ | 23,047 | $ | 25,322 | $ | 4,196 | $ | 7,385 | $ | 28,511 | $ | 28,511 | ||||||||||||||
| New unit capital expenditures |
24,692 | 14,044 | 13,451 | 2,437 | 5,095 | 16,109 | 16,109 | |||||||||||||||||||||
| Share-based compensation expense |
11,552 | 11,777 | (1,485 | ) | 1,659 | 2,374 | (770 | ) | — | |||||||||||||||||||
| EBITDA(6) |
137,755 | 141,788 | 120,973 | 34,645 | 26,458 | 112,786 | 96,866 | |||||||||||||||||||||
| Adjusted EBITDA(6) |
147,236 | 148,792 | 130,632 | 36,081 | 29,135 | 123,686 | 123,686 | |||||||||||||||||||||
| Pro Forma Adjusted EBITDA(7) |
|
132,786 | ||||||||||||||||||||||||||
| Cash interest expense(8) |
|
47,848 | ||||||||||||||||||||||||||
| Net debt(9) |
|
570,491 | ||||||||||||||||||||||||||
| Ratio of net debt to Pro Forma Adjusted EBITDA |
|
4.3 | x | |||||||||||||||||||||||||
| Ratio of Pro Forma Adjusted EBITDA to cash interest expense |
|
2.8 | x | |||||||||||||||||||||||||
| Selected Operating Data (unaudited): |
||||||||||||||||||||||||||||
| Bistro |
||||||||||||||||||||||||||||
| Units (company-owned) |
197 | 201 | 204 | 201 | 204 | 204 | 204 | |||||||||||||||||||||
| Average weekly sales(10) |
$ | 91,161 | $ | 89,989 | $ | 87,972 | $ | 90,181 | $ | 89,696 | $ | 87,858 | $ | 87,858 | ||||||||||||||
| Year-over-year change comparable store sales(11) |
(6.7 | )% | (0.1 | )% | (2.1 | )% | 0.5 | % | (0.6 | )% | (2.3 | )% | (2.3 | )% | ||||||||||||||
| Pei Wei |
||||||||||||||||||||||||||||
| Units (company-owned) |
166 | 168 | 170 | 171 | 170 | 170 | 170 | |||||||||||||||||||||
| Average weekly sales(10) |
$ | 35,171 | $ | 35,632 | $ | 34,854 | $ | 36,501 | $ | 35,942 | $ | 34,715 | $ | 34,715 | ||||||||||||||
| Year-over-year change comparable store sales(11) |
0.1 | % | 1.8 | % | (2.1 | )% | (0.2 | )% | (1.7 | )% | (2.5 | )% | (2.5 | )% | ||||||||||||||
| (1) | General and administrative decreased during fiscal 2011 as a result of a $13.0 million decrease in share-based compensation expense. |
| (2) | Asset impairment charges during fiscal 2011 related to three Bistro restaurants that continue to operate and three Pei Wei restaurants that closed during the fourth quarter of fiscal 2011. |
| (3) | As a result of our decision to close ten Pei Wei stores in 2008, the results of those ten Pei Wei stores (including related asset impairment, lease termination and severance charges recognized during fiscal 2008, 2009, 2010 and 2011) were classified as discontinued operations for all periods presented. |
| (4) | Represents long-term debt (including current portion), net of any original issue discount. |
| (5) | Net working capital is defined as inventories plus other current assets less accounts payable less unearned revenue less accrued expenses. |
14
| (6) | The following is a reconciliation of EBITDA, Adjusted EBITDA and Adjusted EBITDAR to net income (loss) attributable to P.F. Chang’s, which is the most directly comparable GAAP financial measure. See “Use of Non-GAAP Financial Information” for our definition of, and important uses and limitations on, these non-GAAP measures. |
| 13 Weeks Ended | 52 Weeks Ended | |||||||||||||||||||||||||||
| (in thousands) | Fiscal 2009 (53 weeks) |
Fiscal 2010 (52 weeks) |
Fiscal 2011 (52 weeks) |
April 3, 2011 |
April 1, 2012 |
P.F.
Chang’s Historical April 1, 2012 |
Parent Pro Forma April 1, 2012 |
|||||||||||||||||||||
| Net income (loss) attributable to P.F. Chang’s |
$ | 43,197 | $ | 46,608 | $ | 30,077 | $ | 10,596 | $ | 6,276 | $ | 25,757 | $ | (9,040 | ) | |||||||||||||
| Interest and other expense (income), net |
1,637 | 572 | 288 | (204 | ) | (313 | ) | 179 | 51,313 | |||||||||||||||||||
| Provision (benefit) for income taxes |
18,492 | 17,122 | 10,253 | 4,555 | (322 | ) | 5,376 | (18,129 | ) | |||||||||||||||||||
| Depreciation and amortization |
74,429 | 77,486 | 80,355 | 19,698 | 20,817 | 81,474 | 72,722 | |||||||||||||||||||||
|
|
|
|
|
|
|
|
|
|
|
|
|
|
|
|||||||||||||||
|
EBITDA |
137,755 | 141,788 | 120,973 | 34,645 | 26,458 | 112,786 | 96,866 | |||||||||||||||||||||
|
|
|
|
|
|
|
|
|
|
|
|
|
|
|
|||||||||||||||
| Asset impairment(a) |
— | — | 11,832 | — | — | 11,832 | 11,832 | |||||||||||||||||||||
| Non-cash rent expense(b) |
(8,023 | ) | (9,467 | ) | (10,758 | ) | (2,647 | ) | (2,891 | ) | (11,002 | ) | 4,726 | |||||||||||||||
| Non-cash compensation, net(c) |
9,931 | 9,929 | (4,055 | ) | 1,320 | 2,354 | (3,021 | ) | (2,763 | ) | ||||||||||||||||||
| Pre-opening expenses(d) |
3,919 | 1,976 | 2,048 | 398 | 494 | 2,144 | 2,144 | |||||||||||||||||||||
| Cost savings(e) |
3,432 | 3,248 | 3,943 | 697 | 530 | 3,776 | 3,776 | |||||||||||||||||||||
| Full year restaurants and license(f) |
— | 2,382 | 3,619 | 762 | 303 | 3,160 | 3,160 | |||||||||||||||||||||
| True Food Kitchen EBITDA(g) |
— | — | 1,169 | 341 | 549 | 1,377 | 1,377 | |||||||||||||||||||||
| Other, net(h) |
222 | (1,064 | ) | 1,861 | 565 | 1,338 | 2,634 | 2,568 | ||||||||||||||||||||
|
|
|
|
|
|
|
|
|
|
|
|
|
|
|
|||||||||||||||
| Adjusted EBITDA |
147,236 | 148,792 | 130,632 | 36,081 | 29,135 | 123,686 | 123,686 | |||||||||||||||||||||
|
|
|
|
|
|
|
|
|
|
|
|
|
|
|
|||||||||||||||
| Net cash rent(i) |
53,791 | 56,718 | 59,476 | 14,563 | 15,072 | 59,985 | 59,985 | |||||||||||||||||||||
|
|
|
|
|
|
|
|
|
|
|
|
|
|
|
|||||||||||||||
| Adjusted EBITDAR |
201,027 | 205,510 | 190,108 | 50,644 | 44,207 | 183,671 | 183,671 | |||||||||||||||||||||
|
|
|
|
|
|
|
|
|
|
|
|
|
|
|
|||||||||||||||
| (a) | Relates to $10.5 million of asset impairment charges during fiscal 2011 related to three Bistro restaurants and three Pei Wei restaurants and $1.3 million of lease termination charges. |
| (b) | Represents the difference between straight-line rent expense per GAAP and cash rent expense. |
| (c) | Represents share-based compensation expense and gains and losses from our employee Restoration Plan, net of historical expenses of certain employees’ share-based awards, a portion of which will be replaced by cash-based compensation post-closing. |
| (d) | Pre-opening expenses consist primarily of manager salaries, employee payroll and related training costs which are incurred prior to the opening of a restaurant and do not relate to ongoing operations. |
| (e) | Relates primarily to cost savings resulting from (i) no longer having publicly traded equity securities post-closing, such as reductions in board of directors fees, directors’ and officers’ insurance premiums, and certain professional fees and (ii) four executive management positions which have already been vacated and will not be replaced. Also included is a severance charge for certain key employees which approximated $1.0 million in fiscal 2011. |
| (f) | Represents management’s estimates of additional contribution from Company-owned restaurants and additional royalties from international restaurants that were open for only a portion of the 52-week period ended April 1, 2012, as if such restaurants had been open for the full period. Such estimates are based upon available information and certain assumptions that management believes are reasonable under the circumstances. There can be no assurance that the actual contribution or royalties from these restaurants, had they been open for the full period, would equal these amounts. Also reflects retail licensing royalties as if the current royalty rate had been in effect throughout the entire contract period. |
| (g) | Represents 51% of EBITDA from True Food Kitchen, assuming consolidation of True Food Kitchen as a result of converting note receivable from True Food Kitchen to a 51% equity interest. For purposes of this item, we used the financial information provided by True Food Kitchen which was prepared pursuant to the applicable accounting principles for True Food Kitchen (which may differ from GAAP and which was unaudited in certain circumstances). Accordingly, although we believe that the financial information provided by True Food Kitchen is accurate, such information has not been and cannot be independently verified by our management. If the conversion of the note receivable from True Food Kitchen to a 51% equity interest does not occur, we will continue to receive interest income, ranging from $0.7 million to $1.1 million annually, depending on the outstanding note receivable balance. As of April 1, 2012, the note receivable was $7.0 million with an additional $3.0 million remaining available under the loan facility. |
| (h) | Primarily consists of effects from change in accounting methods, various non-recurring and non-cash items including professional fees recognized in connection with the Transactions and related preceding events, removal of EBITDA from three Pei Wei restaurants closed in fiscal 2011, income (loss) from discontinued operations and net income attributable to noncontrolling interest less cash distributions to noncontrolling interests. |
15
| (i) | Net cash rent includes base rent, sales tax on base rent, and percentage rent and excludes common area maintenance and real property tax expense. |
| (7) | The following is a reconciliation of Pro Forma Adjusted EBITDA and Pro Forma Adjusted EBITDAR to Adjusted EBITDA. Adjusted EBITDA is reconciled to net income attributable to P.F. Chang’s above in footnote (6). See “Use of Non-GAAP Financial Information” for our definition of, and important uses and limitations on, these non-GAAP measures. |
| 52 Weeks Ended |
||||
| (dollars in thousands) | Parent Pro Forma April 1, 2012 |
|||
| Adjusted EBITDA |
$ | 123,686 | ||
| Implementation of strategic sourcing initiatives(a) |
9,100 | |||
|
|
|
|||
| Pro Forma Adjusted EBITDA |
132,786 | |||
|
|
|
|||
| Net cash rent(b) |
59,985 | |||
|
|
|
|||
| Pro Forma Adjusted EBITDAR |
192,771 | |||
|
|
|
|||
| (a) | Represents management’s estimate of the full-year effect of sourcing improvements in various food items and selected supplies already implemented. |
| (b) | Net cash rent includes base rent, sales tax on base rent, and percentage rent and excludes common area maintenance and real property tax expense. |
| (8) | Cash interest expense includes estimated annual cash interest expense under the Senior Credit Facilities and the notes offered hereby, but excludes amortization of deferred financing fees and accretion of original issue discount. See “Unaudited Pro Forma Condensed Consolidated Financial Information.” |
| (9) | Net debt is calculated as long-term debt (including the current portion thereof net of any original issue discount) less cash and cash equivalents. |
| (10) | Average weekly sales represent an average sales amount per restaurant and helps gauge the changes in traffic, pricing and brand development. |
| (11) | Year-over-year change comparable store sales include the change in year-over-year sales for restaurants that have been open 18 months or more in order to remove the impact of new restaurant openings in comparing the operations of existing restaurants. |
16
UNAUDITED PRO FORMA CONDENSED CONSOLIDATED FINANCIAL INFORMATION
The following unaudited pro forma condensed consolidated financial statements of Wok Parent LLC, our indirect parent company and guarantor of the notes offered hereby, have been derived by applying pro forma adjustments to our historical consolidated financial statements included elsewhere in this offering memorandum. The unaudited pro forma condensed consolidated statements of operations give effect to the Transactions as if they had occurred on January 3, 2011. The unaudited pro forma condensed consolidated balance sheet gives effect to the Transactions as if they had occurred on April 1, 2012. The unaudited pro forma condensed consolidated statement of operations for the 52 weeks ended April 1, 2012 has been derived by taking the pro forma condensed consolidated statement of operations for the year ended January 1, 2012, plus the pro forma condensed consolidated statement of operations for the 13 weeks ended April 1, 2012, less the pro forma condensed consolidated statement of income for the 13 weeks ended April 3, 2011. The pro forma condensed consolidated financial information for the 52 weeks ended April 1, 2012 has been included in this offering memorandum in order to provide investors with historical and pro forma information for the latest practicable 52 week period.
The unaudited pro forma adjustments are based upon available information and certain assumptions that we believe are reasonable under the circumstances. The unaudited pro forma condensed consolidated financial statements are presented for informational purposes only. The unaudited pro forma condensed consolidated financial statements do not purport to represent what our actual consolidated results of operations or the consolidated financial condition would have been had the Transactions actually occurred on the dates indicated, nor does it purport to project our results of operations or financial condition for any future period or as of any future date. The unaudited pro forma condensed consolidated financial statements should be read in conjunction with the information contained in “Summary—Summary Historical and Unaudited Pro Forma Consolidated Financial and Other Data,” “The Transactions,” “Selected Historical Consolidated Financial Data,” “Management’s Discussion and Analysis of Financial Condition and Results of Operations” and the audited consolidated financial statements and the notes thereto included elsewhere in this offering memorandum. All pro forma adjustments and their underlying assumptions are described more fully in the notes to our unaudited pro forma condensed consolidated financial statements.
The unaudited pro forma condensed consolidated statements of operations and income give effect to adjustments that are (i) directly attributable to the Transactions, (ii) factually supportable and (iii) expected to have a continuing impact. The unaudited pro forma condensed consolidated balance sheet gives effect to adjustments that are (i) directly attributable to the Transactions and (ii) factually supportable, regardless of whether they have a continuing impact or are non-recurring.
The Acquisition will be accounted for using the acquisition method of accounting. The pro forma information presented, including allocations of purchase price, is based on preliminary estimates of fair value of assets and liabilities, available information as of the date of this offering memorandum and management assumptions, and will be revised as additional information becomes available. The actual adjustments to our consolidated financial statements upon the closing of the Transactions will depend on a number of factors, including a final independent third-party valuation of assets and liabilities and the actual balance of our net assets on the closing date of the Acquisition. Therefore, the actual adjustments will differ from the pro forma adjustments, and the differences may be material.
17
WOK PARENT LLC
UNAUDITED PRO FORMA CONDENSED CONSOLIDATED BALANCE SHEET
As of April 1, 2012
(Dollars in thousands)
| P.F. Chang’s China Bistro, Inc. Historical |
Pro Forma Adjustments |
Wok Parent LLC Pro Forma |
||||||||||
|
Assets |
||||||||||||
| Current assets: |
||||||||||||
| Cash and cash equivalents |
$ | 55,685 | $ | (50,700 | )(1) | $ | 4,985 | |||||
| Inventories |
6,131 | — | 6,131 | |||||||||
| Other current assets |
42,278 | — | 42,278 | |||||||||
|
|
|
|
|
|
|
|||||||
| Total current assets |
104,094 | (50,700 | ) | 53,394 | ||||||||
| Property and equipment, net |
405,572 | 131,205 | (2) | 536,777 | ||||||||
| Goodwill |
6,819 | 466,179 | (2) | 472,998 | ||||||||
| Intangible assets, net |
17,083 | 394,247 | (2) | 411,330 | ||||||||
| Other assets |
29,949 | 2,697 | (2) | 47,059 | ||||||||
| 14,413 | (3) | |||||||||||
|
|
|
|
|
|
|
|||||||
| Total assets |
$ | 563,517 | $ | 958,041 | $ | 1,521,558 | ||||||
|
|
|
|
|
|
|
|||||||
| Liabilities and equity |
||||||||||||
| Current liabilities: |
||||||||||||
| Accounts payable |
$ | 24,521 | $ | — | $ | 24,521 | ||||||
| Accrued expenses |
67,524 | (3,942 | )(4) | 63,582 | ||||||||
| Unearned revenue |
32,941 | — | 32,941 | |||||||||
| Current portion of long-term debt |
87 | 2,800 | (5) | 2,887 | ||||||||
|
|
|
|
|
|
|
|||||||
| Total current liabilities |
125,073 | (1,142 | ) | 123,931 | ||||||||
| Deferred rent |
108,613 | (108,613 | )(2) | — | ||||||||
| Long-term debt |
1,189 | 571,400 | (5) | 572,589 | ||||||||
| Other liabilities |
14,566 | (10,974 | )(6) | 3,592 | ||||||||
| Deferred income tax liability |
— | 265,973 | (2) | 265,973 | ||||||||
| Unfavorable leases |
— | 33,910 | (2) | 33,910 | ||||||||
|
|
|
|
|
|
|
|||||||
| Total liabilities |
249,441 | 750,554 | 999,995 | |||||||||
| Commitments and contingencies |
||||||||||||
| Equity: |
||||||||||||
| Total P.F. Chang’s common stockholders’/member’s equity |
313,698 | 207,487 | (7) | 521,185 | ||||||||
| Noncontrolling interests |
378 | — | 378 | |||||||||
|
|
|
|
|
|
|
|||||||
| Total equity |
314,076 | 207,487 | 521,563 | |||||||||
|
|
|
|
|
|
|
|||||||
| Total liabilities and equity |
$ | 563,517 | $ | 958,041 | $ | 1,521,558 | ||||||
|
|
|
|
|
|
|
|||||||
18
WOK PARENT LLC
NOTES TO UNAUDITED PRO FORMA CONDENSED CONSOLIDATED BALANCE SHEET
| (1) | Represents the net effect of the Transactions on cash and cash equivalents based on the estimated sources and uses of cash for the Transactions as if they had occurred on April 1, 2012 as presented below (in millions): |
| Sources |
Uses |
|||||||||
| Senior Credit Facilities: |
Cash purchase of equity | $ | 1,123.9 | |||||||
| Senior secured term loan |
$ | 280.0 | Transaction fees and expenses | 58.0 | ||||||
| Senior secured revolving loan facility |
— | |||||||||
| Notes offered hereby |
300.0 | |||||||||
| Equity contribution |
551.2 | |||||||||
| Cash on hand |
50.7 | |||||||||
|
|
|
|
|
|||||||
| Total sources |
$ | 1,181.9 | Total uses | $ | 1,181.9 | |||||
|
|
|
|
|
|||||||
The equity contribution of $551.2 million and cash on hand of $50.7 million will be used with borrowings under the senior secured term loan of $280.0 million aggregate principal amount and notes offered hereby of $300.0 million aggregate principal amount to fund the cash purchase consideration of $1,123.9 million and estimated transaction fees and expenses of $58.0 million. See “Use of Proceeds.”
| (2) | Reflects the effect of acquisition method accounting based on preliminary allocation of the $1,123.9 million purchase price to identifiable assets acquired and liabilities assumed, based on preliminary valuations by an independent third-party appraisal firm. The preliminary allocation is summarized as follows (in thousands): |
| Fair value of P.F Chang’s equity interests |
||||||||
| Cash paid to acquire P.F. Chang’s China Bistro, Inc. equity interests |
$ | 1,123,900 | ||||||
| Fair value of noncontrolling interests |
378 | |||||||
|
|
|
|||||||
| Subtotal |
$ | 1,124,278 | ||||||
| Book value of P.F. Chang’s |
||||||||
| Historical book value of net assets |
$ | 314,076 | ||||||
| Less: Assets not acquired and liabilities not assumed relating to the employee Restoration Plan, share-based awards and deferred financing costs of existing credit facility |
(7,144 | ) | ||||||
|
|
|
|||||||
| Net assets acquired |
321,220 | |||||||
|
|
|
|||||||
| Excess of costs of acquisition over net assets acquired |
$ | 803,058 | ||||||
|
|
|
|||||||
| Allocated to: |
||||||||
| Property and equipment, net |
$ | 131,205 | ||||||
| Goodwill |
466,179 | |||||||
| Intangible assets, net |
394,247 | |||||||
| Other assets |
2,697 | |||||||
| Deferred rent write down |
108,613 | |||||||
| Unfavorable leases (included in Other liabilities) |
(33,910 | ) | ||||||
| Deferred income tax liability |
(265,973 | ) | ||||||
|
|
|
|||||||
| Total adjustment |
$ | 803,058 | ||||||
|
|
|
|||||||
19
The preliminary estimated fair value of intangible assets is as follows (in thousands):
| As of April 1, 2012 | ||||||||
| Historical Net Book Value |
Preliminary Estimated Fair Value |
|||||||
| Brands and others |
$ | 17,083 | $ | 337,000 | ||||
| Favorable leases |
— | 74,330 | ||||||
|
|
|
|
|
|||||
| Total |
$ | 17,083 | $ | 411,330 | ||||
|
|
|
|
|
|||||
As a result of the restructuring transactions described in “The Transactions,” Pei Wei Asian Diner, Inc. and its subsidiaries will be converted into limited liability companies, which will be treated as partnerships from a tax perspective. After the restructuring, the common units of Pei Wei Asian Diner, LLC will be owned by Wok Parent LLC, which is considered a pass-through entity from a tax perspective, and the preferred units of Pei Wei Asian Diner, LLC will be owned by P.F. Chang’s China Bistro, Inc., a taxable entity. Therefore, the deferred tax of Pei Wei was calculated based on the difference between the tax and the accounting bases of preferred units, owned by the taxable entity. The deferred tax of the rest of our businesses was calculated based on the difference between the tax and the accounting bases of assets acquired and liabilities assumed.
Transaction costs have been allocated between Acquisition-related activities and various financing costs based on our current estimates. These estimates will be revised to reflect actual amounts at closing. Costs relating to the Acquisition and the unused bridge facility are not capitalized, but are accounted for as period expenses. Of the total estimated $58.0 million of costs expected to be incurred in connection with the Transactions, approximately $30.0 million is expected to be attributed to the Acquisition and the unused bridge facility. Such costs are not reflected in the pro forma statements of operations.
| (3) | Adjustments to other assets represent: |
| (i) | Costs attributable to the financing of the Acquisition, which are capitalized as debt financing costs, estimated to be $22.2 million, net of write-off of historical deferred financing costs of $0.5 million; and |
| (ii) | Reduction of the Restoration Plan investments as a result of the Transactions in the amount of $7.3 million, which will be liquidated at closing. See Note 6(i) below for discussion of Restoration Plan liabilities. |
| (4) | Adjustments to accrued expenses reflect the reduction of unvested outstanding liability-classified awards in the amount of $3.9 million, which will be paid out at the closing of the Transactions. |
| (5) | Adjustments reflect additional indebtedness issued in connection with the Transactions consisting of our senior notes offered hereby in the aggregate principal amount of $300.0 million and senior secured term loan facility in the aggregate principal amount of $280.0 million, including the current portion thereof of $2.8 million, net of original issue discount of $5.8 million in total. |
| (6) | Adjustments to other liabilities reflect: |
| (i) | Reduction of the majority of the Restoration Plan liabilities that will be paid as a result of the Transactions in the amount of $7.5 million. The Restoration Plan liabilities consist of participants’ and company match contributions to the Restoration Plan. See Note 3(ii) above for discussion of Restoration Plan investments; and |
20
| (ii) | Reduction of unvested outstanding liability-classified awards of $3.5 million, which will be paid out at the closing of the Transactions. |
| (7) | Adjustments to equity reflect: |
| (i) | Equity contributions in the amount of $551.2 million, net of transaction costs of $30.0 million, which were expensed, relating to the Acquisition and the unused bridge facility as discussed in Note 1 above; and |
| (ii) | Elimination of historical equity in the amount of $313.7 million. |
21
WOK PARENT LLC
UNAUDITED PRO FORMA CONDENSED CONSOLIDATED STATEMENT OF OPERATIONS
For the fiscal year ended January 1, 2012
(Dollars in thousands)
| P.F. Chang’s China Bistro, Inc. Historical |
Pro Forma Adjustments |
Wok Parent LLC Pro Forma |
||||||||||
| Revenues |
||||||||||||
| Restaurant sales |
$ | 1,233,076 | $ | — | $ | 1,233,076 | ||||||
| Restaurant licensing |
3,065 | — | 3,065 | |||||||||
| Retail licensing |
2,614 | — | 2,614 | |||||||||
|
|
|
|
|
|
|
|||||||
| Total revenues |
1,238,755 | — | 1,238,755 | |||||||||
|
|
|
|
|
|
|
|||||||
| Costs and expenses |
||||||||||||
| Cost of sales |
325,771 | — | 325,771 | |||||||||
| Labor |
419,302 | — | 419,302 | |||||||||
| Operating |
214,050 | — | 214,050 | |||||||||
| Occupancy |
75,864 | 15,879 | (1) | 91,743 | ||||||||
| General and administrative |
70,088 | 1,305 | (2) | 71,393 | ||||||||
| Depreciation and amortization |
80,355 | (7,636 | )(3) | 72,719 | ||||||||
| Asset impairment charges |
10,486 | — | 10,486 | |||||||||
| Preopening expense |
2,048 | — | 2,048 | |||||||||
| Partner investment expense |
(236 | ) | — | (236 | ) | |||||||
|
|
|
|
|
|
|
|||||||
| Total costs and expenses |
1,197,728 | 9,548 | 1,207,276 | |||||||||
|
|
|
|
|
|
|
|||||||
| Income from operations |
41,027 | (9,548 | ) | 31,479 | ||||||||
| Interest and other income (expense), net |
(288 | ) | (50,922 | )(4) | (51,210 | ) | ||||||
|
|
|
|
|
|
|
|||||||
| Income (loss) from continuing operations before taxes |
40,739 | (60,470 | ) | (19,731 | ) | |||||||
| (Provision) benefit for income taxes |
(10,253 | ) | 24,685 | (5) | 14,432 | |||||||
|
|
|
|
|
|
|
|||||||
| Income (loss) from continuing operations, net of tax |
30,486 | (35,785 | ) | (5,299 | ) | |||||||
| Less net income attributable to noncontrolling interests |
346 | — | 346 | |||||||||
|
|
|
|
|
|
|
|||||||
| Net income (loss) from continuing operations attributable to P.F. Chang’s |
$ | 30,140 | $ | (35,785 | ) | $ | (5,645 | ) | ||||
|
|
|
|
|
|
|
|||||||
22
WOK PARENT LLC
UNAUDITED PRO FORMA CONDENSED CONSOLIDATED STATEMENT OF OPERATIONS
For the 13 weeks ended April 1, 2012
(Dollars in thousands)
| P.F. Chang’s China Bistro, Inc. Historical |
Pro Forma Adjustments |
Wok Parent LLC Pro Forma |
||||||||||
| Revenues |
||||||||||||
| Restaurant sales |
$ | 317,156 | $ | — | $ | 317,156 | ||||||
| Restaurant licensing |
1,056 | — | 1,056 | |||||||||
| Retail licensing |
696 | — | 696 | |||||||||
|
|
|
|
|
|
|
|||||||
| Total revenues |
318,908 | — | 318,908 | |||||||||
|
|
|
|
|
|
|
|||||||
| Costs and expenses |
||||||||||||
| Cost of sales |
86,681 | — | 86,681 | |||||||||
| Labor |
110,010 | — | 110,010 | |||||||||
| Operating |
54,286 | — | 54,286 | |||||||||
| Occupancy |
18,799 | 4,370 | (1) | 23,169 | ||||||||
| General and administrative |
22,481 | (3,052 | )(2) | 19,429 | ||||||||
| Depreciation and amortization |
20,817 | (2,632 | )(3) | 18,185 | ||||||||
| Asset impairment charges |
— | — | — | |||||||||
| Preopening expense |
494 | — | 494 | |||||||||
| Partner investment expense |
(330 | ) | — | (330 | ) | |||||||
|
|
|
|
|
|
|
|||||||
| Total costs and expenses |
313,238 | (1,314 | ) | 311,924 | ||||||||
|
|
|
|
|
|
|
|||||||
| Income from operations |
5,670 | 1,314 | 6,984 | |||||||||
| Interest and other income (expense), net |
313 | (13,203 | )(4) | (12,890 | ) | |||||||
|
|
|
|
|
|
|
|||||||
| Income (loss) from continuing operations before taxes |
5,983 | (11,889 | ) | (5,906 | ) | |||||||
| Benefit from income taxes |
322 | 4,930 | (5) | 5,252 | ||||||||
|
|
|
|
|
|
|
|||||||
| Income (loss) from continuing operations, net of tax |
6,305 | (6,959 | ) | (654 | ) | |||||||
| Less net income attributable to noncontrolling interests |
29 | — | 29 | |||||||||
|
|
|
|
|
|
|
|||||||
| Net income (loss) from continuing operations attributable to P.F. Chang’s |
$ | 6,276 | $ | (6,959 | ) | $ | (683 | ) | ||||
|
|
|
|
|
|
|
|||||||
23
WOK PARENT LLC
UNAUDITED PRO FORMA CONDENSED CONSOLIDATED STATEMENT OF INCOME
For the 13 weeks ended April 3, 2011
(Dollars in thousands)
| P.F. Chang’s China Bistro, Inc. Historical |
Pro Forma Adjustments |
Wok Parent LLC Pro Forma |
||||||||||
| Revenues |
||||||||||||
| Restaurant sales |
$ | 316,304 | $ | — | $ | 316,304 | ||||||
| Restaurant licensing |
684 | — | 684 | |||||||||
| Retail licensing |
381 | — | 381 | |||||||||
|
|
|
|
|
|
|
|||||||
| Total revenues |
317,369 | — | 317,369 | |||||||||
|
|
|
|
|
|
|
|||||||
| Costs and expenses |
||||||||||||
| Cost of sales |
83,322 | — | 83,322 | |||||||||
| Labor |
106,464 | — | 106,464 | |||||||||
| Operating |
53,807 | — | 53,807 | |||||||||
| Occupancy |
18,425 | 4,521 | (1) | 22,946 | ||||||||
| General and administrative |
20,280 | (2,005 | )(2) | 18,275 | ||||||||
| Depreciation and amortization |
19,698 | (1,516 | )(3) | 18,182 | ||||||||
| Asset impairment charges |
— | — | — | |||||||||
| Preopening expense |
398 | — | 398 | |||||||||
| Partner investment expense |
(126 | ) | — | (126 | ) | |||||||
|
|
|
|
|
|
|
|||||||
| Total costs and expenses |
302,268 | 1,000 | 303,268 | |||||||||
|
|
|
|
|
|
|
|||||||
| Income from operations |
15,101 | (1,000 | ) | 14,101 | ||||||||
| Interest and other income (expense), net |
204 | (12,991 | )(4) | (12,787 | ) | |||||||
|
|
|
|
|
|
|
|||||||
| Income from continuing operations before taxes |
15,305 | (13,991 | ) | 1,314 | ||||||||
| (Provision) benefit for income taxes |
(4,555 | ) | 6,110 | (5) | 1,555 | |||||||
|
|
|
|
|
|
|
|||||||
| Income from continuing operations, net of tax |
10,750 | (7,881 | ) | 2,869 | ||||||||
| Less net income attributable to noncontrolling interests |
157 | — | 157 | |||||||||
|
|
|
|
|
|
|
|||||||
| Net income from continuing operations attributable to P.F. Chang’s |
$ | 10,593 | $ | (7,881 | ) | $ | 2,712 | |||||
|
|
|
|
|
|
|
|||||||
24
WOK PARENT LLC
UNAUDITED PRO FORMA CONDENSED CONSOLIDATED STATEMENT OF OPERATIONS
For the 52 weeks ended April 1, 2012
(Dollars in thousands)
| P.F. Chang’s China Bistro, Inc. Historical |
Pro Forma Adjustments |
Wok Parent LLC Pro Forma |
||||||||||
| Revenues |
||||||||||||
| Restaurant sales |
$ | 1,233,928 | $ | — | $ | 1,233,928 | ||||||
| Restaurant licensing |
3,437 | — | 3,437 | |||||||||
| Retail licensing |
2,929 | — | 2,929 | |||||||||
|
|
|
|
|
|
|
|||||||
| Total revenues |
1,240,294 | — | 1,240,294 | |||||||||
|
|
|
|
|
|
|
|||||||
| Costs and expenses |
||||||||||||
| Cost of sales |
329,130 | — | 329,130 | |||||||||
| Labor |
422,848 | — | 422,848 | |||||||||
| Operating |
214,529 | — | 214,529 | |||||||||
| Occupancy |
76,238 | 15,728 | (1) | 91,966 | ||||||||
| General and administrative |
72,289 | 258 | (2) | 72,547 | ||||||||
| Depreciation and amortization |
81,474 | (8,752 | )(3) | 72,722 | ||||||||
| Asset impairment charges |
10,486 | — | 10,486 | |||||||||
| Preopening expense |
2,144 | — | 2,144 | |||||||||
| Partner investment expense |
(440 | ) | — | (440 | ) | |||||||
|
|
|
|
|
|
|
|||||||
| Total costs and expenses |
1,208,698 | 7,234 | 1,215,932 | |||||||||
|
|
|
|
|
|
|
|||||||
| Income from operations |
31,596 | (7,234 | ) | 24,362 | ||||||||
| Interest and other income (expense), net |
(179 | ) | (51,134 | )(4) | (51,313 | ) | ||||||
|
|
|
|
|
|
|
|||||||
| Income (loss) from continuing operations before taxes |
31,417 | (58,368 | ) | (26,951 | ) | |||||||
| (Provision) benefit for income taxes |
(5,376 | ) | 23,505 | (5) | 18,129 | |||||||
|
|
|
|
|
|
|
|||||||
| Income (loss) from continuing operations, net of tax |
26,041 | (34,863 | ) | (8,822 | ) | |||||||
| Less net income attributable to noncontrolling interests |
218 | — | 218 | |||||||||
|
|
|
|
|
|
|
|||||||
| Net income (loss) from continuing operations attributable to P.F. Chang’s |
$ | 25,823 | $ | (34,863 | ) | $ | (9,040 | ) | ||||
|
|
|
|
|
|
|
|||||||
25
WOK PARENT LLC
NOTES TO UNAUDITED PRO FORMA CONDENSED CONSOLIDATED STATEMENTS OF OPERATIONS
| (1) | Represents the adjustment to straight-line rent expense based upon elimination of existing deferred rent balances and re-assessment of remaining lease payment terms as of the first day of fiscal year 2011. |
| (2) | Reflects the elimination of gains or losses relating to existing Restoration Plan liabilities, which will be settled at closing, and share-based compensation awards, which will be paid out at closing. |
| Fiscal Year Ended January 1, 2012 |
Thirteen Weeks Ended | Fifty-Two Weeks Ended April 1, 2012 |
||||||||||||||
| April 1, 2012 |
April 3, 2011 |
|||||||||||||||
| Elimination of share-based compensation |
$ | 1,184 | $ | (2,460 | ) | $ | (1,732 | ) | $ | 456 | ||||||
| Elimination of Restoration Plan gains/losses |
121 | (592 | ) | (273 | ) | (198 | ) | |||||||||
|
|
|
|
|
|
|
|
|
|||||||||
| $ | 1,305 | $ | (3,052 | ) | $ | (2,005 | ) | $ | 258 | |||||||
|
|
|
|
|
|
|
|
|
|||||||||
| (3) | Reflects a change in depreciation and amortization expenses resulting from the preliminary, estimated fair value and estimated useful lives assigned to property and equipment and amortizable intangible assets. The adjustment also records both favorable and unfavorable lease amortization over an average estimated remaining life of approximately 10 years for both favorable lease assets and unfavorable lease liabilities. |
| Fiscal Year Ended January 1, 2012 |
Thirteen Weeks Ended | Fifty-Two Weeks Ended April 1, 2012 |
||||||||||||||
| April 1, 2012 |
April 3, 2011 |
|||||||||||||||
| Effects of change in depreciation and amortization expense |
$ | (11,675 | ) | $ | (3,642 | ) | $ | (2,526 | ) | $ | (12,791 | ) | ||||
| Favorable lease amortization |
7,597 | 1,899 | 1,899 | 7,597 | ||||||||||||
| Unfavorable lease amortization |
(3,558 | ) | (889 | ) | (889 | ) | (3,558 | ) | ||||||||
|
|
|
|
|
|
|
|
|
|||||||||
| $ | (7,636 | ) | $ | (2,632 | ) | $ | (1,516 | ) | $ | (8,752 | ) | |||||
|
|
|
|
|
|
|
|
|
|||||||||
| (4) | Reflects incremental interest expense related to our new Senior Credit Facilities and notes offered hereby, net of interest expense related to our existing credit facility, which will be terminated at closing. Amortization of original issue discount and deferred financing costs is calculated using an effective interest rate method, except for amortization of deferred financing costs for our senior secured revolving loan facility, which is calculated using a straight-line method. Also reflects the elimination of other income relating to Restoration Plan assets, which will be liquidated at closing. |
| Fiscal Year Ended January 1, 2012 |
Thirteen Weeks Ended | Fifty-Two Weeks Ended April 1, 2012 |
||||||||||||||
| April 1, 2012 |
April 3, 2011 |
|||||||||||||||
| Interest expense related to new debt |
$ | (51,490 | ) | $ | (12,884 | ) | $ | (12,871 | ) | $ | (51,503 | ) | ||||
| Restoration Plan and other |
568 | (319 | ) | (120 | ) | 369 | ||||||||||
|
|
|
|
|
|
|
|
|
|||||||||
| $ | (50,922 | ) | $ | (13,203 | ) | $ | (12,991 | ) | $ | (51,134 | ) | |||||
|
|
|
|
|
|
|
|
|
|||||||||
26
Pro forma interest expense assumes a weighted average interest rate of 8.2%. A 0.125% change would increase (or decrease) pro forma annual cash interest expense on the $580.0 million aggregate principal amount of indebtedness outstanding at the closing of the Acquisition by approximately $0.7 million.
| (5) | Reflects the estimated tax effects of pro forma adjustments resulting from the Transactions at the estimated statutory tax rate of 39.5%, including tax effects of Pei Wei restructuring as described in Note (2) of our unaudited pro forma balance sheet. |
27